Transcription
United StatesDepartment ofAgricultureAgriculturalMarketingServiceMay 2009Facts onDirect-to-Consumer Food MarketingIncorporating Data from the 2007 Census of AgricultureWritten by:Adam DiamondAgricultural Marketing SpecialistRicardo SotoAgricultural Marketing AssistantMarketing Services Division1
Preferred CitationDiamond, Adam, and Ricardo Soto. Facts on Direct-to-Consumer Food Marketing: Incorporating Data from the 2007Census of Agriculture. U.S. Department of Agriculture, Agricultural Marketing Service, May 2009. http://dx.doi.org/10.9752/MS035.05-2009 The U.S. Department of Agriculture (USDA) prohibits discrimination in all its programs and activities on the basis of race,color, national origin, age, disability, and, where applicable, sex, marital status, familial status, parental status, religion,sexual orientation, genetic information, political beliefs, reprisal, or because all or a part of an individual's income isderived from any public assistance program. (Not all prohibited bases apply to all programs.)Persons with disabilities who require alternative means for communication of program information (Braille, large print,audiotape, etc.) should contact USDA's TARGET Center at (202) 720-2600 (voice and TDD). To file a complaint ofdiscrimination write to USDA, Director, Office of Civil Rights, 1400 Independence Avenue, S.W., Washington, DC 202509410 or call (800) 795-3272 (voice) or (202) 720-6382 (TDD). USDA is an equal opportunity provider and employer.
IntroductionEvery 5 years, USDA’s National Agricultural Statistics Service (NASS) engages in a comprehensive study ofthe U.S. farm economy, known as the Census of Agriculture. The Census examines various facets of farmownership, structure, and production and marketing practices. Beginning with the 1997 Census, NASS hascollected specific information from farm operators regarding their use of direct-to-consumer marketingoutlets to sell food for human consumption, recognizing that many farmers are turning to direct-toconsumer sales as a way to increase their share of consumer food expenditures.This factsheet on direct marketing developments and trends is designed to provide an overview of thegrowing importance of direct marketing to U.S. farmers, in general, and to specific regions and States, inparticular, by extracting and summarizing data from the 2007 Census of Agriculture, and comparing thesedata with those from 1997 and 2002. Among the issues examined in the factsheet are absolute changesin the value of direct marketed food products, the share of total agricultural sales for direct marketedfood products, and the relative importance of direct marketing at regional and State levels. Regions weregrouped in the same categories used by AMS’s Marketing Services Division in its Farmers Market Surveyreports:Far West: Alaska, California, Hawaii, Nevada, Oregon, and WashingtonRocky Mountain: Arizona, Colorado, Idaho, New Mexico, Montana, Utah, and WyomingSouthwest: Arkansas, Louisiana, Oklahoma, and TexasNorth Central: Illinois, Indiana, Iowa, Kansas, Michigan, Minnesota, Missouri, Nebraska,North Dakota, Ohio, South Dakota, and WisconsinSoutheast: Alabama, Florida, Georgia, Kentucky, Mississippi, North Carolina, SouthCarolina, and TennesseeMid-Atlantic: Delaware, District of Columbia, Maryland, New Jersey, Pennsylvania,Virginia, and West VirginiaNortheast: Connecticut, Maine, Massachusetts, New Hampshire, New York, RhodeIsland, and VermontCharts 1 through 6 compare direct-to-consumer sales across censuses or with total agricultural sales asrecorded in the censuses. Chart 7 takes a slightly different approach to calculating direct-to-consumer salesas a share of the food system. The total agricultural sales figures are modified to reflect the exclusion ofcrops and agricultural practices not falling under NASS’s definition of direct-to-consumer marketing.1
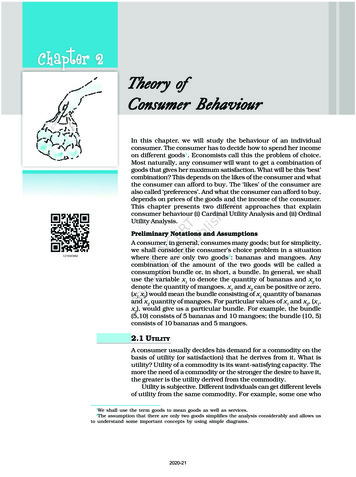
Key Findings The value of direct-to-consumer food marketing in all regions increased during the last decade(Chart 1).Chart 1: Value of Direct-to-Consumer Food Marketing* by Region, 1997-2007* Direct marketing is defined as agricultural products sold directly to individuals for human consumption in the U.S. Census of Agriculture, 2007.Source: Compiled by USDA Agricultural Marketing Service from 2007 Census of Agriculture data2
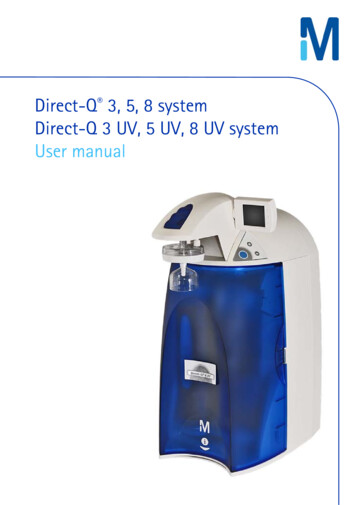
Over the past decade, the growth of direct-to-consumer food marketing across all regions farexceeded the growth of total agricultural sales. From 1997-2007 direct-to-consumer foodmarketing grew by 104.7 percent in the United States, while total agricultural sales increased byonly 47.6 percent (Chart 2).Chart 2: Growth of Direct-to-Consumer Food Marketing by Region, 1997-2007Source: Compiled by USDA Agricultural Marketing Service from 2007 Census of Agriculture data3
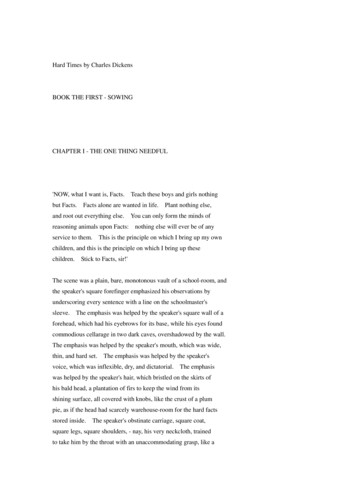
The role of direct-to-consumer food marketing in the agricultural sector is most prominent in NewEngland. All six New England States are on the list of top ten States in direct-to-consumer foodmarketing as a share of total agricultural sales (Chart 3).Chart 3: Top 10 States, Direct-to-Consumer Food Marketing as Share ofTotal Agricultural Sales, 2007Source: Compiled by USDA Agricultural Marketing Service from 2007 Census of Agriculture data4
Since 1997, nine States have consistently appeared as one of the top ten States in terms ofoverall direct marketing sales volume. However, there have been some shifts in market shareamong these States, with Texas, Wisconsin, and Massachusetts moving down in ranking whileWashington and New York moved up from 1997-2007 (Chart 4).Chart 4a: 2007 Direct-to-Consumer Food Marketing SalesChart 4b: 2002 Direct-to-ConsumerFood Marketing SalesChart 4c: 1997 Direct-to-ConsumerFood Marketing SalesSource: Compiled by USDA Agricultural Marketing Service from 2007 Census of Agriculture data5
The average rate of growth for direct marketing in the ten fastest growing States is more thanfour times greater than for total agricultural sales. In these States direct marketing grew byan average of 220 percent, compared to an average growth rate of only 53.2 percent for totalagricultural sales (Chart 5).Chart 5: Top 10 States, Growth of Direct-to-Consumer Food Marketing, 1997-200711Comparison for Alaska is for the period 2002-2007Selected States had the highest growth in direct marketing sales over the last decadeSource: Compiled by USDA Agricultural Marketing Service from 2007 Census of Agriculture data6
Farms with more than 50,000 in direct-to-consumer sales accounted for only 2.8 percent of thetotal number of farms who sold directly to consumers, but they captured 58.1 percent of all directto-consumer farm sales. Farms with annual direct-to-consumer sales below 5,000 captured 11.7percent of the direct marketing sales while representing 77.4 percent of farmers engaged in directmarketing (Charts 6a and 6b).Chart 6a: Farms Participating in Direct-to-Consumer Food Marketing, 2007Chart 6b: Value of Direct-to-Consumer Food Marketing Sales, 2007Source: Compiled by USDA Agricultural Marketing Service from 2007 Census of Agriculture data7
Reassessing Direct Marketing’s Share of the Food SystemIt is critical to understand the changing role of direct marketing within the larger food system. This canbe done superficially by dividing sales of direct marketed agricultural goods by total agricultural sales,nationally, in each State, and regionally. However, this measure is inadequate for capturing the trueimportance of direct marketing in the food system. Unlike the total value of agricultural sales figuresreported in the Census—which includes all agricultural commodities sold through all channels—the directto-consumer data covers only sales of edible farm products for human consumption. To compensate forthis limitation, the Marketing Services Division has developed a statistic that adjusts total agricultural salesby eliminating non-food crops and those that are not normally marketed directly to consumers: oilseedand grain farming, nursery and floriculture, other crop farming, cattle feedlots, poultry hatcheries, andhorse and other equine products. Nationally, direct-to-consumer food marketing would appear to be at least twice as significant tothe food system as non-adjusted total agricultural sales data would indicate. Regionally, directmarketing is undervalued by a factor ranging from 0.3 to 3.5. The greatest underestimation(3.5) of direct-to-consumer food marketing occurs in the North Central region, where bulkcommodities (such as corn, soybeans, and wheat) are dominant and make up a large share of theregion’s total agricultural sales (Chart 7).Chart 7: Direct-to-Consumer Food Marketing Sales by Region as a Share of TotalAgricultural Sales* Adjusted total agricultural sales means that the following product categories have been deleted from the total figure: oilseed and grain farming,nursery and floriculture, other crop farming, cattle feedlots, poultry hatcheries, and horse and other equine products.Source: Compiled by USDA Agricultural Marketing Service from 2007 Census of Agriculture data8
Charts 1 through 6 compare direct-to-consumer sales across censuses or with total agricultural sales as recorded in the censuses. Chart 7 takes a slightly diff erent approach to calculating direct-to-consumer sales as a share of the food system. The total agricultural sales fi gures are modifi ed to refl ect the exclusion of