Transcription
Scientia Iranica E (2019) 26(5), 2971{2987Sharif University of TechnologyScientia IranicaTransactions E: Industrial Engineeringhttp://scientiairanica.sharif.eduRobust parameter design of supply chain inventorypolicy considering the uncertainty of demand and leadtimeL.N. Tanga , Y.Z. Maa , J.J. Wanga,* , L.H. Ouyangb , and J.H. Byunca. School of Economics and Management, Nanjing University of Science and Technology, Nanjing, Jiangsu 210094, China.b. College of Economics and Management, Nanjing University of Aeronautics and Astronautics, Nanjing, Jiangsu, 211106, China.c. Department of Industrial and System Engineering, Gyeongsang National University, 501 Jinju-daero, Jinju, 660-701, Korea.Received 9 October 2017; received in revised form 8 March 2018; accepted 14 May 2018KEYWORDSSupply chain;Inventory policy;Simulation;Taguchi method;Response surfacemethodology.Abstract. The uncertainty of demand and lead time in inventory management has posedchallenges for the supply chain management. The purpose of this paper is to optimizethe total pro t and customer service level of supply chain by robust parameter design ofinventory policies. This paper proposes system dynamics simulation, Taguchi method, andResponse Surface Methodology (RSM) to model a multi-echelon supply chain. Based onthe sequential experiment principle, Taguchi method combining location with dispersionmodeling method is adopted to locate the optimum area quickly, which is very e cient tooptimize the responses at discrete levels of parameters. Then, fractional factorial designand full factorial design are used to recognize signi cant factors. Finally, RSM is usedto nd the optimal combinations of factors for pro t maximization and customer servicelevel maximization at continuous levels of parameters. Furthermore, a discussion of multiresponse optimization is addressed with di erent weights of each response. Con rmationexperiment results showed the e ectiveness of the proposed method. 2019 Sharif University of Technology. All rights reserved.1. Introduction1.1. Supply chain simulationDuring the last few decades, supply chain analysishas become a major concern both in manufacturingtheory and in industrial practice. In the extendedsense, which is now prevailing in the literature, asupply chain is associated with all the enterprises thatcontribute to the production and sales of products(goods or services). Several performance indices havebeen proposed to evaluate the quality of a supply chain,*. Corresponding author.E-mail address: jjwang@njust.edu.cn (J.J. Wang)doi: 10.24200/sci.2018.5205.1217particularly in terms of costs and value, decisionalintegration, agility, reactivity, and reliability [1].Using computer simulation to study the supplychain optimization problems has become a new trendin recent years. Many scholars use computer simulationto obtain reliable data for the analysis of a supplychain model. Simulation is used to model a systemor a process, giving support to decision-making thatenables the reduction of risks and costs involved in aprocess; it becomes a tool for a process optimization.It is also important to model the interaction among thevarious participants precisely. Both the planning andperformance of activities should be considered. To bespeci c, the typical activities include the managementof stock as well as production and delivery of nalproducts. The performance of each participant of the
2972L.N. Tang et al./Scientia Iranica, Transactions E: Industrial Engineering 26 (2019) 2971{2987supply chain has impact on the performance of all otherparticipants. Hence, the importance of coordinatingthe actions of various participants of the supply chainshould be taken into account [2,3].Simulation, speci cally discrete event simulation,is an important tool in the analysis and evaluation ofa supply chain. A two-echelon supply chain modelis adopted widely to study the inventory control andnetwork design of the supply chain [4-6]. The multiechelon supply chain model (including factory, wholesaler, distributor, and retailer) is studied to furtherinvestigate the design problems in a complex supplychain network [2,3,7-14]. One popular and classicmulti-echelon supply chain model is known as \BeerGame" [15]. Shang et al. [16] selected Arena as theirworking simulation environment to model a three-stagesupply chain with four retailers, one manufacturer, andthree suppliers. Shi et al. [17] also used Arena softwareto support the process-centric modeling paradigm forthe 3PL-MRCD supply chain. Other variant versions ofBeer Game models have been widely used in researchesof supply chain management and optimization [8,9,11].Thus, Arena is selected as the simulation environment for the supply chain simulation model in thispaper.1.2. Robust parameter designRobust Parameter Design (RPD) is an engineeringmethodology intended as a cost-e ective approachto the improvement of the quality of products andprocesses. In the basic assumptions, both controllablefactors (control variables) and uncontrollable/di cultto-control factors (noise variables) are involved inthe quality characteristic of a process. The goalof parameter design is to optimize a de ned qualitycharacteristic by choosing the settings of the controlvariables, while minimizing the variation imposed onthe process via the noise variables. Parameter designwas popularized in the mid-1980s by Japanese qualityconsultant Genichi Taguchi. A panel discussion editedby Nair summarized important responses to Taguchi'sideas and methodology [18]. In the last decade, therehave been many applications and new developments inthis important area [19].Design Of Experiment (DOE) [20] has beenwidely used in the robust parameter design. By selecting the combination levels of the controllable factors toreduce the system sensitivity to noise changes, robustparameter design achieves the objective of reducingthe system performance variations. Through a scienti c design of experiments, the signi cant factorsthat in uence the system quality characteristics canbe identi ed. After that, the optimal system outputscan be achieved accordingly so as to optimize theparameter combination design. Box and Wilson [21]rst used Response Surface Methodology (RSM) andMyers and Montgomery [22] extended RSM to robustoptimization of real (non-simulated) systems. Taguchimethod and response surface method [12,14,17,23,24]have been widely adopted in the robust parameterdesign problems.1.3. Rationale of the researchHussain et al. [13] used system dynamics simulationand Taguchi method to quantify the impact of a supplychain's design parameters. According to the Taguchimethod, levels of each factor systematically vary acrossa range of values, and all possible combinations offactor levels (parameter values) are considered, whilenot every combination has to be tested. Plentyof researches [16,23,25-27] have also applied Taguchimethod and Response Surface Methodology (RSM)successfully in the optimization of the supply chainmodel.The optimization problem of simulated systemshas been tackled by many methods; however, mostmethods assume known environments. However, thispaper adopts a robust parameter design methodologyfor uncertain environments; the uncertainty mainlycomes from demand and lead time. The Beer Gamemodel illustrated in the research of Kumer et al. [15]has the primary inputs and outputs for the Beer Gamemodel. The primary decision or control variables forthe Beer Game are the reorder points and reorder quantities. The basic Beer Game simulation only modelsa single unit at each level in the supply chain, whilethis paper uses the expanded model that incorporatesmultiple units at each supply chain level to studythe performance of multiple enterprises in the multiechelon supply chain.This paper uses the Arena simulation software [28]to build Beer Game model for the analysis and optimization of supply chain system. Arena @Rockwellsoftware provides a modular object-oriented development environment. It has a powerful user interface forintegration with popular software tools (such as Excel,Visio, VBA, OptQuest, and Crystal Reports). A linkto the working Arena simulation model is providedright here: http://factory.engr.stthomas.edu/simulation. To establish the model, a demonstration copyof Arena software (version 8.0 or later) is required.The classic Beer Game demonstrates intrinsiccapabilities of a simulation tool to facilitate integrationof a supply chain with steady-state random demands,inventory management, and lead times encapsulatedin the time tested Beer Game. It represents a modelthat can be scaled up to a larger network of suppliers,Original Equipment Manufacturers (OEMs), etc. withmultiple products and other features that replicatecomplexities in an industry supply chain. In thismodel, it tracks all inventory levels and their associatedcosts. Various management scenarios for the supply
L.N. Tang et al./Scientia Iranica, Transactions E: Industrial Engineering 26 (2019) 2971{2987chain management can be studied. The goal of theproposed simulation model is to maximize total pro tand Customer Service Level (CSL) of the supply chain.Taguchi method is adopted to nd the optimal settingsof the decision variables to maximize total pro t andcustomer service level, respectively. Based on theoptimization design of decision variables at discretelevels, response surface methodology is used to furtheroptimize the decision variables at continuous levels.The multi-response optimization results are studiedunder di erent decision scenarios.In recent years, many works of literature havefocused on the simulation optimization of a supplychain, where the simulation model of the consideredsupply chain problem is built; then, the samplingmethod (e.g., Latin Hypercube Sampling (LHS), MonteCarlo) and surrogate modeling method (e.g., RSM,kriging) or other Genetic Algorithms (GA) [7,9,11,27]are applied to analyze and model the simulation model.Other modeling methods include Neural Network (NN)[25], Particle Swarm Optimization (PSO) [27], Simulated Annealing Algorithm (SAA) [7], Hybrid RobustStochastic Programming (HRSP) [10], Ranking andSelection (R&S) [8], and Integer Linear Programming(ILP) [28]. Table 1 represents a comparative study fora better conclusion on the major work in the literature.The remainder of this paper is arranged as follows.In Section 2, the methodology proposed in this paperis introduced. A simulation model of the multi-echelonsupply chain is demonstrated in Section 3. In Section 4,Taguchi method is used to optimize the total pro tand customer service level, respectively. In Section 5,response surface methodology is adopted to explore theoptimal settings of inventory policies and reach multi-response optimization. Finally, the results of this paperare summarized in Section 6.2. MethodologyA supply chain should be understood as a set of all theorganizations comprising the material (component orproduct) supply, production, distribution, and sellingof goods to the nal customer. Managing a supplychain concerns activities that promote functional interactions, both within a single company and amongstdistinct ones.Methods for the supply chain management shouldbe able to simplify possible complexity in a supplychain by adopting a systematic view of the whole chain.Simulation is ideal for mapping these complex interactions and for predicting non-linear outputs through\What If" analysis. Running What if' simulations totest certain policies or strategies on complex modelscan greatly aid the understanding of how the systemchanges over time.This paper investigates the impact of inventorypolicy on the performance of a supply chain in a modelof the four-echelon supply chain, which su ers fromuncertainties in demand and lead time. One of themost commonly applied methodologies to study variousaspects of the Beer Game model is the control theoretictechnique. It is clear that these control-theoretic models are linear and cannot deal with non-linearities, suchas constraints of inventory policies at di erent levelsof supply chain. Robust Parameter Design (RPD) isan innovative statistical/engineering approach to o line quality and productivity improvement. The mainidea of RPD is to make a process or product less sen-Table 1. Summarized comparisons of some major works on simulation optimization.Multiple RobustLiteratureSystem typeModeling methodresponses optimizationShang et al. [16]Kumar et al. [15]Shukla et al. [23]Yang et al. [14]Hussain et al. [13]Li and Liao [25]Shi et al. [12]4-tier supply chain4-tier supply chain3-tier supply chainMulti-structure supply chain4-tier supply chainBlood supply chainCross dockingChu et al. [11]3-tier distribution chainSoleimani and Kanaan [27]Rooeinfar et al. [7]Ye and You [9]Keyvanshokooh et al. [10]Tsai and Chen [8]Osorio et al. [28]This paperClosed loop supply chain networkSupply chain network3-tier supply chainClosed loop supply chain network3-tier supply chainBlood supply chain4-tier multi-unit supply chain2973******************Taguchi, RSMOptQuestTaguchi, Psychoclonal algorithmTaguchi, MCDMTaguchiTaguchi, NN, GALHS, RSMMonte Carlo,Cutting-plane algorithm, RSMGA, PSOGA, SAAKrigingHRSPR&SILPTaguchi, RSM
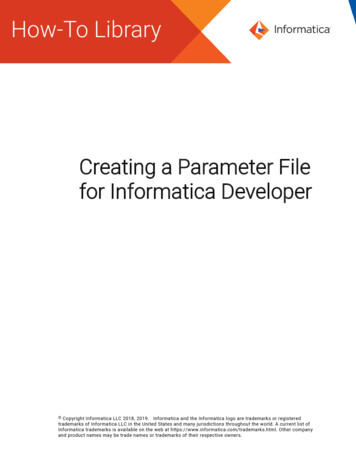
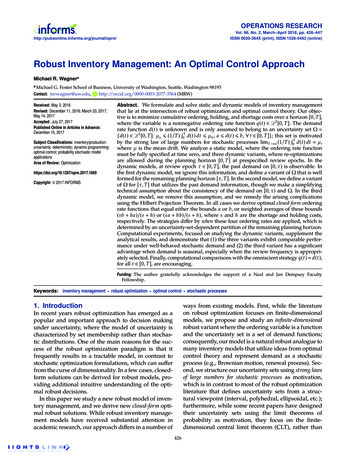
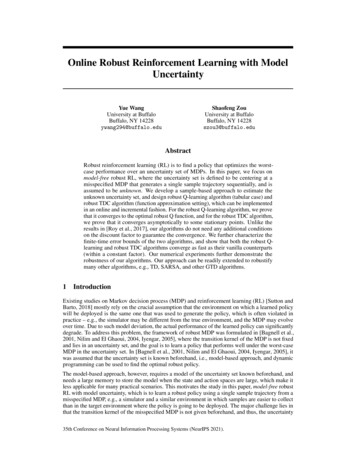
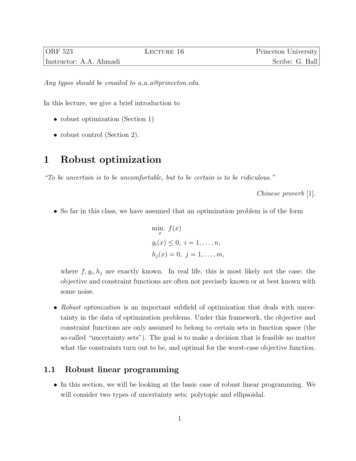
2974L.N. Tang et al./Scientia Iranica, Transactions E: Industrial Engineering 26 (2019) 2971{2987sitive to noise variation through statistically designedexperiment by using the non-linearities between inputvariable and output responses.Compared with the embedded optimization algorithm [15] in the simulation model, the RPD providesa more strategic way to select the experiment pointsneeded to analyze in order to determine the optimalsetting of parameters. This adds more advantagesto the RPD method proposed in this paper overother embedded optimization algorithms through itsstatistical way of experiment design, which makes theproposed methodology in this paper more e cient.Taguchi method and response surface methodology are two popular RPD approaches. Taguchi methodis used to analyze quantitatively the performance of thesupply chain with respect to the supply chain's designparameters (control factors). An optimal combinationof control factors derived from the optimal supply chainperformance can be obtained. However, the selectionof optimal setting of factors is limited to the designedlevels of their experiment, which are in discrete forms,even though Taguchi method is very e ective in ndingan appropriate experimental region of factors that canfacilitate the following fractional factorial design andRSM optimization.Response surface methodology is able to ndthe optimal combination of design parameters derivedfrom the optimal supply chain performance at theircontinuous levels. According to the sequential principlein the experiment design, a fractional factorial designis rst adopted to identify the signi cant factors thathave signi cant impact on the output responses. Then,full factorial design with centre points is used to checkthe presence of the curvature (second-order or higherorder e ect). If there is no curvature in the experimentregion, the steepest descent/ascent method is usuallyapplied to further search for the optimum experimentregion. When a signi cant curvature is recognized,axial points are added to the experiment design matrixin order to analyze the non-linear relations betweenresponses and variables. Finally, the optimal combination of parameters can be obtained to achieve theoptimal responses.The overall framework of the methodology proposed in this paper is presented in Figure 1.3. Multi-echelon supply chain modelIn order to study the impact of inventory policy onthe performance of the supply chain, a four-echelonsupply chain is selected to model the ordering andstocking situation of the supply chain, involving onefactory, two wholesalers, four distributors, and eightretailers. The classic simulation case of Beer Gameis very popular in the research of supply chain simulation and optimization. The Beer Game simulationFigure 1. The overall framework of the proposedmethodology.Figure 2. Supply chain structure.model was originally developed in the 1960s at theMassachusetts Institute of Technology's (MIT) SloanSchool of Management. Beer Game is a role-play gameto demonstrate the decision-making of supply chainmanagers. In this paper, a variant of the popularBeer Game is adopted, where each upstream supplierhas two downstream customer companies (shown inFigure 2).Beer Game uses Arena simulation software tomodel the speci c structure of the proposed supplychain model, which re ects the transmission of information ows and material ows in the supply chain.Arena software has a very helpful tool Process Analyzer to study the speci ed responses under di erentcombinations of control variables, which can derive the
L.N. Tang et al./Scientia Iranica, Transactions E: Industrial Engineering 26 (2019) 2971{2987experimental data for the robust parameter design inthe following study.3.1. Simulation logic of Beer GameThe four-echelon supply chain structure is shown inFigure 2. In the proposed supply chain model, order information transmits from customers to retailers.Then, retailers order up to ful ll their inventory fromupstream companies. Distributors and wholesalers alsoorder up to ful ll their inventory from upstream. Afterreceiving orders from wholesalers, the factory sets upits production line. In the meanwhile, products aretransferred from the factory to downstream and, nally,to customers. The transmission of information ows(Orders) and material ows (Products) in the supplychain is shown in Figure 3.The simulation system of the supply chain illustrated in Figure 4 shows the primary inputs andoutputs in the Beer Game model. The primary decisionFigure 3. Information ow and material ow.Figure 4. Supply chain simulation system.2975variables in this model are the reorder points andreorder quantities. In the simulation model, there aretwo sources of random variations: customer demandand lead time. The Beer Game supply chain is designedto deliver kegs of beer to retail customers. Thesesales generate revenue when o set by holding costof inventory and shortage penalty costs, providing ameasure of the potential system pro tability. Bothmaterial and information ows are subject to delays.Customer demand arises at the retail store only. It isassumed that customer demands in di erent periods(days) are independent, and identically distributedrandom variables follow a Poisson distribution.In the proposed model, a xed quantity orderingsystem is adopted as the inventory policy, which is alsoknown as Q model. That is, each enterprise has axed reorder point and a xed reorder quantity. TheBeer Game model tracks all inventory levels and theirassociated costs. The goal of the Beer Game simulationmodel is to maximize the total net pro t and customerservice level of the supply chain.The order processing logic of the retailer is shownin Figure 5. Other companies including distributors,wholesalers, and the factories share a similar orderprocessing logic with retailers. Particularly, when thefactories check the inventory level and nd out thatthe inventory level reaches the reorder point, they willnot place an order from upstream. Instead, they setup production lines so that they can maintain theinventory level at a reasonable position.At each level of the supply chain, companies mustsatisfy orders from their downstream participants (orcustomers) as much as possible. In the case of a stockout, the excess demand is backlogged. A penalty cost isassessed for backorders at each level of the supply chainre ecting the need to provide good customer servicethroughout the supply chain. In particular, un lleddemand at the retail level may either be backlogged forFigure 5. Simulation logic of retailers.
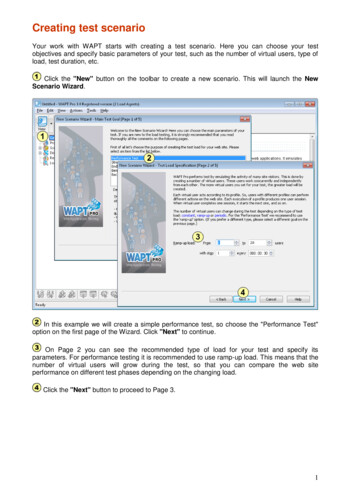
2976L.N. Tang et al./Scientia Iranica, Transactions E: Industrial Engineering 26 (2019) 2971{2987later delivery or immediately lost. Thus, the unful lledretail demand is subject to either penalty cost or lostsale cost.The Arena Beer Game simulation model tracksinventories and the number of orders at each level ofthe supply chain. D is the index for day of the month;L is the index for supply chain level, where:L 1 fretailerg ; 2 fwholesalerg ; 3 fdistributorg ;4 ffactoryg :The model tracks three inventory measures: Inventory onhand (L): It represents the number ofunits physically in stock;Inventory onorder (L): It represents the number ofunits that have been ordered, yet have not beenreceived;Backorder (L): It represents the total amount ofdemand yet to be satis ed.These inventory measures can be combined tocalculate the net inventory position using the followingformulation:Inventory position (L) Inventory onhand (L) Inventory onorder (L) Backorder (L) :The Arena Beer Game simulation model tracks supplychain costs and pro ts on a daily basis for the foursupply chain levels. The cost and pro t parametersare shown in Table 2.The daily operating cost is calculated for eachlevel by:Cost (D; L) Order cost (L) f0; if no order placed; otherwise 1g Holding cost (L) Inventory onhand (L) Penalty cost (L) Backorder (L) Lost sale cost Lost sales; ifL 1; Otherwise 0g:The daily pro t is calculated for each level by:Pro t (D; L) Unit pro t (L) Units sold (L)Cost (D; L) :3.2. Parameters setting and run of thesimulation modelThis study aims to investigate the system behavior overthe product's production and distribution processes. Inthe proposed model, a warm-up period of 30 days is setbefore the simulation model starts to run so as to have asteady running system. The termination time is set as720 days, namely two years (assuming that each monthhas 30 days for simpli cation).In order to have convergence running results, wehave made 30 replications of the system to obtain agood point estimator. The simulation is run by acomputer equipped with Intel Core i5, 3.30 GHzCPU, and 4 GB RAM. The entire run of this simulationmodel takes about 7 minutes.Once we have built a working model, it is timeto verify and validate the model. Veri cation is thetask of ensuring that the model behaves as intended;more colloquially, it is known as debugging the model.Validation is the task of ensuring that the modelbehaves the same as the real system [26].The veri cation of the simulation model is tocheck whether the processing path of orders and products is consistent with the distribution and sale processin the supply chain. Usually, the animation of thesimulation model is checked for the veri cation of thesimulation model. The animation of the simulationmodel (shown in Figure 6) shows that the processingpath of orders is consistent with the distributionprocedures in the designed supply chain structure.To validate a simulation mode, the results ofour model should be compared with those of the realsystem. The Beer Game is a representation of aproduction-distribution system at four levels, which isa simpli ed version of the supply chain system. The accurate records on the actual system do not exist; then,concentrating on the veri cation and using the bestjudgment of experts become an e ective and e cientalternative to validate the model [26]. Therefore, thevalidation analysis for the Beer Game simulation modelis to verify the correctness of simulation outputs [29].Table 2. The setting of cost and pro t parameters.Retailer Wholesaler Distributor FactoryOrder cost: /orderHolding cost: /unit dayPenalty cost: /unit dayUnit pro t: /unitLost sale cost: .1613.25{
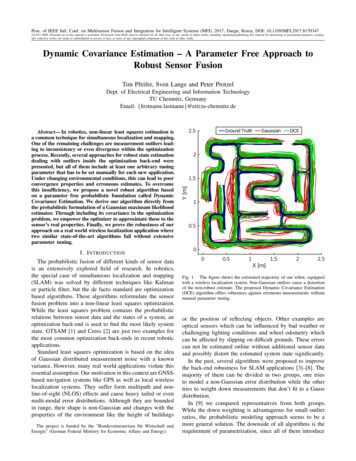
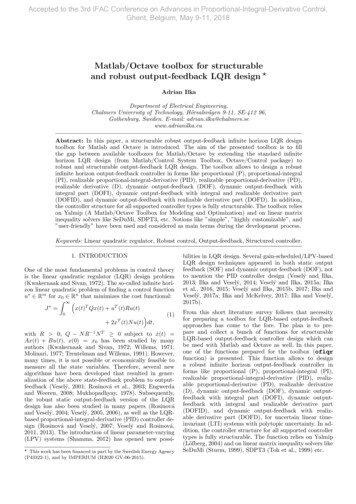
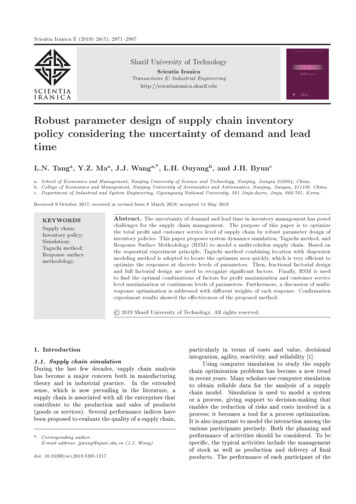
L.N. Tang et al./Scientia Iranica, Transactions E: Industrial Engineering 26 (2019) 2971{29872977Figure 6. The animation of Beer Game simulation model.Figure 7. The crystal reports of time persistent statistics.The Arena Beer Game simulation model providesa wide variety of the simulation results reports availablevia the Crystal Reports database incorporated intoArena. Figure 7 shows the time-persistent statisticsof the Crystal Reports for a complete 24-month simulation run. Arena time-persistent statistics track everychange in the reported inventory changes over 30 replicates. The half width means a 95% con dence-intervalhalf width, which is determined by the sample standarddeviation and replication times. The expression of halfwidth is as follows:sHalf width tn 1;1 2 p ;(1)nwhere n represents the replication times, s is the samplestandard deviation. To some extent, half width issimilar to the sample standard deviation. Consider theon-hand stock as an example: The half widths of aretailer, a wholesaler, a distributor, and a factory are1.26, 2.06, 3.86, and 3.25, respectively. It is obviousthat the variation of on-hand stock shows an increasingtrend from downstream to upstream of the supplychain, which is a vivid demonstration of bullwhip e ectin the multi-echelon supply chain. Thus, we believethat the simulation model is able to capture the keyfeatures and relationships in a supply chain system.Therefore, the simulation model is con rmed to be ableto represent a real supply chain system.The simulation model of Beer Game starts fromretailers receiving orders from the market. Companiesfrom four echelons of the supply chain are involved inthis model. In the simulation system, two sources ofuncertainty are considered, that is, customer demandand lead time. To be speci c, customer demand can bedivided into two parts: xed demand and uctuateddemand. In terms of the xed demand, daily demandequals 25. That is, each retailer receives an order of25 products every day. The uctuated demand standsfor the random uctuations of the daily demand, whichfollows a Poisson distribution in this model, as shownin Figure 8.Another source of uncertainty comes from leadtime, which can be divided into two parts: ordertime and delivery time. Order time refers to the timebetween the upstream enterprise sending the orderand the downstream enterprise receiving the orderinformation. Delivery time refers to the time betweenthe downstream enterprise making delivery and theupstream enterprise receiving the delivered products.To be speci c, delivery time can also be divided into
2978L.N. Tang et al./Scientia Iranica, Transactions E: Industrial Engineering 26 (2019) 2971{2987Table 4, where the initial stock of the retailer is set as100 units, the reorder point is 100 units, the reorderquantity is 100 units, and the lead time is set as 4 dayswith no variations.In this paper, the initial setting of inventoryparameters is decided according to the Economic OrderQuantity (EOQ) of retailers, wholesalers, distributors,and factory, which can be calculated according toEq. (2):EOQ(L) Figure 8. Daily demand.ptwo parts: xed delivery time and uctuated deliverytime. The uctuated delivery time follows a Poissondistribution. Table 3 shows the setting of lead time inthis study.The simulation model tracks the inventory positions and orders of all the companies in the supplychain. The decision parameters of inventory policiesare the reorder points and the reorder quantities, whichare determined by the following robust parameterdesign and optimization in Sections 4 and 5. Anexample of the retailer inventory analysis is shown inLead timeFixed order timePoisson order timeFixed ship timePoisson ship timeTotal lead time2 Demand(L) Order cost(L) Holding cost(L):The cost data presented in Table 2 can be used tocalculate the EOQ(L). The EOQ for each level ofthe supply chain is shown in Table 5. Accordingto the EOQ for each level of the supply chain, theinitial values of reorder quantities for each level in thesimulation model are determined [15].The simulation model can be used to analyze thesupply chain performance under di erent settings ofdecision variables by means of process analyzer, whichTable 3. The setting of lead time.Retailer Wholesaler Distributor Factory0020.54.52020.54.52020.54.52010.51.5Table 4. An example of inventory analysis for the retailer.Day Demand Inventory on Products on Backorders Inventory Products Products Productshandorderposition ordered 1148817014712298100100100100100Table 5. The EOQ for each level of the supply chain.Order quantitiesRetailer Wholesaler Distributor FactoryEOQInitial values of reorder 5242218
L.N. Tang et al./Scientia Iranica, Transactions E: Industrial Engineering 26 (2019) 2971{2987is a built-in tool in Arena. The process analyzeris able to show the system performance under manyscenarios. In di erent scenarios, the settings of simulation parameters are di erent. In addition, the processanalyzer helps us evaluate the experiment results ina statistically valid way in the shortest amount oftime. As described in Section 3.2, the entire simulationrun takes about 7 minutes, while a scenario run inthe process analyzer only takes about 11 seconds.Therefore, the process analyzer helps us implementall experiment runs quickly rather than running thesimulation model under di erent combinations of thedesign parameters separately.The objective of the supply chain model is tomaximize the total pro t and customer service level.To be speci c, the total pro t refers to the sum ofnet pro ts of the whole supply chain over a twoyear operation, re ecting the e ciency of supply chainthrough pro tability. The customer service level refersto the product ll rate of retailers over the supplychain, which re ects the e ectiveness of the supplychain through customer satisfaction. Therefore, themaximization of pro t and customer service level canavoid the potential non-achievement of corporate goalsdue to the ine ective or ine cient supply chain process.4. Robust parameter design using TaguchimethodRobust Parameter Design (RPD) is a quality improvement technology put forward by Taguchi, which hasbeen widely applied to the optimization design ofproducts and proce
Simulation, speci cally discrete event simulation, is an important tool in the analysis and evaluation of a supply chain. A two-echelon supply chain model is adopted widely to study the inventory control and network design of the supply chain [4-6]. The multi-echelon supply chain model (including factory, whole-