Transcription
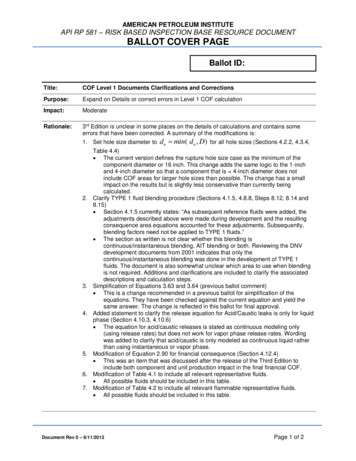
AMERICAN PETROLEUM INSTITUTEAPI RP 581 – RISK BASED INSPECTION BASE RESOURCE DOCUMENTBALLOT COVER PAGEBallot ID:Title:COF Level 1 Documents Clarifications and CorrectionsPurpose:Expand on Details or correct errors in Level 1 COF calculationImpact:ModerateRationale:3rd Edition is unclear in some places on the details of calculations and contains someerrors that have been corrected. A summary of the modifications is:1. Set hole size diameter to2.3.4.5.6.7.dn min( dn , D)for all hole sizes (Sections 4.2.2, 4.3.4,Table 4.4) The current version defines the rupture hole size case as the minimum of thecomponent diameter or 16 inch. This change adds the same logic to the 1-inchand 4-inch diameter so that a component that is 4-inch diameter does notinclude COF areas for larger hole sizes than possible. The change has a smallimpact on the results but is slightly less conservative than currently beingcalculated.Clarify TYPE 1 fluid blending procedure (Sections 4.1.5, 4.8.8, Steps 8.12, 8.14 and8.15) Section 4.1.5 currently states: “As subsequent reference fluids were added, theadjustments described above were made during development and the resultingconsequence area equations accounted for these adjustments. Subsequently,blending factors need not be applied to TYPE 1 fluids.” The section as written is not clear whether this blending iscontinuous/instantaneous blending, AIT blending or both. Reviewing the DNVdevelopment documents from 2001 indicates that only thecontinuous/instantaneous blending was done in the development of TYPE 1fluids. The document is also somewhat unclear which area to use when blendingis not required. Additions and clarifications are included to clarify the associateddescriptions and calculation steps.Simplification of Equations 3.63 and 3.64 (previous ballot comment) This is a change recommended in a previous ballot for simplification of theequations. They have been checked against the current equation and yield thesame answer. The change is reflected in this ballot for final approval.Added statement to clarify the release equation for Acid/Caustic leaks is only for liquidphase (Section 4.10.3, 4.10.6) The equation for acid/caustic releases is stated as continuous modeling only(using release rates) but does not work for vapor phase release rates. Wordingwas added to clarify that acid/caustic is only modeled as continuous liquid ratherthan using instantaneous or vapor phase.Modification of Equation 2.90 for financial consequence (Section 4.12.4) This was an item that was discussed after the release of the Third Edition toinclude both component and unit production impact in the final financial COF.Modification of Table 4.1 to include all relevant representative fluids. All possible fluids should be included in this table.Modification of Table 4.2 to include all relevant flammable representative fluids. All possible fluids should be included in this table.Document Rev 0 – 6/11/2012Page 1 of 2
AMERICAN PETROLEUM INSTITUTEAPI RP 581 – RISK BASED INSPECTION BASE RESOURCE DOCUMENTBALLOT COVER PAGE8. Correction in Table 4.8 for liquid release b factors. Some TYPE 1 fluid b factors are recorded as 1 in the Table that should be 0.Unrealistic areas result when 1 is used and 0 provides a more reasonable result.The DNV reports from 2001 were reviewed to determine the corrected factors.9. Modification of Tables 4.8 and 4.9 for relevant representative fluids in Tables 4.1 and4.2. All possible fluids should be included in this table to get the desired flammableCOF areas or a nonflammable result, if applicable.10. Correction of HF instantaneous release constant in Table 4.11. The current value of 3,300 yields unrealistic results. The corrected value of 0.33yields a more realistic and correct COF area result.Note: Please indicate specific change listed above as the reason for your negativeballot, if not voting affirmative or abstain.TechnicalAPI RP 581 Part 3Reference(s):PrimarySponsor:Name:Company:Lynne KaleyTrinity Bridge, comCosponsors: Name/Company:Name/Company:Tracking StatusSubmitted to Task GroupDateResolutionSubmitted to SCIDateResolutionSubmitted to Master EditorDateAddedProposed Changes and/or Wording {attach additional documentation after this point}The following describes the iterations of how this final proposal evolved to the final recommendations.Document Rev 0 – 6/11/2012Page 2 of 2
API RP 581 PART 3CONSEQUENCE OF FAILURE METHODOLOGY
8API RECOMMENDED PRACTICE 5814Consequence of Failure – Level 14.1Determine the Representative Fluid and Associated Properties4.1.1Representative FluidsIn the Level 1 consequence analysis, a representative fluid that most closely matches the fluid contained in thepressurized system being evaluated is selected from the representative fluids shown in Table 4.1. Because veryfew refinery and chemical plant streams are pure materials, the selection of a representative fluid almost alwaysinvolves making some assumptions. Annex 3.A provides guidance on selecting a representative fluid when anobvious match in Table 4.1 cannot be found or when the fluid is a mixture with or without toxic components.4.1.2Fluid PropertiesThe required fluid properties estimated for each of the representative fluids as provided in Table 4.2 aredependent on the stored phase of the fluid below:a)Stored Liquid1) Normal Boiling Point, NBP2) Density, l3) Auto-Ignition Temperature, AITb) Stored Vapor or Gas1) Normal Boiling Point, NBP2) Molecular Weight, MW3) Ideal Gas Specific Heat Capacity Ratio, k4) Constant Pressure Specific Heat, C p5) Auto-Ignition Temperature, AITThe properties of fluids (or individual components of mixtures) typically can be found in standard chemicalreference books. The normal boiling point is used in determining the phase of the material following the releaseto atmosphere, and either the molecular weight or density is used in determining the release rate, depending onwhether a liquid or gas, respectively, is released.4.1.3Choice of Representative Fluids for Acids and Caustic FluidsThe appropriate choice of reference fluid for acids and caustics is ACID. ACID should be chosen whenever thefluid is non-flammable and non-toxic but would still present a hazard to personnel that may come in contact withthe release. ACID is modeled as a liquid spray, see Section 4.10.3.4.1.4Estimation of Ideal Gas Specific Heat Capacity RatioIf the value of the ideal gas specific heat capacity ratio is unknown, an estimate can be made provided a valueof the constant pressure specific heat capacity, C p , is available, using Equation (3.1).k CpCp R(3.1)The constant specific heat capacity, C p , may be evaluated using the equations provided in Table 4.2.
RISK-BASED INSPECTION METHODOLOGY, PART 3—CONSEQUENCE OF FAILURE METHODOLOGY4.1.59Flammable Fluid TypesIn the initial development of the Level 1 methodology, the results of the consequence analysis were correlatedwith equations and presented in lookup tables. As the consequence area results were reviewed, it became clearthat adjustments had to be made to smooth out the results at the instantaneous to continuous release transitionand as the operating temperature approached the auto-ignition for each fluid (see Sections 4.8.5 and 4.8.6).a) Type 0 Fluids – For the initial set of reference fluids, the consequence area equations were not smoothedand there remained step changes in the equations. Instead, adjustment factors and blending factors wereapplied to the consequence area equations. These initial fluids are designated here as TYPE 0 and can befound in Table 4.1.b) Type 1 Fluids – Instantaneous to continuous blending was performed during development of subsequentreference fluids As subsequent reference fluids were added, the adjustments described above were madeduring development and the resulting consequence area equations accounted for these adjustments.SubsequentlyAs a result, instantaneous to continuous blending factors need not be applied to TYPE 1fluids.4.1.6Release PhaseThe dispersion characteristics of a fluid and the probability of consequence outcomes (events) after release arestrongly dependent on the phase (i.e., gas, liquid, or two-phase) of the fluid after it is released into theenvironment. Most releases from pressurized units are two-phase releases, especially if the fluid is viscous orhas a tendency to foam. Released fluids operating under pressure above their boiling points will flash andproduce a two-phase release. Guidelines for determining the phase of the released fluid when using the Level 1consequence analysis are provided in Table 4.3, if more sophisticated methods are not available. Consultationwith process or operations personnel is appropriate in this determination. For STEAM, the release phase isgas/vapor. For the representative fluid, ACID, the release phase is always liquid (see Section 4.1.3).Where more rigorous calculations are desired in order to include the effect of two-phase flashing releases asdescribed in Section 5.3.4, a Level 2 consequence analysis should be performed.4.1.7 Calculation of Release Phasea) STEP 1.1 – Select a representative fluid group from Table 4.1.b) STEP 1.2 – Determine the stored fluid phase; liquid or vapor. If stored fluid is two-phase, use theconservative assumption of liquid. Alternatively, a Level 2 consequence analysis can be performed.c) STEP 1.3 – Determine the stored fluid properties.1) For a stored liquid: 2) l – Stored liquid density, kg/m3 (lb/ft3), can be estimated from Table 4.2AIT – Auto-ignition temperature, K ( R), can be estimated from Table 4.2 For a stored vapor: MW – Molecular weight, kg/kg-mol (lb/lb-mol), can be estimated from Table 4.2 k – Ideal gas specific heat ratio, can be estimated using Equation (3.1) and the CP values asdetermined using Table 4.2AIT – Auto-ignition temperature, K ( R), can be estimated from Table 4.2 d) STEP 1.4 – Determine the steady state phase of the fluid after release to the atmosphere, using Table 4.3and the phase of the fluid stored in the equipment as determined in STEP 1.2.4.24.2.1Release Hole Size SelectionGeneralA discrete set of release events or release hole sizes are used since it would be impractical to perform theconsequence analysis for a continuous spectrum of release hole sizes. Limiting the number of release holesizes allows for an analysis that is manageable, yet still reflects the range of possible outcomes.
10API RECOMMENDED PRACTICE 581The release hole sizes shown in Table 4.4 are based on the component type and geometry as described inAnnex 3.A. In addition, the release hole sizes are limited to a maximum diameter of 16 inch. This diameterrepresents a practical maximum value for a release calculation because catastrophic failures of componentsgenerally do not involve disintegration of the equipment item.4.2.2Calculation of Release Hole SizesThe following steps are repeated for each release hole size; typically four release hole sizes are evaluated.a)STEP 2.1 – Based on the component type and Table 4.4, determine the release hole size diameters, d n . IfD dn , dn D .b)STEP 2.2 – Determine the generic failure frequency, gff n , for thenthrelease hole size from Part 2, Table3.1, and the total generic failure frequency from this table or from Equation (3.2).4gfftotal gff n(3.2)n 14.34.3.1Release Rate CalculationOverviewRelease rates depend upon the physical properties of the material, the initial phase, the process operatingconditions, and the assigned release hole sizes. The correct release rate equation must be chosen, based onthe phase of the material when it is inside the equipment item and its discharge regime (sonic or subsonic), asthe material is released.The initial phase of the hazardous material is the phase of the stored fluid prior to coming into contact with theatmosphere (i.e., flashing and aerosolization is not included at this point). For two-phase systems (condensers,phase separators, evaporators, reboilers, etc.), some judgment as to the handling of the model needs to betaken into account. In most cases, choosing liquid as the initial state inside the equipment is more conservativeand may be preferred. One exception may be for two-phase piping systems. In this case, the upstream spillinventory should be considered so that if a majority of the upstream material can be released as vapor, then avapor phase should be modeled. The results should be checked accordingly for conservatism. Items containingtwo-phases should have a closely approximated potential spill inventoryto prevent overly conservative results.The release rate equations are provided in the following sections. The initial phase within the equipment can bedetermined using a fluid property solver which eliminates assumptions on the release rate calculations.4.3.2Liquid Release Rate CalculationDischarges of liquids through a sharp-edged orifice is discussed in the work by Crowl and Louvar [4] and maybe calculated using Equation (3.3).Wn Cd K v ,n l AnC12 gc Ps Patm l(3.3)In Equation (3.3), the discharge coefficient, Cd , for fully turbulent liquid flow from sharp-edged orifices is in therange of 0.60 Cd 0.65 . A value of Cd 0.61 is recommended [19]. Equation (3.3) is used for bothflashing and non-flashing liquids.The viscosity correction factor, K v , n , can be determined from Figure 4.1 or approximated using Equation (3.4),both of which have been reprinted from API Standard 520, Part 1 [1]. As a conservative assumption, a value of1.0 may be used.
RISK-BASED INSPECTION METHODOLOGY, PART 3—CONSEQUENCE OF FAILURE METHODOLOGYK v ,n4.3.3 2.878 342.75 0.9935 Ren 0.5 Ren1.5 11 1.0(3.4)Vapor Release Rate EquationsThere are two regimes for flow of gases or vapors through an orifice; sonic (or choked) for higher internalpressures, and subsonic flow for lower pressures (nominally, 103.4 kPa (15 psig) or less). Therefore, vaporrelease rates are c
API RP 581 – RISK BASED INSPECTION BASE RESOURCE DOCUMENT BALLOT COVER PAGE Document Rev 0 – 6/11/2012 Page 2 of 2 8. Correction in Table 4.8 for liquid release b factors. Some TYPE 1 fluid factors are recorded as 1 in the Table that should be 0. Unrealistic areas result when 1 is used and 0 provides a more reasonable result.
![API Ballot: [Ballot ID] – API 510 & API 570, Deferrals, Rev05](/img/5/api510andapi570deferralsrev5.jpg)
