Transcription
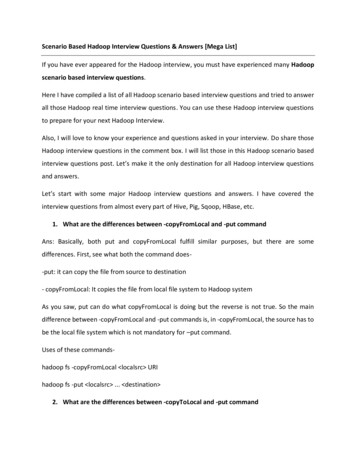
Creating test scenarioYour work with WAPT starts with creating a test scenario. Here you can choose your testobjectives and specify basic parameters of your test, such as the number of virtual users, type ofload, test duration, etc.Click the "New" button on the toolbar to create a new scenario. This will launch the NewScenario Wizard.In this example we will create a simple performance test, so choose the "Performance Test"option on the first page of the Wizard. Click "Next" to continue.On Page 2 you can see the recommended type of load for your test and specify itsparameters. For performance testing it is recommended to use ramp-up load. This means that thenumber of virtual users will grow during the test, so that you can compare the web siteperformance on different test phases depending on the changing load.Click the "Next" button to proceed to Page 3.1
Test duration and report optionsOn Page 3 you can choose test duration. You can either specify exact time for the test or setthe total number of virtual user sessions that should be executed before the test completion. Nowlet’s proceed to Page 4.Here you can specify the number of test phases for which you want to obtain performancedata. Each phase will be represented by a separate column in the report that will be created whenthe test is completed. The more columns you specify, the more detailed information you will see inthe report. Note, however that if you specify a big number, the report will take more time togenerate, so it is recommended to leave the default setting. In any case you will be able to get themost detailed information on graphs.The last page of the Wizard contains some important hints on how you should proceed withthe design of your test.Note that any options you choose in the Scenario Wizard can be changed later. To do this clickthe “Test Volume” page in the left view of the WAPT window.The most important part of the work is the creation of profiles that will define the behavior of thevirtual users. During the test each virtual user works according to its profile. One execution of theprofile creates one user session. As soon the user finishes a session, it starts a new one, and soon until the test is completed. So, each virtual user emulates multiple real users visiting the siteone after another.2
Creating a virtual user profileInitially profiles are recorded with help of a browser. You should simply perform step by step allthe actions of the user that you want to emulate. WAPT will record everything in form of HTTPrequests. During the test WAPT will execute a copy of the recorded session by sending the verysimilar sequence of requests. Actually, the requests will be the same with only few modificationsthat we will mention later.If you want to emulate different types of users in the same test, you can record several differentprofiles.Click the "Rec" button on the toolbar to open the "Recording Options" dialog. (When theScenario Wizard is finished, that dialog is displayed automatically.)We will create a new profile now, so you need to choose a name for it. If you already had apreviously recorded profile, you could select it and append the recorded requests to its end.It is recommended that you delete your Internet Explorer temporary files and cookies beforerecording. This is required to simulate a session from a "clean" system of a user who has nevervisited the site before. WAPT will do this automatically if you leave the corresponding optionschecked.You can either use the embedded Internet Explorer window for recording, or choose anexternal browser for this purpose. Embedded window is preferable in most cases, because itprovides more visibility and lets WAPT better organize the recorded requests. However if youexperience any problems using it (like JavaScript error messages appearing during recording),you can use an external browser instead.3
Recording a user sessionType the initial URL to the address bar and click the “Go” button (or press Enter). As younavigate through the web site inside the browser window, WAPT will record all your steps as asequence of HTTP requests.These requests will start appearing in the left view. Note that sometimes when you click a linkWAPT adds several requests while the page loads. This is a result of the execution of theJavaScript code contained on the page. It can initiate sending additional requests. They can evenappear when you work with the web interface controls.If you record using the embedded browser, WAPT will recognize such additional requests and willplace them as sub-requests making a tree. In case of external browser all requests will be alsorecorded, but on the same level.Note that additional requests to images, .js and .css files do not appear in the list. They arerecorded as “page elements”. You can find them in the properties of the corresponding pagerequest.When you finish recording click the "Stop Rec" button on the toolbar to exit the recordingmode. Now you can select any request in the left view and edit its properties.4
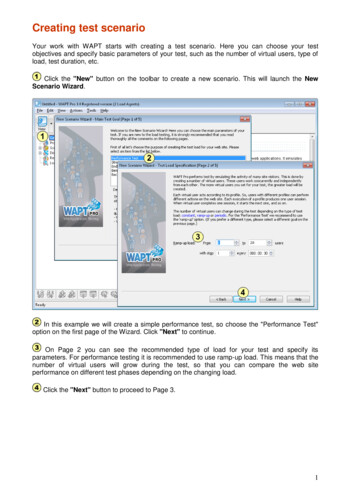
Properties of a request and its parameterizationSelect a request in the left view. The right view will contain two tabs. The "Properties" tab iswhere you can view and edit the properties of the selected request.The most important property is the list of parameters. These parameters deliver sessionspecific data from the client part of the web application to the server. For example, if you usesome user name and password to login to the web site, these credentials will be contained in theparameters of the login request.Unfortunately there are no standard names and meanings for the parameters. Each webapplication can use its own custom ones to pass its specific data. So in some cases you have toresearch and guess which parameter contains the value that you need to modify.Initially all parameters have static values saved during recording. However you can change this.For example, if you need each virtual user in your test to use a different name and password, youcan replace corresponding static values with dynamic ones calculated with help of special WAPTfunctions. Such functions can generate random values, read values from a predefined list andtake them from variables assigned earlier.This is called “Parameterization”. The understanding of this concept is very important forsuccessful use of any load testing tool, including WAPT.To edit any parameter, select it in the list and click the "Edit" button (or just double-click theparameter line).In the "Edit parameter" dialog box you can specify how to calculate the value for the selectedparameter.5
The processing of server responsesAnother tab available for any selected request is the "Response processing". Here you canspecify what to do with the received response (web page) in each emulated session. The pagecan contain important session-specific values that you need to use in subsequent requests.For example, let’s suppose that some page (p1) on your web site contains a list of items, which isdifferent in all sessions. You select an item in the list and proceed to the next page (p2). At thatmoment your browser submits the ID of the selected item to the server as one of the parametersof the corresponding HTTP request. In fact, p2 will be the page returned by the server in responseto that request.To emulate such session properly you need to specify how to extract that ID from the content ofp1 and insert it to the proper parameter of the request returning p2. This is another very importanttype of parameterization (it is often referred to as “correlation” in other sources).At the top of the "Response processing" tab there is a list of variables that will be assignedduring the processing. They will store string values within user session and can be reassigned insubsequent requests. This process is very similar to the calculation of request parameters. Youcan use same set of functions. The difference is that variables are updated after receiving serverresponse, whereas parameters are calculated before sending the request. Note that for yourconvenience the tab contains full information on the initially recorded request and response to it.There is one more goal in the processing of server responses. You can validate a response byspecifying criteria that must be met in order to treat it valid. Otherwise WAPT will produce an errorthat will be shown in the report and logs. You can validate by response time and page content.6
Automatic parameterizationThe parameterization procedure described above can be a rather complex and time consumingtask. Fortunately, WAPT can do a part of this work automatically.Click the "Settings" button on the toolbar and switch to the "Parameterization" tab.WAPT can check all web site responses received during recording for dynamic values locatedbetween specified left and right boundaries. When such value is found, WAPT creates a variablefor it. During the test the variable will be assigned a value extracted from the actual responseusing same rules. WAPT will also replace that value in the parameters of all subsequent requests,so that it would be taken from the variable.The "Extract to variables values of hidden fields in HTML forms" option works the same way.WAPT will create a variable for each hidden field of any HTML form found inside the serverresponses.In fact, this is the most common way to pass client-server data. That is why after recording aprofile you will probably see many variables created by WAPT and assigned with help of the“ Hidden()” function (on the “Response Processing” tab for some requests). You can also seehow these variables are used in the parameters of the subsequent requests with help of the“ Var()” function, which returns the value of a variable.7
Properties of a virtual user profileAfter recording a user session you can edit other options of your profile. Select it in the leftview and click the "Properties" tab in the right view.Here you can modify a number of options, such as “User think time” (the time betweensending subsequent requests), "Load page elements", “Keep alive server connection”, etc.If your web site requires Basic or Integrated Windows Authentication (NTLM), you can providea list of username/password pairs that will be used one by one to login virtual users of this profile.If you provide only one username and one password, all users will share them.Note that some options (“User think time”, “HTTP headers” and “Response validation rules”) canbe reassigned in the properties of each request. For such options the values that you specify onthe profile level will be the default values.8
Test verificationSince your test may require parameterization before you can execute it correctly, it isrecommended that you verify it before running. This will let you check and eliminate anyparameterization problems without creating a big load volume.Click the "Verify Test" button on the toolbar. WAPT will let you select profiles for verificationand will execute each of the selected profiles one time. Wait until the verification is finished.WAPT will show a simple report that contains summary information about errors occurred duringthe execution.Actually what you get is a reduced version of the regular test report. It does not include datarelated to the load and performance, because the purpose of verification is only to check thecorrect work of the profiles.Note that response codes starting with “3” (like 304) are not errors. These are HTTP redirects thatare processed by WAPT automatically. Same refers to the 401 code, which means that the serverrequires authentication. If it is followed by the 403 code, you should provide user name andpassword in the profile properties and verify the test again.If you see the 404 (not found) code, you should check if the same code was returned when youoriginally recorded the profile. You can do this on the “Response processing” tab for thecorresponding request. Finally, if you see the “network error”, this probably means that WAPTcannot connect to the target web site. You should check that your network configuration permitsdirect connection to it. You can also configure WAPT to run test through a proxy, but this is notrecommended.9
After you verify the test, the "Logs" folder in the left view will become expandable. It willcontain the detailed information about the executed verification sessions. To further track down allthe problems you can browse the content of that folder.Log viewerLog Viewer provides the detailed representation of all requests, server responses and errorsappeared during the test run or verification. This information is structured with help of a tree viewincluding profiles, virtual users, sessions and requests.Expand the "Logs" folder in the left view and select a page request. In the upper right viewyou will see the log lines containing service messages, page requests and requests to pageelements. A page request is highlighted in green if it was processed without errors. Requestscompleted with errors are highlighted in red. You can select any line of log and see the details inthe lower part of the view.When browsing logs you can compare requests and responses saved during the test run withinitially recorded ones. This feature is very useful when you work on the parameterization andneed to find values specific for each user session.You can use an additional toolbar located under the left view for fast and easy navigationthrough the log.Note that by default logs are disabled for efficiency reasons, so if you want to obtain them for atest run, you should enable this feature on the "Log and Report Settings" page.10
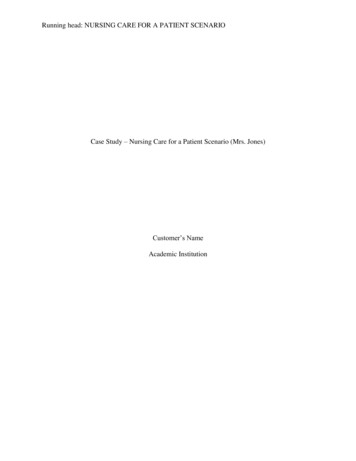
Test VolumeNow we are ready to specify the load parameters for the test. Select the "Test Volume" itemin the left view inside the "Scenario" folder.We have already specified the type of load and test duration options in the Scenario Wizard. If youneed to change them, you can do this using this page. For example, you can choose fixed numberof users or periodic load instead of ramp-up.Check the profiles that will be used in the test. If you have several ones, you can choose howto divide the load between them.For each profile you can specify the type of load and other parameters. For example, you canspecify fixed load of 15 virtual users for the first profile and growing load of 10 to 30 users for thesecond one. This is the load specified on the screenshot above. This means that the test willbegin with 25 total virtual users, and during the test the load will grow to 45 users. The graph atthe bottom of the page represents this situation.You can select any profile in the list to change its load options. On the above screenshot the“Profile2” is selected, so its options are shown in the controls below the list.In the Pro version of the product you can also specify different load agents for different profiles.Now we have finished designing our test, so we can save it. Click the "Save" button on thetoolbar to save your test scenario to a file. All profiles will be also saved to the separate files in thesame folder. To open the same test in the future you will need to keep all those files.11
Selecting load agents* and starting the testWAPT Pro allows you to create test load with the help of load agents installed on differentcomputers. The more agents you use, the greater test volume you can create. Test execution ismanaged from the workplace component and all statistics is gathered from all agents to a singlereport automatically.Select the "Load Agents" item in the left view inside the "Distributed Test Run" folder.Click "Search LAN for available load agents" to search your Local Area Network forcomputers with installed agents. If you have agents outside LAN, you can add them manuallyusing the "Add" button. Since the connection between the workplace component and load agentsis done over TCP/IP, agents can be installed remotely, provided that they are available over theInternet.Put checkmarks near agents that you want to use in the test. You should check at least one.Click the "Run Test" button on the toolbar to start your test.* Available only in Pro version12
Test resultsYou can start monitoring the test results right after you launch the test. You may only need to waitseveral seconds for the first statistical information to come.The results are represented in the form of Summary Report, Summary Graphs and graphs foreach user profile and single request. You can select the desired option in the left view.The most important parameters that you can find in the results are described below.Error rate - the number of page requests or user sessions completed with errors as a percentageof the total number of requests or sessions. Errors can be either reported by the server ordetected as a result of network problems, wrong server responses and timeouts.Response time - time required by your web site to provide the correct reply to a single pagerequest. It can be measured together with the time required to download all page elements orwithout it.Number of pages per second - number of page requests successfully served by your web siteper second.To estimate the performance and reliability of your web site you should analyze how the abovevalues change during the test depending on the test load.You can save the results of the test run either as a single report in the HTML format, or as aspecial .wpr file. In the latter case you will be able to open that file with WAPT again.13
The use of JavaScript*You can include the execution of a JavaScript code into virtual user profiles. This provides youwith the most universal way to perform any specific and complex calculations required to set thecorrect values of the request parameters.Select a request after which you want to execute a JavaScript code. Choose "Add JavaScript" on the toolbar. The JavaScript operator will be added to the profile. Select it to editthe code in the right view. Initially the edit field contains a comment with a short instruction on howto use this feature.In your code you can use functions defined in the WAPT Pro JavaScript library. Click the"JavaScript Library" button to extend it by adding more .js files.Click the "Check Syntax" button to check the syntax of your JavaScript code. The result ofthe check will be displayed in the “Output” window.There is another way to use JavaScript code in your profiles. You can call functions defined in theJavaScript library directly when you specify how to calculate values for request parameters andvariables. You can do this in the properties of any request the same way you use other internalWAPT Pro functions.* Available only in Pro version14
Performance counters*In addition to the external performance parameters, such as response time, WAPT Pro can collectperformance data directly from the server that you test. This data is included in separate tables inthe report along with other parameters.Select the "Performance Counters" item in the left view.Now in the right view you can add one or several servers that are used to run your web site.WAPT Pro will connect to those servers and collect CPU, disk space, memory and network usagedata during the test. You can choose between using WMI and SNMP interface for each server.Select one that is supported by each system and specify other connection options.You can also monitor one or several database servers. This is done over an ODBC connectionto each database. WAPT Pro includes a set of predefined counters for MS SQL and Oracledatabases, but you can add your own ones that will read any required performance parameters.For each counter you should specify the SQL query that is used to retrieve it from the database.* Available only in Pro version15
successful use of any load testing tool, including WAPT. To edit any parameter, select it in the list and click the "Edit" button (or just double-click the parameter line). In the "Edit parameter" dialog box you can specify how to calculate the value for the selected parameter.

![Informatica Interview Questions and Answers [Scenario-Based]](/img/2/informatica-interview-questions-and-answers-scenario-based-1.jpg)