Transcription
Discrete Event Simulation &Queuing SystemsORIE 3120Lecture 10March 3rd and 5th
SimulationUsing the computer as our laboratory!Implement ( mathematical) model of ( physical)system on computer.Do experiments on model to draw conclusionsabout system.
Examples Traffic lightsPlant breedingSetting pricesDesign of cryptocurrencyStaffing (of, e.g., call centers)Verifying analytic results https://www.youtube.com/watch?v 0ZGbIKd0XrM
There are 2 kinds of simulation Discrete event simulation Discrete time simulation The focus in this course will be on discreteevent simulation
Overview Example: The Cookie Problem Discrete Event Simulation A Graphical Language Programming a Simulation in MS Excel
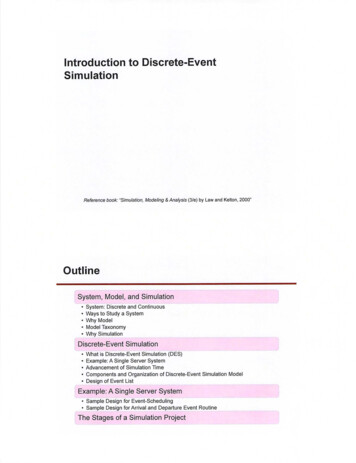
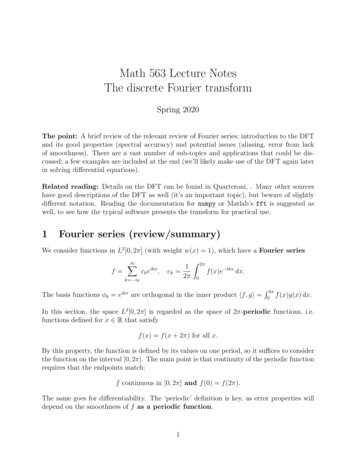
Cookie Problem (#1)Trays ofcookies arriveevery 13.75minutesOven cycle is 13.5minutes, cannotbe interruptedOven capacity istwo trays
Another example
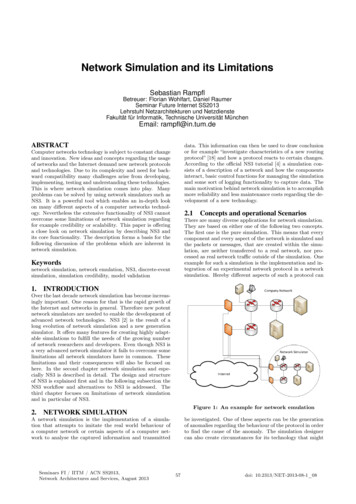
Ride sharing at an airportRiders arriverandomlyA queue of riderscan build upIf riders wait too long,some will find anotherway homeRiders & drivers arematchedDrivers arriverandomlyA queue of driverscan build upIf the driver queue is toolong, some will leave
Cookie Problem (#1)Trays ofcookies arriveevery 13.75minutesOven cycle is 13.5minutes, cannotbe interruptedOven capacity istwo trays
What is the average rate at which trays leave theoven?(a)(b)(c)(d)(e)1 tray / 13.5 min 0.074 trays/min2 trays / 13.5 min 0.148 trays/min1 tray / 13.75 min 0.073 trays/min2 trays / 13.75 min 0.145 trays/minnone of the above
What is the average rate at which trays leave theoven?(a)(b)(c)(d)(e)1 tray / 13.5 min 0.074 trays/min2 trays / 13.5 min 0.148 trays/min1 tray / 13.75 min 0.073 trays/min2 trays / 13.75 min 0.145 trays/minnone of the above
Cookie Problem (#2)Oven cycle is 13.5minutes, cannotbe interruptedTrays ofcookies arriveevery 13.75minutes onaverageTime betweenarrivals isuniformlydistributed in[10.5,17]A queue of trayscan build up dueto randomness ofarrivalsOven capacity istwo trays
What is the average rate at which trays leave theoven?(a)(b)(c)(d)(e)1 tray / 13.5 min 0.074 trays/min2 trays / 13.5 min 0.148 trays/min1 tray / 13.75 min 0.073 trays/min2 trays / 13.75 min 0.145 trays/minnone of the above
What is the average rate at which trays leave theoven?(a)(b)(c)(d)(e)1 tray / 13.5 min 0.074 trays/min2 trays / 13.5 min 0.148 trays/min1 tray / 13.75 min 0.073 trays/min2 trays / 13.75 min 0.145 trays/minnone of the above
Cookie Problem (#3)Oven cycle is 13.5minutes, cannotbe interruptedTrays ofcookies arriveevery 6minutes onaverageTime betweenarrivals isuniformlydistributed in[4,8]A queue of trayscan build up dueto randomness ofarrivalsOven capacity istwo trays
What is the average rate at which trays leave theoven?(a)(b)(c)(d)(e)1 tray / 13.5 min 0.074 trays/min2 trays / 13.5 min 0.148 trays/min1 tray / 6 min 0.167 trays/min2 trays / 6 min 0.333 trays/minnone of the above
What is the average rate at which trays leave theoven?(a)(b)(c)(d)(e)1 tray / 13.5 min 0.074 trays/min2 trays / 13.5 min 0.148 trays/min1 tray / 6 min 0.167 trays/min2 trays / 6 min 0.333 trays/minnone of the above
Cookie Problem (#4)Oven cycle is 13.5minutes butcannot beinterruptedTrays of c.c.arrive every13.5 minuteson averageuniform over[9,18]Trays of p.b.arrive every 14minutes onaverage,uniform over[12,16]Queues of trayscan build up dueto randomness ofarrivalsOven capacity istwo trays (can beof mixed type)Maximumthroughput is 2trays every 13.5minutes
What is the average rate at which trays leave theoven?(a)(b)(c)(d)(e)2 trays / 13.5min .148 trays/min1 tray / 13.5min 1 tray/ 14min .145 trays / min1 tray / 13.5 min .074 trays/min1 tray / 14 min .071 trays/minnone of the above
What is the average rate at which trays leave theoven?(a) 2 trays / 13.5min .148 trays/min(b) 1 tray / 13.5min 1 tray/ 14min .145 trays /min(c) 1 tray / 13.5 min .074 trays/min(d) 1 tray / 14 min .071 trays/min(e) none of the above
Point is.Can still answer this particular questionanalytically, but it’s easy to simulate and get an answer!
Some questions are even harderto answer analytically What is the average # of trays in queue? How often does the # of trays in queue exceed 5?Answers may depend on the priority rule:“Always fill oven” or “cook on arrival” Which priority rule gives the smaller average # oftrays in queue?But again it is easy to simulate and get an answer!
Examples from ride sharing What fraction of riders won’t be able to get a car? What fraction of riders will have to wait longerthan 10 minutes to be picked up? What is the average price that riders will pay? How much money per hour will drivers earn? What pricing algorithm should I use to maximizethe total value created for riders and drivers?Again easy to simulate and get an answer!
Discrete Event Simulation The system is described by a state. The state changes only at discrete points intime, called events. The interval between events is called a delay,or duration. The delay could be random. Events can trigger other events depending onconditions that depend on the state.
The Cookie Problem What is the state of the system? At what points in time (events) does the statechange? What are the delays? What events could trigger other events? What are the conditions under which eventsare triggered?
Discrete Event Simulation ispowerful. It models complex behavior with simplelanguage of “states”, “events”, “delays”,“conditions”, and “triggers” It can jump in time from one event to another Nothing ‘interesting’ happens between events: nochange in state This allows it to rapidly simulate days/weeks/yearsof real-time activity. If the state is simple (e.g. inventory counts)then processing time and memory requiredare very small.
Discrete Event Simulation canbe fast. Two models of semiconductor fab One focused on wafer-level simulation Kept track of each tray of wafers One focused on machine cycles Counted wafers Same question asked of both models Is there enough capacity to meet demand? Same answer from both models But one model (wafer counter) ran 10,000 Xfaster
Overview Example: The Cookie Problem A Model of Behavior: Discrete EventSimulation A Graphical Language Programming a Simulation in MS Excel
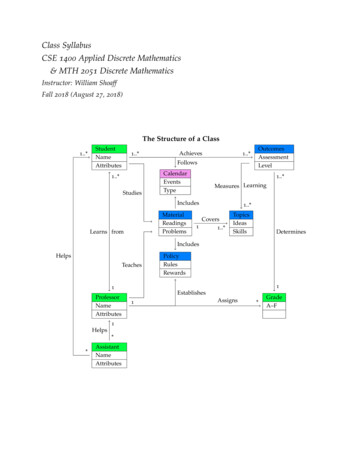
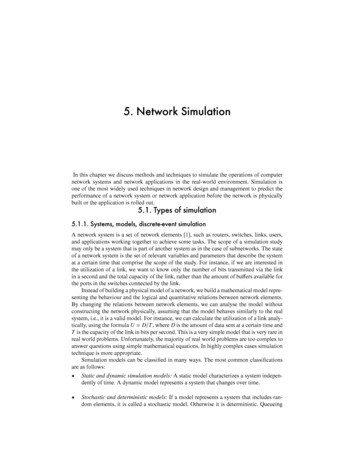
How a Discrete Event SimulationWorks At any point in time there is an ordered list of events scheduled tooccur in the future (the event queue). The state of the system is described by state variables. The simulation engine removes the first event from the event queueand advances the simulation clock to the time recorded on that event. The function associated with that event is called. The function may change the values of the state variables. The simulation engine checks to see if any trigger conditions aresatisfied. If a trigger condition is satisfied, the simulation engine creates a new eventfor each trigger. The scheduled time for the new event is the current simulation clock timeplus any delay associated with the trigger. The new event is inserted into the event queue in order of the event time. The simulation continues until there are no more events in the eventqueue, or until a simulation stop time is reached.
How a Discrete Event SimulationWorksScheduled Events Sorted in Increasing Order of Scheduled TimeTime: 4.0Event: EndService4.3ArrivalCurrent Time: 3.3 later times other events
How a Discrete Event SimulationWorksScheduled Events Sorted in Increasing Order of Scheduled TimeTime: 4.0Event: EndService4.3ArrivalCurrent Time: 3.3Remove NextScheduledEvent
How a Discrete Event SimulationWorksScheduled Events Sorted in Increasing Order of Scheduled Time4.3ArrivalCurrent Time: 3.3Current Time: 4.0Time: 4.0Event: EndServiceAdvanceSimulationClock
How a Discrete Event SimulationWorksScheduled Events Sorted in Increasing Order of Scheduled Time4.3ArrivalCurrent Time: 4.0Time: 4.0Event: EndServiceExecute StateChangeFunction
How a Discrete Event SimulationWorksScheduled Events Sorted in Increasing Order of Scheduled Time4.3ArrivalCurrent Time: 4.0Time: 4.0Event: EndServiceIf ConditionSatisfied
Scheduled Events Sorted in Increasing Order of Scheduled Time4.3ArrivalCurrent Time: 4.0Time: 4.0Event: EndServiceIf ConditionSatisfied GenerateNew Event(s)with latertime(s)
How a Discrete Event SimulationWorksScheduled Events Sorted in Increasing Order of Scheduled Time4.3ArrivalCurrent Time: 4.0Insert Eventinto Schedule
How a Discrete Event SimulationWorksScheduled Events Sorted in Increasing Order of Scheduled Time4.3ArrivalCurrent Time: 4.0Insert Eventinto Schedule
How a Discrete Event SimulationWorksScheduled Events Sorted in Increasing Order of Scheduled Time4.3ArrivalCurrent Time: 4.0Remove NextScheduledEventRepeat
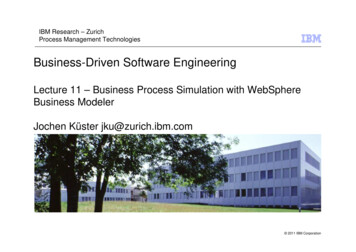
How a Discrete EventSimulation Works: SummaryScheduled Events Sorted in Increasing Order of Scheduled TimeTime: 4.0Event: EndService4.3Arrival later times other eventsInsert Eventinto ScheduleCurrent Time: 3.3Current Time: 4.0Remove NextScheduledEventAdvanceSimulationClockExecute StateChangeFunctionIf ConditionSatisfied GenerateNew Event(s)with latertime(s)
The Simplified Cookie ProblemOven cycle is 25minutes butcannot beinterruptedTrays ofcookies arriveevery 13.75minutes onaverageTime betweenarrivals isuniformlydistributed in[10.5,17]A queue of trayscan build up dueto randomness ofarrivalsOven capacity istwo traysMaximumthroughput is 2trays every 25minutes
Modeling State of the system Q number of trays in queue (0,1, 2, ) P number of trays in oven (0,1, or 2) Events that change system Arrival (Q increases)Start (Q decreases, P increases)Finish (P decreases)Initialize (set P and Q to initial values)
Modeling Triggers and Delays Start triggers Finish with delay of 25 minutes Call this OvenCycleTime OvenCycleTime 25 Arrival triggers Arrival with delay of 13.75minutes, on average Call this InterarrivalTime InterarrivalTime 10.5 Rnd()*(17-10.5) Rnd() is a pseudo-random number in (0,1)
Modeling Conditional Triggers Arrival triggers Start if P 0 Call this condition OvenIsEmpty OvenIsEmpty if(P 0,true,false) Finish triggers Start if Q 0 Call this condition CookiesInQueue CookiesInQueue if (Q 0,true,false)
Modeling State Changes Arrival: Q Q 1 Finish: P 0 Start: if Q 2 then P 2, else P Q; Q Q-P Start does not get triggered unless Q is at least 1 Initialize: Q 0,P 0
Overview Motivation: The Cookie Problem A Model of Behavior: Discrete EventSimulation Event Graph Language Programming a Simulation in MS Excel
Event Graph LanguageWe will use Excel drawing tools to describediscrete event simulations using the eventgraph viceEventServiceTimeEndServiceEventDelay
Graph Language is forIllustration PurposesGraph language implements event, trigger anddelay logic of simulationCould also implement this yourself in anygeneral purpose language (e.g., Python)[Still have to implement state changes in VBA]
Next few slides uses ExcelImplementation but the main purpose is to serve as anexample what Discrete Event Simulation is.
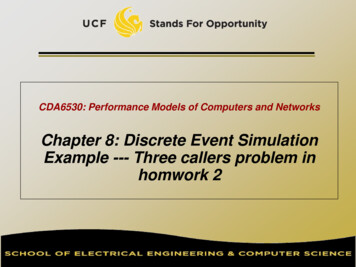
The Simplified Cookie tartCookiesInQueueOvenCycleTimeFinish
The Simplified Cookie ModelQ 0;P 0Initialize 10.5 rnd()*(6.5)Q Q 1ArrivalInterarrivalTime if(P 0,true,false)OvenIsEmptyStartCookiesInQueueIf Q 2 then P 2, else P Q;Q Q-P if(Q 0,true,false)FinishOvenCycleTimeP 0 25
First Event
Second Event
What does the event queue looklike right now?Second Event(a)(b)(c)(d)(e)Start at t 0, Finish at t 25Start at t 0Arrival at a time randomly distributedbetween 10.5 and 17Start at t 0, Arrival at a time randomlydistributed between 10.5 and 17Finish at t 25
What does the event queue looklike right now?Second Event(a)(b)(c)(d)(e)Start at t 0, Finish at t 25Start at t 0Arrival at a time randomly distributedbetween 10.5 and 17Start at t 0, Arrival at a time randomlydistributed between 10.5 and 17Finish at t 25
Third Event
What does the event queue looklike right now?Third Event(a)(b)(c)(d)(e)Arrival at a time randomly distributedbetween 10.5 and 17; Finish at t 25Arrival at a time randomly distributedbetween 10.5 and 17; Finish at t 0Arrival at a time randomly distributedbetween 10.5 and 17; Finish at a timerandomly distributed between 0 and 25Finish at a time randomly distributedbetween 0 and 25Finish at t 25
What does the event queue looklike right now?Third Event(a)(b)(c)(d)(e)Arrival at a time randomly distributedbetween 10.5 and 17; Finish at t 25Arrival at a time randomly distributedbetween 10.5 and 17; Finish at t 0Arrival at a time randomly distributedbetween 10.5 and 17; Finish at a timerandomly distributed between 0 and 25Finish at a time randomly distributedbetween 0 and 25Finish at t 25
Fourth Event
What does the event queue looklike right now?Fourth Event(a)(b)(c)(d)(e)Arrival at time t Uniform(10.5,17);Finish at time 25Finish at time 25Arrival at time t Uniform(10.5,17)Arrival at time t Uniform(10.5,17), Startat time tArrival at time t Uniform(10.5,17);Finish at time 25, Start at time t
What does the event queue looklike right now?Fourth Event(a)(b)(c)(d)(e)Arrival at time t Uniform(10.5,17);Finish at time 25Finish at time 25Arrival at time t Uniform(10.5,17)Arrival at time t Uniform(10.5,17), Startat time tArrival at time t Uniform(10.5,17);Finish at time 25, Start at time t
Fifth Event
Graph Rules There must be one event node that has no incomingarcs (triggers): this is the first event Nodes must be connected (use MS Excel connectors). Condition nodes trigger all outgoing arcs, if conditionis true There are no “yes/no” branches in this language You will need two condition nodes to model a branchingprocess (one for the “yes” and one for the “no”) Events can be triggered only by other events,through condition nodes and delay nodes
Yes-No Branches are not allowedInstead use two conditionsEvent1IsQueue?Event1NoEvent3IsQueue?Is NotQueue?Event2Event3YesEvent2
In Recitation & HW, you will gethands-on experience First, you will create an MS Excel style eventgraph to model a problem Then, you will program and run thesimulation model.
Overview Motivation: The Cookie Problem A Model of Behavior: Discrete EventSimulation A Graphical Language Programming a Simulation in MS Excel
Now we’ll focus on thisparticular Excel implementation Use Visual Basic for Applications (VBA) in Excel Use simulation template file to start “SimplifiedCookie.xls” Contains code to analyze graph and run simulation Simplified model is already coded
Building the Graphical Model
Model in Excel
Use Tokens in Text Strings Template code ignores shape Use tokens to indicate type of node for events for delays ? for conditions
Model With Tokens
Analyze and Run DialogDebug:run oneevent ata timeFirst buildthe modeland checkfor errorsSet simulationdurationSwitch to view different sheets(Model, Log, Trace) as desiredRun untildone
English Interpretation on Sheet“SimLog”
Coding the Components
Switch to Visual Basic Editor( Alt F11 )Development Code: Do not modify(all variables and objects beginningwith “Sim” are reserved)User Code: Put your code here. Addmore modules if you like
You Write the Code:Declare Your State Variables'Declare your variables hereGlobal Q As IntegerGlobal P As IntegerGlobal CumulativeCompletions As IntegerGlobal means it is available for use in other modules.Q is the variable tracking the number of trays in thequeue.P is the number of trays in the oven.CumulativeCompletions is a statistic we want tocompute; it is not essential to the model.
Write the Event Functions(to change the state)Function Initialize()'every simulation should have a functionwhich initializes the state variablesQ 0P 0CumulativeCompletions 0End FunctionFunction Arrival()'this represents the arrival of a tray of cookiesQ Q 1End FunctionFunction Start()'this function represents the start of the oven cycleIf Q 2 Then P 2 Else P QQ Q-PEnd FunctionFunction Finish()'this function represents the end of the oven cycleCumulativeCompletions CumulativeCompletions PP 0End Function
Write the Condition Functions:to Test the StateFunction CookiesInQueue() As Integer'this illustrates the if.then.else statementIf Q 0 Then CookiesInQueue True Else CookiesInQueue FalseEnd FunctionFunction OvenIsEmpty() As IntegerIf P 0 Then OvenIsEmpty True Else OvenIsEmpty FalseEnd FunctionCondition functions must return aninteger:True -1; False 0
QuestionWhich of these lines of code returns True if N 5inside of a function called F?(a)(b)(c)(d)(e)If N 5 Then Return True Else Return FalseIf N 5 Then F True Else F FalseIf N 5 Return True Else Return FalseIf N 5 F True Else F FalseNone of the above
QuestionWhich of these lines of code returns True if N 5inside of a function called F?(a)(b)(c)(d)(e)If N 5 Then Return True Else Return FalseIf N 5 Then F True Else F FalseIf N 5 Return True Else Return FalseIf N 5 F True Else F FalseNone of the above
QuestionWhich of these lines of code returns True if N 5inside of a function called F?(a)(b)(c)(d)(e)If N 5 Then F -1 Else F 0If N 5 Then F 1 Else F 0If N 5 Then F 1 Else F -1If N 5 Then F 0 Else F -1None of the above
QuestionWhich of these lines of code returns True if N 5inside of a function called F?(a)(b)(c)(d)(e)If N 5 Then F -1 Else F 0If N 5 Then F 1 Else F 0If N 5 Then F 1 Else F -1If N 5 Then F 0 Else F -1None of the above
Write the Code to GenerateDelays and DurationsFunction OvenCycleTime() As Variant'functions that return a value for time should use the Variant data typeOvenCycleTime 25End FunctionFunction InterarrivalTime() As Variant'this function returns a random interarrival timeDim duration As Variant 'local variable declaration; duration will be the length of theinterarrival timeduration 10.5 Rnd() * 6.5 'duration will be a random number uniformly distributedbetween 10.5 and 17.InterarrivalTime duration 'this is how you return a valueEnd Function
QuestionHow do I create a random variable that is Uniformlydistributed between 5 and 7?(a)(b)(c)(d)(e)duration 5 7*Rnd()duration 7 5*Rnd()duration 5 2*Rnd()duration 2 5*Rnd()None of the above
Debugging the Model
Debug: Step Through Model
Define Ranges to StoreVariables
Write Code to Store VariablesFunction r of Trays in Queue").Value QWorksheets("Sheet1").Range("Number of Trays in Oven").Value PWorksheets("Sheet1").Range("Cumulative Completions").Value CumulativeCompletionsEnd FunctionYour range namesYour state variables
Modify Code to Store VariablesAfter Each EventFunction Initialize()'every simulation should have a function which initializes the state variablesQ 0P 0CumulativeCompletions 0OutputVariablesEnd FunctionFunction Arrival()'this represents the arrival of a tray of cookiesQ Q 1OutputVariablesEnd FunctionFunction Start()'this function represents the start of the oven cycleIf Q 2 Then P 2 Else P QQ Q-POutputVariablesEnd FunctionFunction Finish()'this function represents the end of the oven cycleCumulativeCompletions CumulativeCompletions PP 0OutputVariablesEnd Function
Input/Output If you want to read input data from thespreadsheet (eg. Initial parameter settings),use ranges in a similar way. Now, single step through your simulationwatching your variables change with eachevent. The more variables you track, the easier it will beto debug your model.
First Event
Second Event
Third Event
Fourth Event
Fifth Event
Running the Model,Collecting its Output
Creating a Trace A trace is a history of your state variables after eachevent The simulator automatically writes out whatever is inthe range called “SimTraceRange” before and aftereach event Stored on separate lines of sheet “SimTrace” It also writes out the labels found in the range called“SimTraceLabelRange” at the head of this list. You must define these two ranges.
Define Trace and Label Ranges
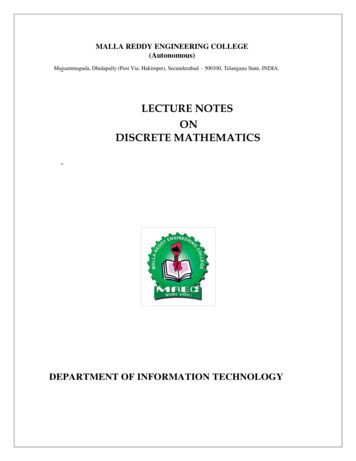
This is how a trace looks.There are 2 rows foreach event: begin andend. The 2nd rowcaptures time spent instate (“Elapsed time”)
This is how a trace looks.To see how a variable changes over time, make an X-Y scatterplot. Get X from “Current Time” and Y from the variable youwant to plot (e.g., “Number of Trays in Queue”)
Analyzing the Output
X-Y Scatter Plot
Statistics Computed After Each Run Statistics inserted into first four lines of trace output. Four statistics computed (Min, Max, Mean, Std. Dev.)even if they don’t make sense for your particularstate variables
One Problem If you copy and paste a node or a connector,MS Excel does not give it a new name. Since the code uses the name of theautoshape to identify it, the code getsconfused. Be sure to create each node from the shapesmenu fresh, to make sure it has a uniquename.
Overview Motivation: The Cookie Problem A Model of Behavior: Discrete EventSimulation A Graphical Language Programming a Simulation in MS Excel
Key Lessons Discrete event simulation is a flexible way todescribe a system’s behavior. Basic simulations can be implemented inExcel, but require user coding in VBA. The structure of a simulation model can bedescribed with an event graph. Building, running, and analyzing a simulationmodel is a structured process.
The simulation engine removes the first event from the event queue and advances the simulation clock to the time recorded on that event. The function associated with that event is called. The function may change the values of the state variables. The simulation engine checks to see if any trigger conditions are satisfied.