Transcription
A Guide to AssessingGreen InfrastructureCosts and Benefits forFlood ReductionNational Oceanic and Atmospheric Administration (NOAA)Office for Coastal ManagementApril 2015 Prepared by Eastern Research Group, Inc.ECONOMICS OF GREEN INFRASTRUCTURE
AcknowledgmentsThis project was undertaken with the active participationand support of a number of individuals and organizations.The project team consisted of Jeffery Adkins, Tashya Allen,Lori Cary-Kothera, Nancy Cofer-Shabica, Doug Harper, andJean Tanimoto from the National Oceanic and AtmosphericAdministration’s Office for Coastal Management; andTess Forsell, Arleen O’Donnell, and Lauren Scott fromEastern Research Group, Inc. The NOAA Office for CoastalManagement also acknowledges community partners andorganizations from Duluth, Minnesota, Toledo, Ohio, andthe He eia watershed in Hawai‘i.For more information or questions about this guide, pleasecontact coastal.info@noaa.govNOAA Office for Coastal ManagementCharleston, South CarolinaSilver Spring, MarylandRegional Offices:Pacific Islands, Gulf of Mexico, Great Lakes,Mid-Atlantic, Northeast, and West Coast(843) 740-1254www.coast.noaa.gov
Table of ContentsIntroduction . . . . . . . . . . . . . . . . . . . . . . . . . . . . . . . . . . . . . . . . . . . . . . . . . . . . . . . . . . . . . . . . . . . . . . . . . . . . . . 2How to Use This Guide . . . . . . . . . . . . . . . . . . . . . . . . . . . . . . . . . . . . . . . . . . . . . . . . . . . . . . . . . . . . . . . . . . . 3Key Terms . . . . . . . . . . . . . . . . . . . . . . . . . . . . . . . . . . . . . . . . . . . . . . . . . . . . . . . . . . . . . . . . . . . . . . . . . . . . . . 3Framework . . . . . . . . . . . . . . . . . . . . . . . . . . . . . . . . . . . . . . . . . . . . . . . . . . . . . . . . . . . . . . . . . . . . . . . . . . . . . . 4Background . . . . . . . . . . . . . . . . . . . . . . . . . . . . . . . . . . . . . . . . . . . . . . . . . . . . . . . . . . . . . . . . . . . . . . . . . . . . . . 5Step 1: Define the Flooding Problem . . . . . . . . . . . . . . . . . . . . . . . . . . . . . . . . . . . . . . . . . . . . . . . . . . . . . . . 6Task 1: Choose a watershed study area . . . . . . . . . . . . . . . . . . . . . . . . . . . . . . . . . . . . . . . . . . . . . . . . . . . . . . . . . . . . . . . . . . . . . . . . . . . . 7Task 2: Characterize flooding issues and causes . . . . . . . . . . . . . . . . . . . . . . . . . . . . . . . . . . . . . . . . . . . . . . . . . . . . . . . . . . . . . . . . . . . . 8Task 3: Determine what’s at risk . . . . . . . . . . . . . . . . . . . . . . . . . . . . . . . . . . . . . . . . . . . . . . . . . . . . . . . . . . . . . . . . . . . . . . . . . . . . . . . . . . 9Output: Definition of the Problem and Study Parameters . . . . . . . . . . . . . . . . . . . . . . . . . . . . . . . . . . . . . . . . . . . . . . . . . . . . . . . . . . . . 9Step 2: Assess Flooding Scenarios without Green Infrastructure . . . . . . . . . . . . . . . . . . . . . . . . . . . . . . 10Task 1: Gather data . . . . . . . . . . . . . . . . . . . . . . . . . . . . . . . . . . . . . . . . . . . . . . . . . . . . . . . . . . . . . . . . . . . . . . . . . . . . . . . . . . . . . . . . . . . 10Task 2: Model current and future flooding . . . . . . . . . . . . . . . . . . . . . . . . . . . . . . . . . . . . . . . . . . . . . . . . . . . . . . . . . . . . . . . . . . . . . . . 11Task 3: Quantify current and future flood damages . . . . . . . . . . . . . . . . . . . . . . . . . . . . . . . . . . . . . . . . . . . . . . . . . . . . . . . . . . . . . . . . 12Output: Financial Impacts of Flooding under Current and Future Scenarios without a Green Infrastructure Strategy . . . . . . . . 13Step 3: Identify How a Flood Reduction Target Can Be Met with Green Infrastructure . . . . . . . . . . . . 14Task 1: Select a flood reduction target . . . . . . . . . . . . . . . . . . . . . . . . . . . . . . . . . . . . . . . . . . . . . . . . . . . . . . . . . . . . . . . . . . . . . . . . . . . 15Task 2: Identify green infrastructure options . . . . . . . . . . . . . . . . . . . . . . . . . . . . . . . . . . . . . . . . . . . . . . . . . . . . . . . . . . . . . . . . . . . . . 15Task 3: Determine how much storage the green infrastructure options can provide . . . . . . . . . . . . . . . . . . . . . . . . . . . . . . . . . . . 16Output: Preliminary Green Infrastructure Strategy for Meeting the Flood Reduction Target . . . . . . . . . . . . . . . . . . . . . . . . . . . . . 17Step 4: Assess Flooding Scenarios with Green Infrastructure . . . . . . . . . . . . . . . . . . . . . . . . . . . . . . . . . 18Task 1: Model current and future flooding if the flood reduction target is met with green infrastructure . . . . . . . . . . . . . . . . . . 19Task 2: Quantify current and future flood damages if the flood reduction target is met with green infrastructure . . . . . . . . . . 19Output: Impacts of Flooding under Current and Future Scenarios with a Green Infrastructure Strategy . . . . . . . . . . . . . . . . . . . 20Step 5: Estimate Benefits and Costs . . . . . . . . . . . . . . . . . . . . . . . . . . . . . . . . . . . . . . . . . . . . . . . . . . . . . . . 21Task 1: Estimate green infrastructure option unit costs and green infrastructure strategy cost . . . . . . . . . . . . . . . . . . . . . . . . . . 22Task 2: Estimate green infrastructure strategy benefits and co-benefits . . . . . . . . . . . . . . . . . . . . . . . . . . . . . . . . . . . . . . . . . . . . . . 23Task 3: Annualize costs and benefits over specific time frame . . . . . . . . . . . . . . . . . . . . . . . . . . . . . . . . . . . . . . . . . . . . . . . . . . . . . . . 24Output: Annualized Net Benefits . . . . . . . . . . . . . . . . . . . . . . . . . . . . . . . . . . . . . . . . . . . . . . . . . . . . . . . . . . . . . . . . . . . . . . . . . . . . . . . . 25Step 6: Identify and Communicate the Desired Green Infrastructure Strategy . . . . . . . . . . . . . . . . . . . 26Task 1: Finalize a green infrastructure strategy . . . . . . . . . . . . . . . . . . . . . . . . . . . . . . . . . . . . . . . . . . . . . . . . . . . . . . . . . . . . . . . . . . . . 26Task 2: Communicate green infrastructure strategy and plan next steps . . . . . . . . . . . . . . . . . . . . . . . . . . . . . . . . . . . . . . . . . . . . . 27Output: Implementation of Green Infrastructure Strategy . . . . . . . . . . . . . . . . . . . . . . . . . . . . . . . . . . . . . . . . . . . . . . . . . . . . . . . . . . 28Case Studies . . . . . . . . . . . . . . . . . . . . . . . . . . . . . . . . . . . . . . . . . . . . . . . . . . . . . . . . . . . . . . . . . . . . . . . . . . . . 29Key Resources . . . . . . . . . . . . . . . . . . . . . . . . . . . . . . . . . . . . . . . . . . . . . . . . . . . . . . . . . . . . . . . . . . . . . . . . . . . 291
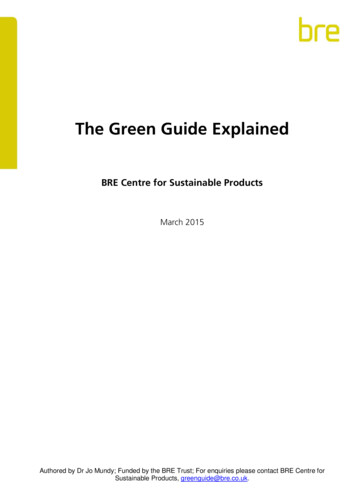
IntroductionThe purpose of this guide is to provide a process that communities can use to assess the costsand benefits of green infrastructure to reduce flooding. The guide takes a step-by-step, watershedbased approach to documenting the costs of flooding; projecting increased flooding and associatedcosts under future land use and climate conditions; and calculating benefits and costs of reducingflooding with green infrastructure over the long term. The guide is based on the experiences of threecommunities in the Great Lakes region (Duluth, Minnesota; Toledo, Ohio; and Green Bay, Wisconsin).To ensure transferability to different types of watersheds and communities, the methods were appliedto the He‘eia watershed in Hawai‘i. Valuable transferability insights from the He‘eia watershed partnershave been incorporated.This process guide outlines a six-step process, with specific tasks associated with each step.1.Define the Flooding Problem2.Assess Flooding Scenarios without Green Infrastructure3.Identify How a Flood Reduction Target Can Be Met with Green Infrastructure4.Assess Flooding Scenarios with Green Infrastructure5.Estimate Benefits and Costs6.Identify and Communicate the Desired Green Infrastructure StrategyKey considerations, recommended expertise, and case study examples are highlighted for practicalimplementation tips and lessons learned. Finally, key resources are provided at the end of this guide.2
HOW TO USE THIS GUIDECommunities should use this guide as a framework that can be adapted for their own purposesto inform planning-scale assessments and spark discussion about green infrastructure optionsto mitigate flooding and provide other watershed benefits. By following the guide’s six steps fordeveloping a green infrastructure strategy, including estimation of associated costs and benefits overa chosen planning horizon, communities can demonstrate the cost-effectiveness of implementinggreen infrastructure projects. This guide does not compare costs between traditional gray and greeninfrastructure. It should also be noted that there is always a level of uncertainty associated with theuse of models and future flooding predictions; the models and predictive tools used here are intendedfor planning-scale levels of effort. More detailed analyses are recommended for site-specific greeninfrastructure design.KEY TERMSAcre-feet – A volumetric measurement of the number of acres covered by one-foot depth of water.Design storm – Examples of a design storm (also referred to as a storm event) are the 1-year, 24hour storm event, or the 100-year, 24-hour storm event. The year designation represents a recurrenceinterval and indicates the probability that a storm will occur during any given year. A 1-year stormhas a 100 percent chance of occurring in any given year. A 100-year storm has a 1 percent chance ofoccurring in any given year. The hour designation (e.g., 24-hour) is the assumed duration of the stormevent.Ecosystem services – A positive benefit (direct or indirect) that living and non-living components of theenvironment provide to a community.Flood-depth grid – A set of data points that shows the depth of flooding that will occur in a locationgiven a specific amount of precipitation.Green infrastructure (GI) – Stormwater management techniques and practices that mimic naturalhydrologic functions and incorporate landscape features to store or treat runoff. Green infrastructureincorporates the natural environment to provide multiple benefits and support resilient communities.Green infrastructure can include site-specific management practices as well as watershed-scaletechniques such as land preservation and the restoration of wetlands and floodplains that naturallystore water and reduce runoff.Hazus – Software package developed and freely distributed by the Federal Emergency ManagementAgency (FEMA) that estimates property (e.g., buildings) damages from natural disasters.Hydrology and hydraulics (H&H) – Hydrology is the study of water flow through the water cycle.Hydraulics is the study of water flow in channels and pipes. The combination of hydrology andhydraulics provides a complete look at how water behaves as it moves through the landscape anddrainage structures. H&H modeling predicts parameters such as peak flow, runoff volumes, velocities,and surface water flood elevations, which allow users to assess how water moves through a watershed.Peak discharge – The highest flow rate at a location for a specific precipitation event (usuallymeasured in cubic feet per second).3
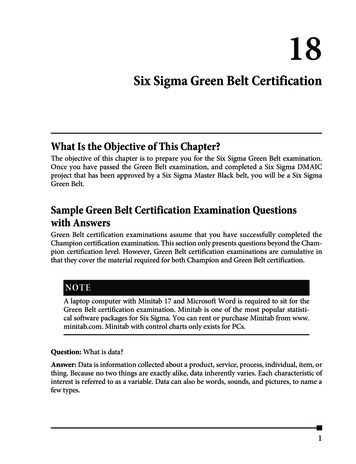
FrameworkSTEP 1:STEP 2:STEP 3:STEP 4:STEP 5:STEP 6:Define theFloodingProblemAssess y How aFlood ReductionTarget CanBe Metwith GreenInfrastructureAssess FloodingScenarioswith GreenInfrastructureEstimateBenefitsand CostsIdentify andCommunicatethe DesiredGreenInfrastructureStrategy1. Choose awatershed studyarea1. Gather data1. Select a floodreduction target2. Model currentand futureflooding2. Identify greeninfrastructureoptions1. Model currentand futureflooding if theflood reductiontarget is metwith greeninfrastructure1. Estimategreeninfrastructureoption unitcosts andstrategy cost1. Finalize agreeninfrastructurestrategy2. Characterizeflooding issuesand causes3. Determinewhat's at riskOutput:Definition ofthe problemand studyparameters43. Quantifycurrent andfuture flooddamagesOutput:Financialimpacts offlooding undercurrent andfuture scenarioswithout a greeninfrastructurestrategy3. Determinehow muchstorage thegreeninfrastructureoptions canprovide2. Quantifycurrent andfuture flooddamages if theflood reductiontarget is metwith ucturestrategy formeeting theflood reductiontargetOutput:Impacts offlooding undercurrent andfuture scenarioswith a greeninfrastructurestrategy2. Estimategreeninfrastructurestrategy benefitsand co-benefits2. Communicatethe greeninfrastructurestrategy andplan next steps3. Annualizecosts andbenefits over aspecific timeframeOutput:Annualized netbenefitsOutput:Implementationof greeninfrastructurestrategy
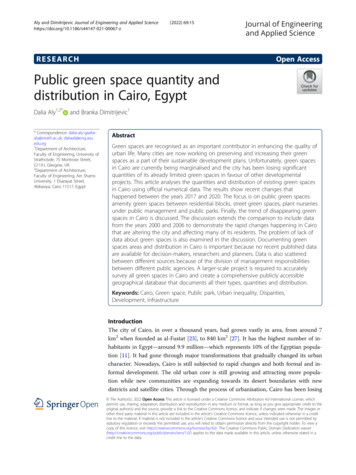
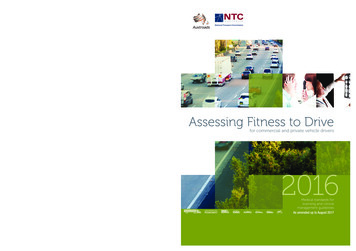
BackgroundThe steps outlined in this process guide were developed based on three pilot studies conducted inthe Great Lakes region and a community workshop conducted on the He‘eia watershed in Hawai‘i.The table below presents a summary of each study. Throughout the guide, case study examples fromthese locations illustrate steps and tasks of the process (for full case studies, see “Pilot Studies”).LOCATIONFLOODINGCHARACTERISTICSGREEN INFRASTRUCTUREOPTIONSCOSTS AND BENEFITSSilver CreekWatershed inToledo, Ohio Flat terrain Highly developed Frequent street and basementflooding during small (e.g., 2-year storm) events Mostly building andinfrastructure damage Bioswales Acquisition of tax-forfeitedland for flood storage Blue roofs Permeable pavement Retention ponds Widen drainage channels Redevelopment requirementsfor stormwater control/offsets 20-year horizon: damagesreduced by 700,000 ( 38,000annually) 50-year horizon: benefitsexceeded costs by 70,000 Benefits: limited to HazusChester CreekWatershed inDuluth, Minnesota Watershed divided bya steep bluff with flat,mostly undeveloped upperwatershed High velocity flash floodingin lower watershed as creekflows through narrow ravineduring large (e.g., 100-year)events Damages to infrastructure andrecreational assets Bioretention Blue roofs Permeable pavementsidewalks Underground storage Tree trenches Retention ponds Extended detention wetlands Open space preservation In-stream velocity-reduction Development/redevelopmentrequirements for stormwatercontrol/offsets 20-year horizon: damagesreduced by 1.63 million( 89,000 annually) 50-year horizon: benefitsexceeded costs by 490,000 Benefits: avoided damage toland, property, recreationalassets; avoided cost ofmaintaining stormwatersystemLower Fox River Hilly, largely agricultural andBasin in Green Bay,undeveloped watershedWisconsin Riverine overbank flooding High development potential Preserve flood-prone land inthe watershed Fee simple purchase Easements 15-year horizon: annualizedcosts of 0.5 to 5.1million depending on landconservation scenario Estimated benefits: 2.6million annually (Hazus)He‘eia Watershedin Oahu, Hawai‘i Restoration of ancient loikalo (taro patches) forflood mitigation, sedimentreduction, and food supply Removal of non-nativemangrove vegetation Restoration of wetlands Restoration of upland forest inthe headwaters Not yet assessed Headwaters receive largeamounts of rainfall High peak discharges Heavy sediment transport Impacts on coastal fishpondand coral reefs5
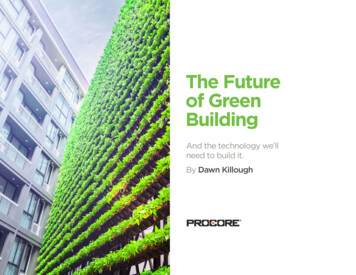
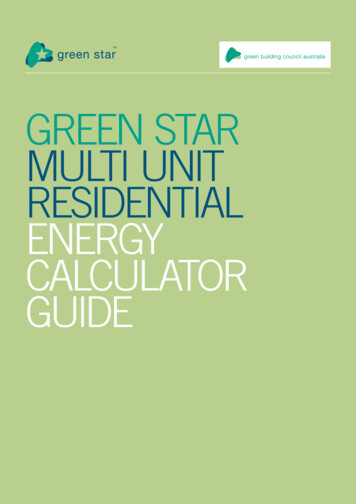
STEP 1: Define the Flooding ProblemStep 1 consists of three tasks for defining the problem and study parameters.In the first task you must decide where to focus efforts, so start by definingyour study area and the flooding problem. In the second task, you willdetermine the specific types of flooding problems and their causes. The thirdtask involves identifying who and what is affected by flooding.1. Choose awatershed studyarea2. Characterizeflooding issuesand causes3. Determinewhat's at riskOutput:Definition ofthe problemand studyparameters1. Gather data1. Select a floodreductiontargetTIPS FOR A SUCCESSFUL START1. Model current1. Estimateand futuregreenflooding if theinfrastructureflood reductionoption unit2.UnderstandModel currentearly on 2.whatyougreenhave and what you need in order to developIdentifytargetismetcosts andandimplementfutureanda successfulgreen infrastructure ngoptionsinfrastructure Hold a workshop with key stakeholders to kick-start discussions and2. Estimatebrainstorm ideas for the assessment.green dmomentum.2. QuantifyinfrastructureQuantify3. Determinecurrent and currentStay engagedwith stakeholdersstrategy benefitsandhow much throughout the process.future floodand co-benefitsfuture floodstorage thedamagesif theFromthe outset of Step 1greenand throughout stepsof theassessment process,damagesflood reductionAnnualizeit is critical to engage knowledgeabledifferentinfrastructure stakeholders who represent 3.targetismetcostsandperspectives (e.g., publicofficials,optionscan business groups, watershed, communitywithgreenbenefitsover aand user groups, and academia).provide They can contribute information, expertise,infrastructurespecifictimeand political support. Consider forming a work group (typically 10-20 people)frameto provide input and feedback for every step of the process. Communitybuy-in will be needed to implement solutions and to invest funds, so makesurethe right partners areengaged from the beginning.Output:Output:Output: Periodic communityOutput:briefingsfor the generalpublic are also recommended.FinancialPreliminaryImpacts ofAnnualized netimpacts ofgreenflooding underbenefitsStay focusedthe defined flooding currentproblemand set the assessmentfloodingunderon solvinginfrastructureandupfor successtasksresources and timelines.currentand by outliningstrategyforthat fit availablefuture scenariosResistscenarios“scope creep” bymeetingnoting goodcanbe integrated later on, asfuturethe ideas thatwitha greenwithouta greenflood reductioninfrastructureresourcesand time permit.infrastructuretargetstrategystrategyKey Question: What type of flooding problemis this assessment trying to solve?Key considerations: Clearly define the scope of the assessment (list costs and benefits you wantto consider, geographic area, time frame) Engage a proactive and interested group of assessment team participants,stakeholders, and members of the public with varied backgrounds Identify data, information, and expertise that you have and don’t have earlyon in the processRecommended expertise: Mapping and GISHydrology, engineering, stormwater managementPlanningKnowledge of the watershed(s)Flood management6 STEP 1: DEFINE THE FLOODING PROBLEM1. Fingrinfraststra2. Commtheinfraststrateplan neOuImplemof ginfraststra
TASK 1: Choose a watershed study areaUsing selection criteria (see the table below), pick a watershed with flooding problems for yourstudy area. Criteria can be used to rank multiple watersheds numerically (e.g., scale of 1-5) or moresubjectively (e.g., high, medium, low).SAMPLE CRITERIA FOR WATERSHED SELECTIONCriteriaConsiderationsCommunity interestAre there engaged stakeholders who have an interest in identifying and implementingsolutions in the watershed?Land useIs future land use (and change in impervious surfaces) likely to increase flooding? Are thereopportunities to shape future land use decisions?RestorationAre there any existing or planned restoration efforts, including drainage improvements orwetlands or open space plans that could be leveraged for green infrastructure?Economic factorsAre there significant costs associated with past flooding events? Are there highly valuedresources within the watershed (e.g., recreation, ecological resources, cultural heritage,fisheries, scenic, or other public values)?Land accessibility andownershipAre there sites where green infrastructure could be installed (roof tops of businesses/industries, publicly owned land, tax forfeit property, wetland expansion sites)? Does thecommunity have existing or potential easements in which green infrastructure could belocated?Historic flood damageAre the causes of historical flooding known and well documented?Water qualityAre there water quality issues (e.g., erosion/sedimentation, combined sewer overflows,temperature) that could benefit from green infrastructure?Existing greeninfrastructureAre there successful existing green infrastructure practices in the watershed that can beimplemented at a larger scale?Existing dataAre there good data and information available about the watershed that will be needed toconduct the assessment?TIP: Consider starting with a watershed that will significantly benefit from green infrastructure to show success.But be careful not to pick the most challenging watershed if capabilities are not in place to tackle the challenge!Select your study area by choosing one or more watersheds to assess based on the information youhave collected. Keep your stakeholders, timeline, and budget in mind when narrowing your focus.Conduct a gap analysis early in the process by developing an inventory of data that are needed vs.data that are available. Make all data accessible to stakeholders. Obtain or develop map(s) of yourwatershed that identify physical, hydrologic, political, and topographic features. It is critical to obtainenough information to fully understand the hydrology and hydraulics (H&H) of your watershed. Keepin mind that assessments may include watersheds that extend beyond municipal boundaries.STEP 1: DEFINE THE FLOODING PROBLEM 7
Toledo Case Study: In Toledo the 4,746-acre Silver Creek watershed was selected because futureland use was anticipated to change and there was information from a previous study that could beused to inform the assessment.Meet with stakeholders to brainstorm and discuss key data needs. Understanding the features of yourwatershed and the information that you have or don’t have will help you prioritize data-gatheringneeds and set realistic goals. Consider cost sharing, leveraging, and partnering among stakeholders toovercome budget challenges. Ensure that the flooding problem is clearly defined for all stakeholderswho may be approaching the assessment from different viewpoints.He‘eia Case Study: Stakeholders in the 2,800-acre He‘eia watershed met for a one-day workshopand successfully used this guide as a framework to brainstorm a green infrastructure watershedassessment. Participants identified the need for an information-sharing session to identify datagaps early in the process and more economic information on ecosystem services, which was themain driver in the He‘eia watershed.TASK 2: Characterize flooding issues and causesIdentify specific characteristics of flooding in your chosen watershed. Determine what type of floodingyou are experiencing.Duluth Case Study: Flooding in the 4,275-acre Chester Creek watershed was mostly due toinfrastructure inadequately conveying the volume of runoff flowing through it. Runoff volumessignificantly increased because of commercial development in headwater areas, which funneled intoa steep, narrow channel. The 100-year storm event was the chosen threshold for assessing damage. Overbank – Flooding that occurs when water overtops the banks of waterways.Flash – A major precipitation event that occurs quickly and overwhelms drainage capacity.Coastal – Flooding that occurs from storm surge, extreme waves, or high tide.Surface – Flooding that occurs when water ponds in flat, poorly drained, or low-lying areas.Groundwater – A rising water table that floods basements, without surface flooding.Identify the scenarios that cause flooding issues and what storm threshold causes flooding damage.Some communities experience flood damages only during 100-year storm events, while othersexperience flooding from smaller but more frequent storms. Consider the following to determine your“threshold” event: Does flooding typically occur after a certain amount of precipitation? Are citizen flooding complaints tracked? Is there a trend between complaints and the type of stormevent? Are there public works records describing when and where infrastructure damage occurs? Are thererecords of costs associated with flooding events? Does damage occur rarely during large storm events or frequently during small storm events?8 STEP 1: DEFINE THE FLOODING PROBLEM
Characterize the landscape and runoff patterns to understand how runoff moves through thewatershed and to identify potential problem areas. What are the land cover, topography, and other characteristics that impact flow? Where does the bulk of runoff originate? What are the impediments to flow (narrow channel, undersized culverts)?TASK 3: Determine what’s at riskIdentify community assets at risk in the watershed. Defining risks allows you to understand thedamages that can be monetized (e.g., structural damage, business closures) vs. those that will beharder to quantify (e.g., loss of access to a hiking trail). Be sure to capture risks that are unique to yourwatershed, including ecosystem services within the watershed. Understanding ecosystem servicesimpacted by flooding early on will strengthen the economic analysis in later steps.Duluth Case Study: Unique assets at risk within the Chester Creek Watershed included a historicsite and a park that provided year-round recreational benefits.Sample Assets and RisksASSETRISKBuildings and infrastructureDamage to and loss of roads, bridges, water/sewer/stormwater systems, sidewalks, andproperty and buildings, including residencesEcological resourcesSiltation, damage to and loss of habitat for fisheries and wildlifeLand and waterwaysErosion, scouring, mudslides, and associated property loss and damageBusinesses, schools, publicservices, and utilitiesDisruption, closures, power outages, utility damage, loss of service, loss of access,agriculture and aquaculture lossesRecreationLoss, damage, lack of access, closure of facilities, and damage to natural areasCultural assetsDamage to or loss of historical sites, cultural resources, tribal landsOUTPUT: Definition of the Problem and Study ParametersStudy AreaFlooding Issuesand CausesAssets at RiskProblem Identification andStudy ParametersAfter completing Step 1 you should have a clear sense of the flooding problem, project scope, focusarea, information that is needed vs. available, and assets at risk. The tasks in Step 1 form the basis forthe rest of the assessment, so it is important to be thorough and set your team up for success!TIP: Synthesize the information from Step 1 into a one-page information sheet to communicate the purpose andscope of the assessment to the public. Include examples of past successful green infrastructure projects.STEP 1: DEFINE THE FLOODING PROBLEM 9
Choose aershed studyareaCharacterizeoding issuesnd causesDeterminehat's at riskOutput:efinition ofe problemand studyarametersSTEP 2: Assess Flooding Scenarioswithout Green Infrastructure1. Gather data2. Model currentand futureflooding3. Quantifycurrent andfuture flooddamagesOutput:Financialimpacts offlooding undercurrent andfuture scenarioswithout a greeninfrastructurestrategyStep 2 establishes the “business as usual” scenario. It will help answer thequestion: What are the costs of flooding now and in the future if we don’timplement a green infrastructure strategy? Step 2 will model flooding andquantify flood damages within the watershed under current and future1.Selectfloodclimate 1.Model currentconditions.1. Estimate1. Finalize alandusea and(precipitation)Projecting future floodingreductiontargetandfuturegreengreenimpacts will help you understand and plan for the consequences of cipitation changes and future land use decisions.flood reductionoption unitstrategy2. Identify greentarget is metcosts andInthe first task, you will gather data to determine the current and futureinfrastructurewith greenstrategy costconditionsforoptions within the watershed. You will also designate the timeframe2. Communicateinfrastructureyour assessment and the type of storm events2. youwanttomodel.YouwillthegreenEstimateuse the data gathered for current and future landuse and precipitationin modelingforcurrentand2.Quantify and hydraulicsstrategyandinfrastructure3. Determinecurrentand s(e.g.,2-,10-,25-,plannextstepsstrategybenefitshow muchfuture flood50-,100-yeara range of impacts. In theand co-benefitsstoragethe storms) is recommended to providedamagesif thethirdgreentask, you will perform an economicanalysis that will quantify the costsfloodreduction3. Annualizeassociatedwith floodingundercurrent and futureconditions without re.determinewhich assets areoptions can The overall goal of this step is towithgreenbenefitsover anda future flooding.damagedprovideand the cost of those damages under currentinfrastructurespecific timeframeKey Question: What are flooding impacts now and intheOutput:future without a greeninfrastructure strategy?Output:Output:Output:PreliminaryImpacts ofAnnualized netImplementationgreenflooding underbenefitsof greenKeyconsiderations: current andinfrastructureinfrastructure Planningframe(at least 20 years, and preferably 50 years)strategystrategyfor horizon timefuturescenarios Currentmeetingtheand future precipitationwith a greenand land use and cover typefloodreductioninfrastructure Datainputs for successfulmodelingtargetstrategyRecommended expertise: Planners and local experts in land use, zoning, and mapping (greeninfrastructure) Economists Hydrologists, hydrology and hydraulics modelersTASK 1: Gather dataEstablish your assessment window by defining
Green infrastructure can include site-specific management practices as well as watershed-scale techniques such as land preservation and the restoration of wetlands and floodplains that naturally store water and reduce runoff. Hazus - Software package developed and freely distributed by the Federal Emergency Management