Transcription
5. Network SimulationIn this chapter we discuss methods and techniques to simulate the operations of computernetwork systems and network applications in the real-world environment. Simulation isone of the most widely used techniques in network design and management to predict theperformance of a network system or network application before the network is physicallybuilt or the application is rolled out.5.1. Types of simulation5.1.1. Systems, models, discrete-event simulationA network system is a set of network elements [1], such as routers, switches, links, users,and applications working together to achieve some tasks. The scope of a simulation studymay only be a system that is part of another system as in the case of subnetworks. The stateof a network system is the set of relevant variables and parameters that describe the systemat a certain time that comprise the scope of the study. For instance, if we are interested inthe utilization of a link, we want to know only the number of bits transmitted via the linkin a second and the total capacity of the link, rather than the amount of buffers available forthe ports in the switches connected by the link.Instead of building a physical model of a network, we build a mathematical model representing the behaviour and the logical and quantitative relations between network elements.By changing the relations between network elements, we can analyse the model withoutconstructing the network physically, assuming that the model behaves similarly to the realsystem, i.e., it is a valid model. For instance, we can calculate the utilization of a link analytically, using the formula U D/T , where D is the amount of data sent at a certain time andT is the capacity of the link in bits per second. This is a very simple model that is very rare inreal world problems. Unfortunately, the majority of real world problems are too complex toanswer questions using simple mathematical equations. In highly complex cases simulationtechnique is more appropriate.Simulation models can be classi ed in many ways. The most common classi cationsare as follows: Static and dynamic simulation models: A static model characterizes a system independently of time. A dynamic model represents a system that changes over time. Stochastic and deterministic models: If a model represents a system that includes random elements, it is called a stochastic model. Otherwise it is deterministic. Queueing
1625. Network Simulationsystems, the underlying systems in network models, contain random components, suchas arrival time of packets in a queue, service time of packet queues, output of a switchport, etc. Discrete and continuous models: A continuous model represents a system with state variables changing continuously over time. Examples are differential equations that de nethe relationships for the extent of change of some state variables according to the changeof time. A discrete model characterizes a system where the state variables change instantaneously at discrete points in time. At these discrete points in time some event orevents may occur, changing the state of the system. For instance, the arrival of a packetat a router at a certain time is an event that changes the state of the port buffer in therouter.In our discussion, we assume dynamic, stochastic, and discrete network models. Werefer to these models as discrete-event simulation models.Due to the complex nature of computer communications, network models tend to becomplex as well. The development of special computer programs for a certain simulationproblem is a possibility, but it may be very time consuming and inefficient. Recently, theapplication of simulation and modeling packages has become more customary, saving coding time and allowing the modeler to concentrate on the modeling problem in hand insteadof the programming details. At rst glance, the use of such network simulation and modeling packages, as COMNET, OPNET, etc., creates the risk that the modeler has to rely onmodeling techniques and hidden procedures that may be proprietary and may not be available to the public. In the following sections we will discuss the simulation methodology onhow to overcome the fear of this risk by using validation procedures to make sure that thereal network system will perform the same way as it has been predicted by the simulationmodel.5.2. The need for communications network modeling andsimulation5.2.1. Simulation versus emulationIn a world of more and more data, computers, storage systems, and networks, the designand management of systems are becoming an increasingly challenging task. As networksbecome faster, larger, and more complex, traditional static calculations are no longer reasonable approaches for validating the implementation of a new network design and multimillion dollar investments in new network technologies. Complex static calculations andspreadsheets are not appropriate tools any more due to the stochastic nature of networktraffic and the complexity of the overall system.Organizations depend more and more on new network technologies and network applications to support their critical business needs. As a result, poor network performance mayhave serious impacts on the successful operation of their businesses. In order to evaluatethe various alternative solutions for a certain design goal, network designers increasinglyrely on methods that help them evaluate several design proposals before the nal decision ismade and the actual systems is built. A widely accepted method is performance predictionthrough simulation. A simulation model can be used by a network designer to analyse de-
5.2. The need for communications network modeling and simulation163sign alternatives and study the behaviour of a new system or the modi cations to an existingsystem without physically building it. A simulation model can also represent the networktopology and tasks performed in a network in order to obtain statistical results about thenetwork's performance.It is important to understand the difference between simulation and emulation. The purpose of emulation is to mimic the original network and reproduce every event that happensin every network element and application. In simulation, the goal is to generate statistical results that represent the behaviour of certain network elements and their functions. Indiscrete event simulation, we want to observe events as they happen over time, and collectperformance measures to draw conclusions on the performance of the network, such as linkutilizations, response times, routers' buffer sizes, etc.Simulation of large networks with many network elements can result in a large modelthat is difficult to analyse due to the large amount of statistics generated during simulation.Therefore, it is recommended to model only those parts of the network which are signi cantregarding the statistics we are going to obtain from the simulation. It is crucial to incorporateonly those details that are signi cant for the objectives of the simulation. Network designerstypically set the following objectives: Performance modeling: Obtain statistics for various performance parameters of links,routers, switches, buffers, response time, etc. Failure analysis: Analyse the impacts of network element failures.Network design: Compare statistics about alternative network designs to evaluate therequirements of alternative design proposals. Network resource planning: Measure the impact of changes on the network's performance, such as addition of new users, new applications, or new network elements.Depending on the objectives, the same network might need different simulation models.For instance, if the modeler wants to determine the overhead of a new service of a protocolon the communication links, the model's links need to represent only the traffic generated by the new service. In another case, when the modeler wants to analyse the responsetime of an application under maximum offered traffic load, the model can ignore the trafficcorresponding to the new service of the protocol analysed in the previous model.Another important question is the granularity of the model, i.e., the level of details atwhich a network element is modeled. For instance, we need to decide whether we want tomodel the internal architecture of a router or we want to model an entire packet switchednetwork. In the former case, we need to specify the internal components of a router, thenumber and speed of processors, types of buses, number of ports, amount of port buffers,and the interactions between the router's components. But if the objective is to analyse theapplication level end-to-end response time in the entire packet switched network, we would specify the types of applications and protocols, the topology of the network and linkcapacities, rather then the internal details of the routers. Although the low level operationsof the routers affect the overall end-to-end response time, modeling the detailed operationsdo not signi cantly contribute to the simulation results when looking at an entire network.Modeling the details of the routers' internal operations in the order of magnitude of nanoseconds does not contribute signi cantly to the end-to-end delay analysis in the higher orderof magnitude of microseconds or seconds. The additional accuracy gained from higher model granularity is far outweighed by the model's complexity and the time and effort required
1645. Network Simulationby the inclusion of the routers' details.Simpli cation can also be made by applying statistical functions. For instance, modeling cell errors in an ATM network does not have to be explicitly modeled by a communication link by changing a bit in the cell's header, generating a wrong CRC at the receiver.Rather, a statistical function can be used to decide when a cell has been damaged or lost.The details of a cell do not have to be speci ed in order to model cell errors.These examples demonstrate that the goal of network simulation is to reproduce thefunctionality of a network pertinent to a certain analysis, not to emulate it.5.3. Types of communications networks, modeling constructsA communications network consists of network elements, nodes (senders and receivers) andconnecting communications media. Among several criteria for classifying networks we usetwo: transmission technology and scale. The scale or distance also determines the techniqueused in a network: wireline or wireless. The connection of two or more networks is calledinternetwork. The most widely known internetwork is the Internet.According to transmission technology we can broadly classify networks as broadcastand point-to-point networks: In broadcast networks a single communication channel is shared by every node. Nodescommunicate by sending packets or frames received by all the other nodes. The address eld of the frame speci es the recipient or recipients of the frame. Only the addressedrecipient(s) will process the frame. Broadcast technologies also allow the addressing ofa frame to all nodes by dedicating it as a broadcast frame processed by every node in thenetwork. It is also possible to address a frame to be sent to all or any members of onlya group of nodes. The operations are called multicasting and any casting respectively. Point-to-point networks consist of many connections between pairs of nodes. A packetor frame sent from a source to a destination may have to rst traverse intermediatenodes where they are stored and forwarded until it reaches the nal destination.Regarding our other classi cation criterion, the scale of the network, we can classifynetworks by their physical area coverage: Personal area networks (PANs) support a person's needs. For instance, a wireless network of a keyboard, a mouse, and a personal digital assistant (PDA) can be consideredas a PAN. Local area networks (LANs), typically owned by a person, department, a smaller organization at home, on a single oor or in a building, cover a limited geographic area. LANsconnect workstations, servers, and shared resources. LANs can be further classi ed based on the transmission technology, speed measured in bits per second, and topology.Transmissions technologies range from traditional 10Mbps LANs to today's 10GbpsLANs. In terms of topology, there are bus and ring networks and switched LANs. Metropolitan area networks (MANs) span a larger area, such as a city or a suburb. Awidely deployed MAN is the cable television network distributing not just one-way TVprograms but two-way Internet services as well in the unused portion of the transmissionspectrum. Other MAN technologies are the Fiber Distributed Data Interface (FDDI)
5.3. Types of communications networks, modeling constructs165and IEEE wireless technologies as discussed below. Wide area networks (WANs) cover a large geographical area, a state, a country or evena continent. A WAN consists of hosts (clients and servers) connected by subnets ownedby communications service providers. The subnets deliver messages from the sourcehost to the destination host. A subnet may contain several transmission lines, each oneconnecting a pair of specialized hardware devices called routers. Transmission lines aremade of various media; copper wire, optical ber, wireless links, etc. When a messageis to be sent to a destination host or hosts, the sending host divides the message intosmaller chunks, called packets. When a packet arrives on an incoming transmissionline, the router stores the packet before it selects an outgoing line and forwards thepacket via that line. The selection of the outgoing line is based on a routing algorithm.The packets are delivered to the destination host(s) one-byone where the packets arereassembled into the original message.Wireless networks can be categorized as short-range radio networks, wireless LANs,and wireless WANs. In short range radio networks, for instance Bluetooth, various components, digital cameras, Global Positioning System (GPS) devices, headsets, computers, scanners, monitors, and keyboards are connected via short-range radio connections within 20- 30feet. The components are in primary-secondary relation. The main system unit, the primary component, controls the operations of the secondary components. The primarycomponent determines what addresses the secondary devices use, when and on whatfrequencies they can transmit. A wireless LAN consists of computers and access points equipped with a radio modemand an antenna for sending and receiving. Computers communicate with each other directly in a peer-to-peer con guration or via the access point that connects the computersto other networks. Typical coverage area is around 300 feet. The wireless LAN protocols are speci ed under the family of IEEE 802.11 standards for a range of speed from11 Mbps to 108 Mbps. Wireless WANs comprise of low bandwidth and high bandwidth networks. The lowbandwidth radio networks used for cellular telephones have evolved through three generations. The rst generation was designed only for voice communications utilizinganalog signaling. The second generation also transmitted only voice but based on digital transmission technology. The current third generation is digital and transmits bothvoice and data at most 2Mbps. Fourth and further generation cellular systems are underdevelopment. High-bandwidth WANs provides high-speed access from homes and businesses bypassing the telephone systems. The emerging IEEE 802.16 standard deliversservices to buildings, not mobile stations, as the IEEE 802.11 standards, and operatesin much higher 10-66 GHz frequency range. The distance between buildings can beseveral miles. Wired or wireless home networking is getting more and more popular connecting various devices together that can be accessible via the Internet. Home networks mayconsists of PCs, laptops, PDAs, TVs, DVDs, camcorders, MP3 players, microwaves,refrigerator, A/C, lights, alarms, utility meters, etc. Many homes are already equippedwith high-speed Internet access (cable modem, DSL, etc.) through which people candownload music and movies on demand.
1665. Network SimulationThe various components and types of communications networks correspond to the modeling constructs and the different steps of building a simulation model. Typically, a networktopology is built rst, followed by adding traffic sources, destinations, workload, and settingthe parameters for network operation. The simulation control parameters determine the experiment and the running of the simulation. Prior to starting a simulation various statisticsreports can be activated for analysis during or after the simulation. Statistical distributionsare available to represent speci c parameterizations of built-in analytic distributions. As themodel is developed, the modeler creates new model libraries that can be reused in othermodels as well.5.4. Performance targets for simulation purposesIn this section we discuss a non-exhausting list of network attributes that have a profoundeffect on the perceived network performance and are usual targets of network modeling.These attributes are the goals of the statistical analysis, design, and optimization of computer networks. Fundamentally, network models are constructed by de ning the statisticaldistribution of the arrival and service rate in a queueing system that subsequently determinesthese attributes. Link capacityChannel or link capacity [3,4] is the number of messages per unit time handled by alink. It is usually measured in bits per second. One of the most famous of all results ofinformation theory is Shannon's channel coding theorem:For a given channel there exists a code that will permit the error-free transmission across the channel at a rate R,provided R C, where Cis the channel capacity. Equality is achieved only when theSignal-to-noise Ratio (SNR) is in nite. See more details on Information and CodingTheory in [5]. BandwidthBandwidth is the difference between the highest and lowest frequencies available fornetwork signals. Bandwidth is also a loose term used to describe the throughput capacityof a speci c link or protocol measured in Kilobits, Megabits, Gigabits, Terabits, etc., ina second. Response timeThe response time is the time it takes a network system to react to a certain source'sinput. The response time includes the transmission time to the destination, the processing time at both the source and destination and at the intermediate network elementsalong the path, and the transmission time back to the source. Average response time isan important measure of network performance. For users, the lower the response timethe better. Response time statistics (mean and variation) should be stationary; it shouldnot dependent on the time of the day. Note that low average response time does notguarantee that there are no extremely long response times due to network congestions. LatencyDelay or latency is the amount of time it takes for a unit of data to be transmitted acrossa network link. Latency and bandwidth are the two factors that determine the speed
5.4. Performance targets for simulation purposes167of a link. It includes the propagation delay (the time taken for the electrical or opticalsignals to travel the distance between two points) and processing time. For instance,the latency, or round-time delay between a ground station of a satellite communicationlink and back to another ground station (over 34,000 km each way) is approximately270 milliseconds. The round-time delay between the east and west coast of the USis around 100 ms, and transglobal is about 125 ms. The end-to-end delay of a datapath between source and destination spanning multiple segments is affected not onlyby the media' signal speed, but also by the network devices, routers, switches along theroute that buffer, process, route, switch, and encapsulate the data payload. Erroneouspackets and cells, signal loss, accidental device and link failures and overloads canalso contribute to the overall network delay. Bad cells and packets force retransmissionfrom the initial source. These packets are typically dropped with the expectation of alater retransmission resulting in slowdowns that cause packets to over ow buffers. Routing protocolsThe route is the path that network traffic takes from the source to the destination. Thepath in a LAN is not a critical issue because there is only one path from any source toany destination. When the network connects several enterprises and consists of severalpaths, routers, and links, nding the best route or routes becomes critical. A route maytraverse through multiple links with different capacities, latencies, and reliabilities. Routes are established by routing protocols. The objective of the routing protocols is to ndan optimal or near optimal route between source and destination avoiding congestions. Traffic engineeringA new breed of routing techniques is being developed using the concept of traffic engineering. Traffic engineering implies the use of mechanisms to avoid congestion byallocating network resources optimally, rather than continually increasing network capacities. Traffic engineering is accomplished by mapping traffic ows to the physicalnetwork topology along predetermined paths. The optimal allocation of the forwardingcapacities of routers and switches are the main target of traffic engineering. It providesthe ability to diverge traffic ows away from the optimal path calculated by the traditional routing protocols into a less congested area of the network. The purpose of trafficengineering is to balance the offered load on the links, routers, and switches in a waythat none of these network elements is over or under utilized. Protocol overheadProtocol messages and application data are embedded inside the protocol data units,such as frames, packets, and cells. A main interest of network designers is the overheadof protocols. Protocol overhead concerns the question: How fast can we really transmitusing a given communication path and protocol stack, i.e., how much bandwidth is leftfor applications? Most protocols also introduce additional overhead associated with inband protocol management functions. Keep-alive packets, network alerts, control andmonitoring messages, poll, select, and various signaling messages are transmitted alongwith the data streams. BurstinessThe most dangerous cause of network congestion is the burstiness of the network traf c. Recent results make evident that high-speed Internet traffic is more bursty and itsvariability cannot be predicted as assumed previously. It has been shown that network
1685. Network Simulationtraffic has similar statistical properties on many time scales. Traffic that is bursty onmany or all time scales can be described statistically using the notion of long-range dependency [6, 7, and 8]. Long-range dependent traffic has observable bursts on all timescales. One of the consequences is that combining the various ows of data, as it happens in the Internet, does not result in the smoothing of traffic. Measurements of localand wide area network traffic have proven that the widely used Markovian process models cannot be applied for today's network traffic. If the traffic were Markovian process,the traffic's burst length would be smoothed by averaging over a long time scale, contradicting the observations of today's traffic characteristics. The harmful consequencesof bursty traffic will be analysed in a case study in Section 5.9. Frame sizeNetwork designers are usually worried about large frames because they can ll up routers' buffers much faster than smaller frames resulting in lost frames and retransmissions. Although the processing delay for larger frames is the same as for smaller ones,i.e., larger packets are seemingly more efficient, routers and switches can process internal queues with smaller packets faster. Larger frames are also target for fragmentationby dividing them into smaller units to t in the Maximum Transmission Unit (MTU).MTU is a parameter that determines the largest datagram than can be transmitted by anIP interface. On the other hand, smaller frames may create more collision in an Ethernetnetwork or have lower utilization on a WAN link. Dropped packet ratePackets may be dropped by the data link and network layers of the OSI architecture. Thetransport layer maintains buffers for unacknowledged packets and retransmits them toestablish an error-free connection between sender and receiver. The rate of droppingpackets at the lower layers determines the rate of retransmitting packets at the transportlayer. Routers and switches may also drop packets due to the lack of internal buffers.Buffers ll up quicker when WAN links get congested which causes timeouts and retransmissions at the transport layer. The TCP's slow start algorithm tries to avoid congestions by continually estimating the round-trip propagation time and adjusting thetransmission rate according to the measured variations in the roundtrip time [11].5.5. Traffic characterizationCommunications networks transmit data with random properties. Measurements of networkattributes are statistical samples taken from random processes, for instance, response time,link utilization, interarrival time of messages, etc. In this section we review basic statisticsthat are important in network modeling and performance prediction. After a family of statistical distributions has been selected that corresponds to a network attribute under analysis,the next step is to estimate the parameters of the distribution. In many cases the sample average or mean and the sample variance are used to estimate the parameters of a hypothesizeddistribution. Advanced software tools include the computations for these estimates. Themean is interpreted as the most likely value about which the samples cluster. The followingequations can be used when discrete or continues raw data available. Let X1 , X2 , . . . , Xn aresamples of size n. The mean of the sample is de ned by
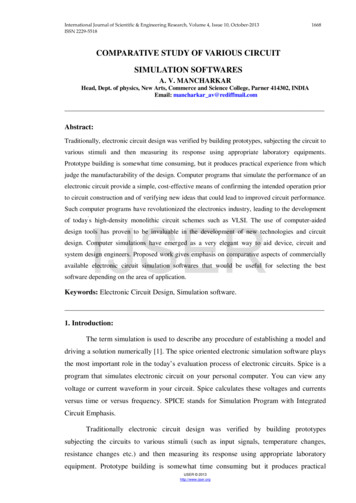
1695.5. Traffic s)Poissonαα exponencialλλ 1/Xuniformb bnormalµ, σ2µ X22σ SX ((n 1)/n)[max(X)] (unbiased)(unbiased)Figure 5.1. Estimation of the parameters of the most common distributions.PnXThe sample variance S2i 1 Xin.is de ned byPnS2 i 1Xin2 nX2. 1If the data are discrete and grouped in a frequency distribution, the equations above aremodi ed askPX kPS2 j 1j 1f jX j,nf jX jn2 nX 12,where k is the number of different values of X and f j is the frequency of the value X j of X.2The standard deviation S is the square root of the variance S .The variance and standard deviation show the deviation of the samples around the meanvalue. Small deviation from the mean demonstrates a strong central tendency of the samples.Large deviation reveals little central tendency and shows large statistical randomness.Numerical estimates of the distribution parameters are required to reduce the family ofdistributions to a single distribution and test the corresponding hypothesis. Table 5.1 from[12] describes estimators for the most common distributions occurring in network modeling.Ifα denotes a parameter, the estimator is denoted by α . Except for an adjustment to removeσ2 for the normal distribution and in the estimate of b of the uniformbias in the estimates ofdistribution, these estimators are the maximum likelihood estimators based on the sampledata.Probability distributions describe the random variations that occur in the real world [13,14]. Although we call the variations random, randomness has different degrees; the differentdistributions correspond to how the variations occur. Therefore, different distributions areused for different simulation purposes. Probability distributions are represented by probability density functions. Probability density functions show how likely a certain value is.Cumulative density functions give the probability of selecting a number at or below a certain value. For example, if the cumulative density function value at 1 was equal to 0.85, then85% of the time, selecting from this distribution would give a number less than 1. The value
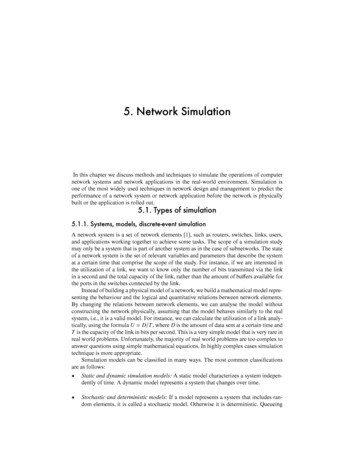
1705. Network SimulationNormal(1, standard deviation, x)2.001.80std. dev. 0.21.601.401.201.000.80std. dev. 0.40.600.40std. dev. gure 5.2. An example Normal distributionof a cumulative density function at a point is the area under the corresponding probabilitydensity curve to the left of that value. Since the total area under the probability densityfunction curve is equal to one, cumulative density functions converge to one as we movetoward the positive direction. In most of the modeling cases, the modeler does not need toknow all details to build a simulation model successfully. He or she has only to know whichdistribution is the most appropriate one for the case.Below, we summarize the most common statistical distributions based on [12, 14, and15]. We use the simulation modeling tool COMNET [14] to depict the respective probabilitydensity functions (PDF). From the practical point of view, a PDF can be approximated by ahistogram with all the frequencies of occurrences converted into probabilities. Normal distributionIt typically models the distribution of a compound process that can be described asthe sum of a number of component processes. For instance, the time to transfer a le(response time) sent over the network is the sum of times required to send the individualblocks making up the le. In modeling tools the Normal distribution function takes twopositive, real numbers: mean and standard deviation. It returns a positive, real number.The stream parameter x speci es which random number stream will be used to providethe sample. It is also often used to model message sizes. For example, a message couldbe described with mean size of 20,000 bytes and a s
Simulation is one of the most widely used techniques in network design and management to predict the performance of a network system or network application before the network is physically built or the application is rolled out. 5.1. Types of simulation 5.1.1. Systems, models, discrete-event simulation