Transcription
Consumer Security Products PerformanceBenchmarks (Edition 2)Antivirus & Internet SecurityWindows 10January sumer Security Products Performance Benchmarks (Edition 2)J. Han, D. WrenPassMark Software13 January 20202Consumer Security Products Performance Benchmarks 2020 Ed 2.docx
Consumer Security Performance Benchmarks 2019PassMark SoftwareTable of ContentsTABLE OF CONTENTS. 2REVISION HISTORY. 3REFERENCES. 3EXECUTIVE SUMMARY . 4OVERALL SCORE . 5PRODUCTS AND VERSIONS . 6PERFORMANCE METRICS SUMMARY . 7TEST RESULTS . 11BENCHMARK 1 – BOOT TIME (SECONDS) . 11BENCHMARK 2 – SCAN TIME (SECONDS) . 12BENCHMARK 3 – USER INTERFACE LAUNCH TIME (MILLISECONDS) . 13BENCHMARK 4 – MEMORY USAGE DURING SYSTEM IDLE (MEGABYTES) . 14BENCHMARK 5 – MEMORY USAGE DURING INITIAL SCAN (MEGABYTES) . 15BENCHMARK 6 – BROWSE TIME (SECONDS). 16BENCHMARK 7 – EDGE LAUNCH TIME (MILLISECONDS) . 17BENCHMARK 8 – INSTALLATION TIME (SECONDS) . 18BENCHMARK 9 – INSTALLATION SIZE (MEGABYTES) . 19BENCHMARK 10 – FILE COPY, MOVE AND DELETE (SECONDS). 20BENCHMARK 11 –THIRD-PARTY APPLICATIONS INSTALLATION TIME (SECONDS) . 21BENCHMARK 12 – NETWORK THROUGHPUT (SECONDS) . 22BENCHMARK 13 – FILE FORMAT CONVERSION (SECONDS). 23BENCHMARK 14 – FILE COMPRESSION AND DECOMPRESSION (SECONDS). 24BENCHMARK 15 – FILE DOWNLOAD (SECONDS) . 25BENCHMARK 16 – PE SCAN TIME (SECONDS) . 26BENCHMARK 17 – FILE COPY DISK TO DISK (SECONDS) . 27BENCHMARK 18 – FILE COPY OVER NETWORK (SECONDS) . 28BENCHMARK 19 – PCMARK 8 HOME SCORE . 29BENCHMARK 20 – WORD DOCUMENT LAUNCH AND OPEN TIME (MILLISECONDS) . 30BENCHMARK 21 – RUN EXCEL MACRO (SECONDS) . 31BENCHMARK 22 – SAVE WORD DOCUMENT TO PDF (SECONDS) . 32BENCHMARK 23 – USB 3.0 FILE COPY (SECONDS) . 33DISCLAIMER AND DISCLOSURE . 34CONTACT DETAILS . 34APPENDIX 1 – TEST ENVIRONMENT . 35APPENDIX 2 – METHODOLOGY DESCRIPTION . 36Performance BenchmarkEdition 2Page 2 of 4713 January 2020
Consumer Security Performance Benchmarks 2019PassMark SoftwareRevision HistoryRevRevision HistoryDateEdition 1Initial version of report28 October 2019Edition 2Updated list of products13 January 2020ReferencesRef #1DocumentWhat Really Slows Windows Down (URL)Performance BenchmarkEdition 2AuthorO. Warner,The PC SpyDate2006Page 3 of 4713 January 2020
Consumer Security Performance Benchmarks 2019PassMark SoftwareExecutive SummaryPassMark Software conducted objective performance testing on fifteen (15) security products. This reportpresents our results and findings as a result of performance benchmark testing conducted on these products.For more details on which versions were tested, please see the section “Products and Versions”.Testing included twenty-three (23) performance metrics. These performance metrics are as follows: Boot Time Scan Time User Interface Launch Time Memory Usage during System Idle Memory Usage during Initial Scan Browse Time Edge Launch Time Installation Time Installation Size File Copy, Move and Delete Third-Party Applications Installation Time Network Throughput File Format Conversion File Compression and Decompression PE Scan Time File Copy Disk to Disk File Copy Over Network File Download PCMark 8 Home Score Word Document Launch and Open Time Run Excel Macro Save Word Document as PDF USB 3.0 File CopyPerformance BenchmarkEdition 2Page 4 of 4713 January 2020
Consumer Security Performance Benchmarks 2019PassMark SoftwareOverall ScorePassMark Software assigned every product a score depending on its ranking in each metric compared to otherproducts in the same category.Security SoftwareIn the following table the highest possible score attainable is 345; in a hypothetical situation where a product hasattained first place in all 23 metrics. Security products have been ranked by their overall scores:Performance BenchmarkEdition 2Product NameOverall ScoreNorton Security272Kaspersky Internet Security233ESET Internet Security230G DATA Internet Security218Panda Dome Essential205F-Secure SAFE194McAfee Total Protection189Windows Defender180Trend Micro Internet Security165Trend Micro Virus Buster165AVG Internet Security160Avast Internet Security154Avira Internet Security140Bitdefender Internet Security123SourceNext ZERO Super Security115Page 5 of 4713 January 2020
Consumer Security Performance Benchmarks 2019PassMark SoftwareProducts and VersionsThe names and versions of the 15 security products tested are as follows:ManufacturerProduct NameRelease YearProduct VersionDate TestedSymantec CorporationNorton Security201922.19.9.63Dec 2019Avast Software s.r.o.AVG Internet Security201919.6.3098Jul 2019SourceNext CorporationSourceNext ZERO Super Security201923.0.19.85Jul 2019ESET, spol. s r.o.ESET Internet Security201912.1.34.0Jul 2019Trend Micro Inc.Trend Micro Internet Security201916.0.1146Oct 2019Trend Micro Inc.Trend Micro Virus Buster201915.0.1231Aug 2019Kaspersky LabKaspersky Internet Security201920.0.14.1085(c)Jul 2019Avast Software s.r.o.Avast Internet Security201919.6.2383Jul 2019Microsoft CorporationWindows Defender20194.18.1909.6Oct 2019BitdefenderBitdefender Internet Security201924.0.6.31Sep 2019F-Secure ConsultingF-Secure SAFE201917.7Dec 2019McAfeeMcAfee Total Protection201916.0 R20Dec 2019Avira Operations GmbHAvira Internet Security201915.0.1912.1683Dec 2019G DATA CyberDefense AGG DATA Internet Security201925.5.5.43Dec 2019Panda SecurityPanda Dome Essential201920.00.00Dec 2019Performance BenchmarkEdition 2Page 6 of 4713 January 2020
Consumer Security Performance Benchmarks 2019PassMark SoftwarePerformance Metrics SummaryWe have selected a set of objective metrics which provide a comprehensive and realistic indication of the areas inwhich a security product may impact system performance for end users. Our metrics test the impact of the securitysoftware on common tasks that end-users would perform on a daily basis.All of PassMark Software’s test methods can be replicated by third parties using the same environment to obtainsimilar benchmark results. Detailed descriptions of the methodologies used in our tests are available as “Appendix2 – Methodology Description” of this report.Benchmark 1 – Boot TimeThis metric measures the amount of time taken for the machine to boot into the operating system. Securitysoftware is generally launched at Windows startup, adding an additional amount of time and delaying the startupof the operating system. Shorter boot times indicate that the application has had less impact on the normaloperation of the machine.Benchmark 2 – Scan TimeAll security solutions have functionality designed to detect viruses and various other forms of malware by scanningfiles on the system. This metric measures the amount of time required to scan a set of clean files. Our sample fileset comprises a total file size of 982 MB and is made up of files that would typically be found on end-user machines,such as media files, system files and Microsoft Office documents.Benchmark 3 – User Interface Launch TimeThis metric provides an objective indication as to how responsive a security product appears to the user, bymeasuring the amount of time it takes for the user interface of the security software to launch from Windows. Toallow for caching effects by the operating system, both the initial launch time and the subsequent launch timesare measured. Our final result is an average of these two measurements.Benchmark 4 – Memory Usage during System IdleThis metric measures the amount of memory (RAM) used by the product while the machine and security softwareare in an idle state. The total memory usage is calculated by identifying all security software processes and theamount of memory used by each process.The amount of memory used while the machine is idle provides a good indication of the amount of systemresources being consumed by the security software on a permanent basis. Better performing products occupy lessmemory while the machine is idle.Benchmark 5 – Memory Usage during Initial ScanThis metric measures the amount of memory (RAM) used by the product during an initial security scan. The totalmemory usage is calculated by identifying all security software processes and the amount of memory used by eachprocess during the scan.Performance BenchmarkEdition 2Page 7 of 4713 January 2020
Consumer Security Performance Benchmarks 2019PassMark SoftwareBenchmark 6 – Browse TimeIt is common behavior for security products to scan data for malware as it is downloaded from the internet orintranet. This behavior may negatively impact browsing speed as products scan web content for malware. Thismetric measures the time taken to browse a set of popular internet sites to consecutively load from a local serverin a user’s browser window.Benchmark 7 – Edge Launch TimeThis metric is one of many methods to objectively measure how much a security product impacts on theresponsiveness of the system. This metric measures the amount of time it takes to launch the user interface ofMicrosoft Edge. To allow for caching effects by the operating system, both the initial launch time and thesubsequent launch times are measured. Our final result is an average of these two measurements.Benchmark 8 – Installation TimeThe speed and ease of the installation process will strongly influence the user’s first impression of the securitysoftware. This test measures the minimum installation time required by the security software to be fully functionaland ready for use by the end user. Lower installation times represent security products which are quicker for auser to install.Benchmark 9 – Installation SizeIn offering new features and functionality to users, security software products tend to increase in size with eachnew release. Although new technologies push the size limits of hard drives each year, the growing disk spacerequirements of common applications and the increasing popularity of large media files (such as movies, photosand music) ensure that a product's installation size will remain of interest to home users.This metric aims to measure a product’s total installation size. This metric is defined as the total disk spaceconsumed by all new files added during a product's installation.Benchmark 10 – File Copy, Move and DeleteThis metric measures the amount of time taken to move, copy and delete a sample set of files. The sample file setcontains several types of file formats that a Windows user would encounter in daily use. These formats includedocuments (e.g. Microsoft Office documents, Adobe PDF, Zip files, etc.), media formats (e.g. images, movies andmusic) and system files (e.g. executables, libraries, etc.).Benchmark 11 –Third-Party Applications Installation TimeThis metric measures the amount of time taken to install and uninstall third-party programs. The installation speedof third-party applications may be impacted by security behavior such as heuristics or real time malware scanning.Performance BenchmarkEdition 2Page 8 of 4713 January 2020
Consumer Security Performance Benchmarks 2019PassMark SoftwareBenchmark 12 – Network ThroughputThe metric measures the amount of time taken to download a variety of files from a local server using theHypertext Transfer Protocol (HTTP), which is the main protocol used on the web for browsing, linking and datatransfer. Files used in this test include file formats that users would typically download from the web, such asimages, archives, music files and movie files.Benchmark 13 – File Format ConversionThis test measures the amount of time taken to convert an MP3 file to a WAV and subsequently, convert the sameMP3 file to a WMA format.Benchmark 14 – File Compression and DecompressionThis metric measures the amount of time taken to compress and decompress different types of files. Files formatsused in this test include documents, movies and images.Benchmark 15 – File DownloadThis test measures the amount of time taken to download a set of setup files from a local server using theHypertext Transfer Protocol (HTTP). The data set comprises a total file size of 290MB, and the formats used includeexecutables and Microsoft installation packages.Benchmark 16 – PE Scan TimeAll security solutions have functionality designed to detect viruses and various other forms of malware by scanningfiles on the system. This metric measures the amount of time required to scan a set of PE (Portable Executable)files. Our sample file set comprises a total file size of 2.03GB and consisted of .exe (329MB), .dll (920MB) and .sysfiles (827MB).Benchmark 17 – File Copy Disk to DiskThis test measures the amount of time taken to copy files between two local drives. The data set comprises a totalfile size of 5.44GB, and the formats used include documents, movies, images and executables.Benchmark 18 – File Copy Over NetworkThis test measures the amount of time taken to copy files from a local drive to a local server. The data set comprisesa total file size of 5.44GB, and the formats used included documents, movies, images and executables.Benchmark 19 – PCMark 8 Home ScoreThis test measures the overall performance as an overall score over a range of areas, including memory, video,gaming, music, communications, productivity and HDD performance.Performance BenchmarkEdition 2Page 9 of 4713 January 2020
Consumer Security Performance Benchmarks 2019PassMark SoftwareBenchmark 20– Word Document Launch and Open TimeThis test measures how much security software impacts on the responsiveness and performance of the system.This metric measures the amount of time it takes to open a large, mixed media document with Microsoft Word.To allow for caching effects by the operating system, both the initial launch time and the subsequent launch timesare measured. Our final result is an average of these two measurements.Benchmark 21 – Run Excel MacroThis test measures the amount of time taken to open an Excel document and run a macro to perform a range ofoperations. The test is run five times with a reboot in between each run. Our final result is taken as an average ofthese five measurements.Benchmark 22 – Save Word Document as PDFThis test measures the amount of time taken to open a large Word document and save it in PDF format. The testis run five times with a reboot in between each run. Our final result is taken as an average of these fivemeasurements.Benchmark 23 – USB 3.0 File CopyThis test measures the amount of time taken to copy files from a USB 3.0 drive to a local disk. The data setcomprises a total file size of 6.06GB, and the formats used include documents, movies, system files andexecutables.Performance BenchmarkEdition 2Page 10 of 4713 January 2020
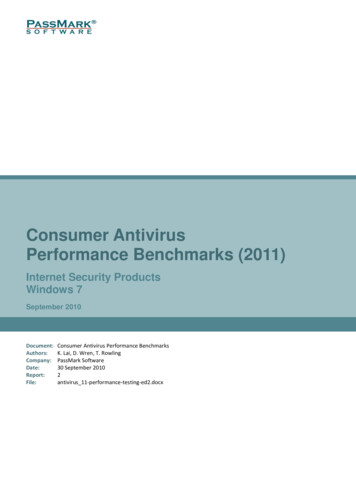
Consumer Security Performance Benchmarks 2019PassMark SoftwareTest ResultsIn the following charts, we have highlighted the results we obtained for Norton Security in yellow. The averagehas also been highlighted in blue for ease of comparison.Benchmark 1 – Boot Time (seconds)The following chart compares the average time taken for the system to boot (from a sample of five fast boots) foreach Internet Security product tested. Products with lower boot times are considered better performing productsin this category.F-Secure SAFE8.1Avira Internet Security8.4McAfee Total Protection8.8G DATA Internet Security8.9Avast Internet Security9.5Windows Defender9.5Norton Security9.8ESET Internet Security9.9AVG Internet Security10.2Panda Dome Essential10.6Average10.8SourceNext ZERO Super Security10.9Trend Micro Virus Buster12.9Kaspersky Internet Security12.9Bitdefender Internet Security14.2Trend Micro Internet Security17.90sPerformance BenchmarkEdition 22s4s6s8s10 s12 s14 s16 s18 s20 sPage 11 of 4713 January 2020
Consumer Security Performance Benchmarks 2019PassMark SoftwareBenchmark 2 – Scan Time (seconds)The following chart compares the average time taken to scan a set of 6159 files (totaling 982 MB) for each InternetSecurity product tested. This time is calculated by averaging the initial (Run 1) and subsequent (Runs 2-5) scantimes. Products with lower scan times are considered better performing products in this category.G DATA Internet Security8.0Norton Security11.0Kaspersky Internet Security18.0ESET Internet Security20.2Bitdefender Internet Security20.6Panda Dome Essential35.2Trend Micro Internet Security39.6Trend Micro Virus Buster39.9Avira Internet Security46.4Windows Defender48.2F-Secure SAFE48.9McAfee Total Protection57.4Average93.7SourceNext ZERO Super Security201.7Avast Internet Security397.6AVG Internet Security413.40sPerformance BenchmarkEdition 250 s100 s150 s200 s250 s300 s350 s400 s450 sPage 12 of 4713 January 2020
Consumer Security Performance Benchmarks 2019PassMark SoftwareBenchmark 3 – User Interface Launch Time (milliseconds)The following chart compares the average time taken to launch a product’s user interface. Products with lowerlaunch times are considered better performing products in this category.Trend Micro Internet Security95Norton Security109Trend Micro Virus Buster112F-Secure SAFE120Kaspersky Internet Security130G DATA Internet Security274Avast Internet Security289AVG Internet Security307Avira Internet Security317ESET Internet Security332Windows Defender413SourceNext ZERO Super Security413Bitdefender Internet Security416Average496Panda Dome Essential1,351McAfee Total Protection0 msPerformance BenchmarkEdition 22,761500 ms1,000 ms1,500 ms2,000 ms2,500 ms3,000 msPage 13 of 4713 January 2020
Consumer Security Performance Benchmarks 2019PassMark SoftwareBenchmark 4 – Memory Usage during System Idle (megabytes)The following chart compares the average amount of RAM in use by an Internet Security product during a periodof system idle. This average is taken from a sample of 10 memory snapshots taken at roughly 60 seconds apartafter reboot. Products with lower idle RAM usage are considered better performing products in this category.Norton Security39.6Panda Dome Essential44.7Kaspersky Internet Security56.7F-Secure SAFEESET Internet SecurityWindows Defender92.9107.6136.0G DATA Internet Security157.7Trend Micro Virus Buster158.2Trend Micro Internet Security198.2Average210.9Avast Internet Security230.0McAfee Total Protection265.8Avira Internet Security267.6AVG Internet Security270.2Bitdefender Internet Security507.3SourceNext ZERO Super Security0 MBPerformance BenchmarkEdition 2630.9100 MB200 MB300 MB400 MB500 MB600 MB700 MBPage 14 of 4713 January 2020
Consumer Security Performance Benchmarks 2019PassMark SoftwareBenchmark 5 – Memory Usage during Initial Scan (megabytes)The following chart compares the average amount of RAM in use by an Internet Security product during a scan.This average is taken from a sample of 10 memory snapshots taken at roughly 12 seconds apart. Products withlower idle RAM usage are considered better performing products in this category.Panda Dome EssentialESET Internet Security129.2161.6Norton Security236.5Trend Micro Virus Buster277.6F-Secure SAFE322.4Trend Micro Internet Security335.1Windows Defender376.1Kaspersky Internet Security393.9G DATA Internet Security402.2Average455.4Avast Internet Security499.3AVG Internet Security575.8Avira Internet Security702.1McAfee Total Protection755.5Bitdefender Internet Security812.2SourceNext ZERO Super Security0 MBPerformance BenchmarkEdition 2850.8100 MB200 MB300 MB400 MB500 MB600 MB700 MB800 MB900 MBPage 15 of 4713 January 2020
Consumer Security Performance Benchmarks 2019PassMark SoftwareBenchmark 6 – Browse Time (seconds)The following chart compares the average time taken for the default browser Microsoft Edge to successively loada set of popular websites through the local area network from a local server machine. Products with lower browsetimes are considered better performing products in this category.Norton Security10.7McAfee Total Protection10.8ESET Internet Security10.8AVG Internet Security11.4Trend Micro Virus Buster11.5Panda Dome Essential11.6Avast Internet Security11.6Windows Defender11.8G DATA Internet Security13.7Kaspersky Internet Security14.4Trend Micro Internet Security14.7Average19.5F-Secure SAFE26.7Avira Internet Security27.0SourceNext ZERO Super Security37.5Bitdefender Internet Security68.40sPerformance BenchmarkEdition 210 s20 s30 s40 s50 s60 s70 s80 sPage 16 of 4713 January 2020
Consumer Security Performance Benchmarks 2019PassMark SoftwareBenchmark 7 – Edge Launch Time (milliseconds)The following chart compares the average launch times of the Microsoft Edge after rebooting the machine foreach Internet Security product we tested. Products with lower launch times are considered better performingproducts in this category.G DATA Internet Security652Bitdefender Internet Security687Windows Defender692McAfee Total Protection696ESET Internet Security706Norton Security722Kaspersky Internet Security732Avast Internet Security735Average803Panda Dome Essential789F-Secure SAFE884Trend Micro Virus Buster894AVG Internet Security902Trend Micro Internet Security909SourceNext ZERO Super Security958Avira Internet Security0 msPerformance BenchmarkEdition 21086200 ms400 ms600 ms800 ms1,000 ms1,200 msPage 17 of 4713 January 2020
Consumer Security Performance Benchmarks 2019PassMark SoftwareBenchmark 8 – Installation Time (seconds)The following chart compares the minimum time it takes for security products to be fully functional and ready foruse by the end user. Products with lower installation times are considered better performing products in thiscategory.1F-Secure SAFE28.5ESET Internet Security30.8Norton Security52.5Trend Micro Virus Buster53.7Avast Internet Security66.0AVG Internet Security68.2Kaspersky Internet Security77.0Panda Dome Essential79.9Avira Internet Security87.4Bitdefender Internet Security101.2Trend Micro Internet Security110.6Average152.3SourceNext ZERO Super Security210.5McAfee Total Protection251.3G DATA Internet Security915.10s1100 s200 s300 s400 s500 s600 s700 s800 s900 s1,000 sWindows Defender was excluded from this test as it is built in to Windows 10 (Does not require installation).Performance BenchmarkEdition 2Page 18 of 4713 January 2020
Consumer Security Performance Benchmarks 2019PassMark SoftwareBenchmark 9 – Installation Size (megabytes)The following chart compares the total size of files added during the installation of security products. Productswith lower installation sizes are considered better performing products in this category.2Panda Dome EssentialF-Secure SAFENorton SecurityESET Internet Security338.25547.84673.58713.47Kaspersky Internet Security836.06Trend Micro Virus Buster912.57Avira Internet Security1,038.43AVG Internet Security1,081.12Average1,096.44Trend Micro Internet Security1,111.78Avast Internet Security1,130.28McAfee Total Protection1,180.82SourceNext ZERO Super Security1,754.47G DATA Internet Security1,880.46Bitdefender Internet Security0 MB22,151.01500 MB1,000 MB1,500 MB2,000 MB2,500 MBWindows Defender was excluded from this test as it is built in to Windows 10 (Does not require installation).Performance BenchmarkEdition 2Page 19 of 4713 January 2020
Consumer Security Performance Benchmarks 2019PassMark SoftwareBenchmark 10 – File Copy, Move and Delete (seconds)The following chart compares the average time taken to copy, move and delete several sets of sample files foreach Internet Security product tested. Products with lower times are considered better performing products inthis category.McAfee Total Protection4.70Windows Defender4.70Norton Security5.08Panda Dome Essential5.11AVG Internet Security5.12Avast Internet Security5.12Trend Micro Internet Security5.80Trend Micro Virus Buster5.96ESET Internet Security6.04G DATA Internet Security6.05Average6.21Bitdefender Internet Security6.33SourceNext ZERO Super Security6.79Kaspersky Internet Security7.44Avira Internet Security9.44F-Secure SAFE9.470sPerformance BenchmarkEdition 21s2s3s4s5s6s7s8s9s10 sPage 20 of 4713 January 2020
Consumer Security Performance Benchmarks 2019PassMark SoftwareBenchmark 11 –Third-Party Applications Installation Time (seconds)The following chart compares the average time taken to install 3 different third-party applications for each InternetSecurity product tested. Products with lower times are considered better performing products in this category.Norton Security8.6F-Secure SAFE8.9G DATA Internet Security9.1McAfee Total Protection9.3AVG Internet Security9.4SourceNext ZERO Super Security9.5Windows Defender9.7ESET Internet Security9.8Kaspersky Internet Security10.1Average10.2Bitdefender Internet Security10.3Panda Dome Essential10.3Trend Micro Internet Security10.9Avira Internet Security10.9Avast Internet Security11.1Trend Micro Virus Buster14.50sPerformance BenchmarkEdition 22s4s6s8s10 s12 s14 s16 sPage 21 of 4713 January 2020
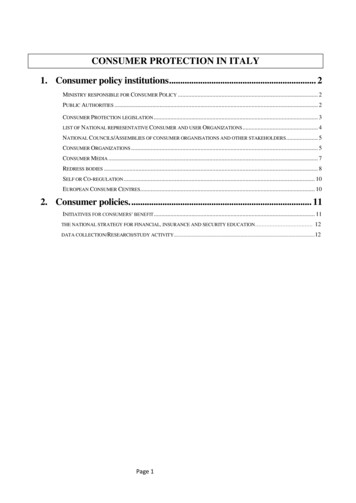
Consumer Security Performance Benchmarks 2019PassMark SoftwareBenchmark 12 – Network Throughput (seconds)The following chart compares the average time to download a sample set of common file types for each InternetSecurity product tested. Products with lower times are considered better performing products in this category.Trend Micro Internet Security6.3Trend Micro Virus Buster6.6McAfee Total Protection6.8Windows Defender6.8Panda Dome Essential7.5Norton Security7.7Kaspersky Internet Security9.5ESET Internet Security9.7Avira Internet Security12.5Average12.9Avast Internet Security15.8AVG Internet Security16.0SourceNext ZERO Super Security16.7F-Secure SAFE17.8G DATA Internet Security22.9Bitdefender Internet Security30.70sPerformance BenchmarkEdition 25s10 s15 s20 s25 s30 s35 sPage 22 of 4713 January 2020
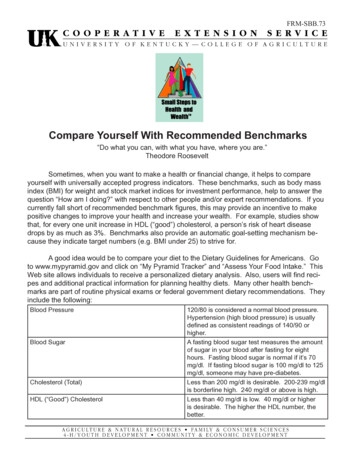
Consumer Security Performance Benchmarks 2019PassMark SoftwareBenchmark 13 – File Format Conversion (seconds)The following chart compares the average time it takes for five sample files to be converted from one file formatto another (MP3 WMA, MP3 WAV) for each Internet Security product tested. Products with lower times areconsidered better performing products in this category.ESET Internet Security52.8Norton Security52.9G DATA Internet Security53.3Avira Internet Security53.5Trend Micro Internet Security53.6Trend Micro Virus Buster53.8Kaspersky Internet Security53.8Panda Dome Essential53.9Avast Internet Security54.2F-Secure SAFE54.2McAfee Total Protection54.2AVG Internet Security54.8Average55.0Windows Defender55.7Bitdefender Internet Security61.8SourceNext ZERO Super Securi
Benchmark 12 - Network Throughput The metric measures the amount of time taken to download a variety of files from a local server using the Hypertext Transfer Protocol (HTTP), which is the main protocol used on the web for browsing, linking and data transfer.