Transcription
Device-independent Graininess ReproductionJunki Yoshii*, Shoji Yamamoto1, Yuto Hirasawa, Norimichi TsumuraGraduate School of Advanced Integration Science, Chiba University, 1-21-11 Kurosunadai,Inage-ku, Chiba 263-0041, Japan1Tokyo Metropolitan College of Industrial Technology, 8-17-1 Minamisenju, Arakawa-ku,Tokyo 116-0003, JapanAbstract. We evaluated a method for building a psychophysically based model of graininessperception for a device-independent graininess-reproduction system. The model was developedthrough experiments that explored the relationship between physical parameters of graininessobjects, subjective rating, and the maximum luminance of the displays used to present the objects.The graininess model was generated via multiple regression analysis of the parameters and wasused to calculate curved surfaces for which graininess perception was equalized. Even if the valuesof maximum luminance on the display is changed in the model, the value of graininess under thechanged luminance is hold by changing the physical parameters of graininess generation in themodel. We found that the proposed model and process for device independent graininessreproduction were effective for our adopted displays with various maximum luminance.Keywords: magnitude estimation, subjective rating, graininess, roughness, multiple regressionanalysis, revisionA part of this paper was presented at CIC25, held in Lillehammer, Norway*E-mail address: yoshii@chiba-u.jp1
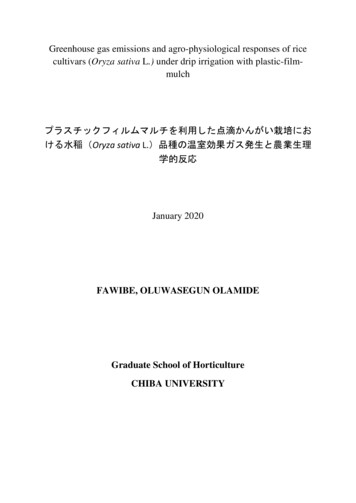
1.IntroductionRecently, electronic commerce (e-commerce) such as online shopping has becomecommonplace with improvements in high-speed networks and computer science. Inparticular, e-commerce has benefitted from the development of computer graphics (CG)techniques and rendering engines. Excellent representation of commercial products excitesconsumer interest, and a high-quality accurate representation makes real transactionspossible in a virtual world. In this system shown in Figure 1, an image of a product is takenwith a digital camera and is then displayed on a distant device through a network. Recently,displaying a rendered CG image of a product instead of a single digital photograph hasbecome widespread in e-commerce trading. This is accomplished by uploading informationsuch as the shape of the product to a server. With the proper design, consumers can browseproduct images interactively by controlling the viewpoints and lighting conditions as theywish. The CG image data are recorded and stored by the input system and distributedthroughout the network. Because consumers browse product images in this way beforepurchasing the product, faithfully reproducing the product through CG is extremelyimportant. However, the appearance of the product might differ depending on theenvironment in which the product image is viewed. For example, differences in appearancecan be caused by varying characteristics in the consumer’s display, such as maximumluminance and color reproduction range. When this happens, it can lead to customerdissatisfaction and an increase in returned goods, which are negative outcomes for bothcorporations and customers. This problem is outlined in Figure 2. Differences in appearanceare a serious problem for items such as clothes and art objects because how they look is amajor factor in their purchase.2
Accurate color reproduction is the most important factor affecting the commercial value ofproducts and is a point of quality control for e-commerce. The color-matching technique is a usefulmethod for fitting the diffuse color and texture of commercial products. This technique usesnumerical calculations to calibrate color between the input device and the display. The appearanceof surface graininess is also an important factor for product images. Fine-grained surfaces thatappear coated and polished are the best for giving the impression of “premium” quality. Moreover,this characteristic of surface graininess involves the sense of touch and hold. Because the shapeand function of a product are important to us as consumers, we must be sensitive and pay attentionto the appearance of surface graininess, even in images designed for representations in e-commerce.Although an appearance-matching method similar to color matching should be developed tofurther e-commerce growth, the numerous parameters and complicated handling make managingsurface graininess difficult. In this paper, we address this issue by proposing a device-independentgraininess-reproduction method that matches the appearance of graininess by the control of CGimages (Fig. 3). We derive the perceptual space for surface graininess via an experiment thatdetermines the magnitude of subjective rating. Some factors that change the appearance of surfacegraininess are resolution, maximum luminance, and color reproduction range. In this preliminarystudy, we controlled the height and distribution of the CG image bump profile according to themaximum luminance. The proposed method can be used for a device-independent graininessreproduction process that manipulates the physical parameters mentioned above to match thegraininess on the display with different maximum luminances.3
Figure 1. The e-commerce processDisplay ADisplay BFigure 2. Differences in appearance caused by varying display characteristics4
Figure 3. Outline of the graininess-matching procedure2.Related WorkThe surface shape an object is important for understanding and interpreting the object’sappearance and other characteristics. Several studies1-3) have investigated the appearance ofgraininess using CG objects. Glossiness is another characteristic that changes how objects areperceived and which can be altered by manipulating physical parameters. The current study wasinspired by several studies that focused on glossiness. Some1) have studied gloss in whichgraininess is perceived as a result of light scattering. Like graininess, the glossiness of an objectdepends on the change in maximum luminance of the device used to display it. Therefore, we must5
distribute images to consumers that do not change in glossiness depending on the device ordisplay environment, especially when the items for which appearance such as color or glossis emphasized.Pellacini et al.4) have developed a new model to quantify the perception of gloss onan object’s surface. They conducted two experiments that explored the relationship betweenphysical parameters and the perceptual dimensions of a glossy appearance. The parametersof an object’s geometry that are related to the perception of glossiness are not well knownand the number of factors is likely quite large. However, narrowing the number down to afew parameters that contribute the majority of the perception might be possible. In the firstexperiment, they used a pair-comparison method to reveal the dimension of gloss perceptionfor simulated painted surfaces. They visualized the data using multidimensional scalingtechniques5) and found perceptual dimensions that express two important features related toglossiness. These features are denoted by Eq. 1.𝑑 1– 𝛼3𝑐 𝑠 3𝑑 /2(1) 𝑠 /2where d and c are perceptual dimensions, ρd is the object’s diffuse reflectance, ρs is the specularreflectance, and α is the spread of the specular lobe, all of which are introduced by Ward’sanisotropic BRDF model6,7) The dimensions d and c are qualitatively similar to the contrast glossand distinctness-of-image (DOI) gloss observed by Hunter8).In the second experiment, Pellacini et al.3) determined the relationship between theperceptual dimensions for glossy appearance and the physical parameters used to describethe reflectance properties of glossy surfaces. They evaluated two kinds of objects described6
by c and d which were related to physical dimensions such as ρd, ρs, and α, and they used subjectiveratings to estimate the relationship between the physical qualities of the stimuli and humanperception. The experiment was useful because it quantified glossiness by asking observers toprovide numerical answers regarding the CG image of the glossy object. From this experiment,they were able to compare the objects described with the physical parameters to the perceptualdimensions. This property of the model might make it easier to create objects that are perceived tohave the same glossy appearance.Gloss perception was also quantified by Ikeda et al.9) who used an experimental approach toreproduce equally glossy objects with CG even if the objects were presented on displays withdifferent maximum luminances. They prepared images with differing intensity (A1) and spread ofthe specular reflectance (A2) (from Phong’s model10)). Then, they varied the maximum luminanceVmax of the display and used a magnitude-estimation method to evaluate how glossy the items inthe images were. The multiple regression analysis produced the model denoted by Eq. 2G 54.7 A 1 4.1 102 A 2 5.4 Vmax 76.3 ,(2)where the coefficient of determination (R2) was 0.803. Thus, this model accounted for a goodproportion of the variance in the dependent variable. The model indicates that the perceptual glossG can be expressed with the physical gloss parameters A1, A2, and Vmax. Therefore, an equal senseof gloss can be achieved by adjusting A1 and A2 depending on the maximum luminance of thedisplay. However, the model is greatly affected by the radiance of the display. This factor can bepre-defined in a color management system such as sRGB or ICC.7
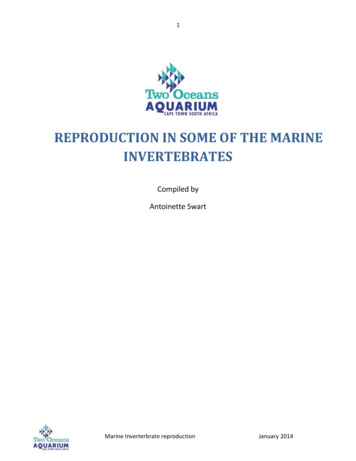
3.Development of Graininess Space3.1 Generation of graininess stimuliOur experiment was designed to determine the relationship between perception andphysical elements than comprise graininess. Therefore, we reproduced various graininesspatterns on objects using a CG renderer. For the first challenge, we specified that thematerial object be made by mat. In order to produce the graininess, we used a bumpmapping technique. This technique can render ruggedness on a flat object by changing thepixel value according to a normal map. In this process, the direction of reflected light ischanged falsely according to the change in the texture’s pixel value. Although the surfaceof the actual object is flat, it is possible to make it appear rugged by changing the appearanceof the object with shading and shadow. Figure 4 depicts a rendering result produced bybump mapping. On our first attempt, some observers pointed out that the graininess valuesdiffered depending on the region within the image. This difference is assumed to haveoccurred because of binary noise in the generation algorithm. Therefore, we added Gaussiannoise so that perception of graininess in the image would follow a normal distribution.We anticipated that the depth of ruggedness and the size of the grains would havea large effect on the perceived graininess of the rendered image. In our reproduction method,the change of depth for ruggedness is generated by changing the pixel value of the normalmap with Gaussian noise. Additionally, the size of the grains was varied through dilation inthe morphological processing. Dilation is an image processing technique used to expand anelement of a digital image. By expanding the element in the normal map during bumpmapping, the size of the grains are larger after processing. However, a rapid change ofruggedness as shown in Figure 5(a) appears if dilation produces grain that are too large.8
Therefore, we applied a Gaussian filter to the normal map after the dilation to smoothen the rapidchange. Figure 5(b) shows the result after smoothing. In our experiment, the standard deviationused for the Gaussian filter was empirically decided to be 0.3 times the size of a grain. Moreover,we found that perceiving graininess was difficult for objects such as those shown in Figure 5(b)because of the hollowed-out appearance. By inverting the luminance value of the texture, we wereable to generate the graininess objects shown in Figure 5(c). We show an enlarged view of thegraininess object in Figure 5 because the grain can be easily perceived.In addition the degree of ruggedness and the size of the grain, we incorporated a parameterfor the maximum luminance of a display. This parameter is dependent on the maximum pixelvalues of the displayed image. For the implementation of this parameter, the relationship betweenpixel values and the luminance of the display must be checked. We used an EIZO FlexScanS2001W monitor, and measured luminance with a chromameter (CS-100A, KONICA MINOLTA,Japan). As the result of the measurement, we obtained the characteristic curve denoted by Eq. 3.L 0.001P 2 0.003P 0.257 ,(3)where the coefficient of determination (R2) was 1.00, L is the luminance, and P is the pixel valueof the display. Eq. 3 assumes that changes in the maximum pixel values are variations in themaximum luminance of the displays. Therefore, we can adjust the graininess image according tothe maximum pixel value in the display.Because graininess varies according to the pixel value of the texture image used for bumpmapping, the depth of ruggedness and the size of the grain can be manipulated by applying imageprocessing to the texture. As shown in Figure 6(a), the depth of ruggedness can be increased bywidening the scale of the pixel values. Further, the size of the grains can be increased by applyinga dilation process to the texture as shown in Figure 6(b). Depending on the display, different9
maximum luminance values can be assumed by lowering the pixel value of the wholestimulus. The change in the maximum luminance value is shown in Figure 6(c).Figure 4. The bump-mapping process(a)(b)(c)Figure 5. A graininess object before processing (a), after smoothing (b), and after inversingthe luminance (c).10
(a)(b)(c)Figure 6. Change in the depth of ruggedness (a), size of the grains (b), and maximumluminance (c) for a graininess object.3.2 Subjective ratingThe purpose of our experiment was to create a perceptual space to quantitatively controlgraininess. To achieve this, we designed an experiment based on the magnitude-estimationmethod—a psychophysical scaling technique that can reveal functional relationships between thephysical properties of a stimulus and its perceptual attributes.Observers are university students of men and women corrected to normal or normal eyesight.The number of participants was 9, and we performed same experiments for each observer.Observers observed pairs of graininess images that were generated by a CG renderer. These images11
were presented on a black background in a darkened room. The distance between theobserver and monitor was about 40 inches, which was 3 times the height of display (Fig. 7).Each experimental parameter for the images had three levels (Fig. 8). The depths ofruggedness (Amplitude) values (A) were 64, 128, or 256, the size of grain values (S) were2, 3, or 4, and the maximum luminance values (L) were 11, 24, or 35. We randomlypresented the 27 stimuli (3 amplitudes 3 sizes 3 luminances) to the observers and askedthem to rate the graininess of each object on a scale of 0 to 100. Before the experiment,typical 0-graininess and 100-graininess objects were presented as reference. We normalizedeach observer’s ratings from 0 to 1 to account for personal differences in the range ofjudgments (Eq. 4).Vnormalized Vi MIN,MAX MIN(4)where Vnormalized is the result of a observer’s subjective rating after normalization, Vi is theirevaluation score for each image, MAX is the maximum value they used, and MIN is the minimumvalue they used.Figure 7. The conditions of the experiment.12
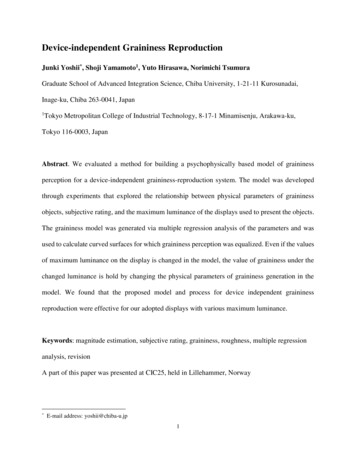
3.3 The model for graininess reproductionIn the previous section, we performed experiments to evaluate a total of 27 stimuli bymanipulating physical parameters (A, S, L) affecting the perception of graininess for observers (9people). We summarize the rating results in Table 1. The table contains the physical parameters ofthe graininess objects and the average of the rating values for these experimental stimuli. Theevaluation values of these graininess are shown in Figure 8 in 4D. Since there are 4 rows in Table1, this figure is represented by 4D including a color bar for the graininess.Equation 5 shows the result of a multiple regression analysis on the data obtained from thegraininess rating task.G 0.254 3 A-0.480 S 0.006 L-0.121 ,(5)where the coefficient of determination (R2) was 0.916. The relatively high R2 indicates that thisequation is reliable. G is the perceived graininess that is objective variable in Equation 5. Next, pvalue is calculated to investigate a significant difference that each explanatory variable can explainthe objective variable. Generally, when the p-value is less than 5% or 1%, the null hypothesis isrejected as false and the alternative hypothesis is adopted. Therefore, we summarize the p-valuefor each explanatory variable of Equation 5 in Table 2. Since the p-values for explanatory variablesother than the intercept of the objective variable axis is less than 1%, it can be said that they cannotexplain the objective variable with a probability of 1% or less. In other words, it is significant inexplaining the objective variable with each explanatory variable.This graininess model made it possible to generate objects that feel equal graininess onarbitrary curved surface. Figure 9 indicates these results as normalized graininess G 0.2, 0.4, 0.6,0.8, and 1.0. These surfaces can be used to equalize the perception of graininess by adjusting thevalues for A, S, and L. Therefore, when we select the value of A or S along the same surface13
according to the arbitrary maximum luminance of the display, a device-independentreproduction for graininess can be acquired. Larger sizes of grains are perceived as lessgrainy because the coefficient for S is negative. Conversely, large values for A and L lead tolarger perceived graininess. The transition between the surfaces in Figure 9 represents thesetrends well. The shapes of the surfaces representing different levels of graininess are almostthe same. The surfaces are drawn within the domain of the parameter treated in theexperiment such as A, S and L, and the range for each coordinate axis in the graph is setwithout estimation.14
Table 1. Physical parameters of the stimuli and mean of the rating value for these stimuliAmplitude 6256256256256256256256256Size of e 4202247144202247144202247144202247Graininess (G)Table 2. P-values for each explanatory s .860.600.670.79
Figure 8. Mean of the rating value for each stimulusFigure 9. Surfaces of an equal graininess perception.16
4.Management of Graininess AppearanceIn this section, we use the model to adjust the image and equalize the perceived graininess.graininess. The graininess value is held constant by changing the physical parameters A and S inthe graininess generation model according to maximum luminance value of the display being used.4.1 Matching graininess using the modelAs an example of how we modified the perceived graininess, consider the graininess objectgenerated by the parameters: A 128, S 3, and L 35 shown in Figure 10(a). This object has agraininess score (G) of 0.54 on the graininess surface. We defined this image as the original imagein this evaluation. A represents the depth of ruggedness on the surface of the graininess object.This is defined as the amplitude in this paper. S is the size of the grains of the graininess object. Aand S control the texture in the bump mapping by image processing. L represents the maximumluminance value of the display used in the experiment. In this method, the same display was usedto avoid the influence due to the difference in display characteristics. Therefore, L virtualizes thechange in the maximum luminance value of the display by scaling the pixel value of the sceneimage including the graininess object. In this method, A, S and L are generated with the same valuein the object. A detailed explanation is given in 3.1.Next, we generated the modified example for a display with low maximum luminance. Thisobject was rendered by changing the parameters to: A 128, S 3, and L 11 shown in Figure10(b), in which only the maximum luminance is lowered. We assume that changes in the maximumpixel values in the images are variations of the maximum luminance of the displays. The G of thisexample was 0.43, which was the average of added subjective rating to confirm graininess. Thelower luminance clearly resulted in a lower perception of graininess. This result indicates that17
observers have difficulty sensing the graininess when the maximum luminance of the displayis low. Human has a difficulty to discriminate features of texture in dark scenes. In a brightdisplay, the contrast is large that expresses features such as the amplitude of the graininessobject. On the other hand, the contrast is small in a dark display. Therefore, it can be saidthat the features of a texture can be recognized more clearly in the bright display. However,from the viewpoint of the Just Noticeable Difference (JND), it can be said that the differencein features can be more discriminated in dark displays. In this experiment, the observerscould detect the little graininess with a dark display. Because of the balance between thecontrast and the JND that are events by the human sensory organs in eyes, the observernoticed the difference even in a dark display.Next, we modified the image so that its perceived graininess would equal that of theoriginal image. In the first operation, we define the plane such that all values are equivalentaccording to the maximum luminance L 11. The cross line between this plane and thegraininess space is calculated as shown in Figure 11. Although the graininess for the originalimage decreased with the lower the maximum luminance value, it can be increased to matchthe original perception by changing the physical parameters and returning to this cross line.Therefore, we selected three positions: A 232 and S 4, A 179 and S 3, and A 126and S 2 on the equal graininess surface for G 0.54. The three right images in Figure 11show the results. The proposed operation was effective in equalizing graininess perceptioneven when the luminance of the display was different from the original display.To evaluate whether the graininess of the modified objects was equal that of theoriginal object, we again asked observers to rate the graininess as described in section 3.After normalizing and averaging the ratings, the resulting evaluation scores were G 0.54,18
G 0.58, and 0.57, for the three sets of A and S values, respectively. We can see that the changein ruggedness A is more important for generating the equalized perception for graininess than isthe change in gain size S.(a)(b)Figure 10. Sample of objects to revise the graininess. (a) Part of the graininess object withhigh maximum luminance, mean 129, variance 324, skewness 0.006, kurtosis 2.98. (b)Part of the graininess object with low maximum luminance, mean 75, variance 40,skewness -0.271, kurtosis 3.57Figure 11. Schematic process for equalizing graininess G to 0.54.19
4.2 Evaluation for the AccuracyThe graininess evaluation scores obtained by magnitude estimation is uneven becausesubjective rating is hard to compare under different luminance conditions. Therefore, we mustcheck whether the numerical difference in evaluation score (G 0.54 0.58) for the revisedimage is an appropriate result. We considered the variance of the graininess scores anddetermined the acceptable range. A standard deviation was calculated from the evaluationscores for each of the 27 images used in the rating task as shown in Table 3. The Table 3indicates a tendency for variance to be large if both the size of the grains and the maximumluminance are small (Fig. 12). Similarly, Figure 13 indicates that the variance is small whenboth the size of the grains and the maximum luminance are large. The average of eachgraininess object’s standard deviations (SDave) was 0.12. A difference in evaluation score fora revised image is therefore inappropriate if it is more than 0.12. In the example above, thetarget graininess for the image after revision was G 0.54, and thus acceptable evaluationscores would be in the range of 0.42 to 0.66 (0.54 0.12). Thus, in this paper, the acceptableboundary for graininess is within SDave of the target graininess value.As shown in Fig 14(c-e), the perceived graininess of the image after revision rangedfrom G 0.54 to 0.58 (a range of 0.04), which is well within the 0.12 boundary. The colorof the outer frame of the graininess images shown in Figure 14 correspond to what is shownin Figure 11. This result is evidence that our proposed method for graininess space is usefulfor matching the perception of graininess even if the maximum luminance of display ischanged.20
Table 3. Graininess for the stimuli and its standard deviationFigure 12. (left) Image with small grain size and small maximum luminance. (right) Variancein graininess perception for 7 observers.21
Figure 13. Image with large grain size and large maximum luminance. (right) Variance ingraininess perception for 7 observers.(a)(c)(b)(d)(e)Figure 14. (a) An original image. (b) Lower luminance but before revision. (c-e) Afterrevision with three different pairs of grain size and depth of ruggedness.22
5Conclusion and Future workHere, we produced a psychophysically-based model of graininess perception for generatingdevice-independent graininess. This model was used to match the graininess perception acrossdisplays with varying maximum luminances. The objects generated by the model were perceivedas having equal graininess with a high accuracy.This model is the result based on regression analysis. It is interesting that the result convergedto the third root. This is because L * indicating the luminance in the CIE L * a * b * color spacecan be represented by the third root of Y indicating the luminance in the CIE XYZ color space. TheL * a * b * color space is designed to approximate human vision. Among them, the L componentvalue is very close to the human perception of brightness. The amplitude (A) in this methodrepresents the depth of the ruggedness by the contrast of the pixel value. Therefore, we guess itcan be said that the difference in brightness of the graininess object leads to the graininess. In thefuture, we will investigate the relationship between the graininess due to the amplitude and thegraininess due to the difference in brightness.This model is useful for cases in which the graininess object is affected by a limited amountof luminance. The limitations of our model should be explored with additional evaluations. Thismodel is useful for cases in which the graininess object is affected by a limited amount ofluminance. The limitations of our model should be explored with additional evaluations. Our model has limitations on the generated images. Since this model is an application oftechnology to map uniform graininess, it is preferable to apply to an object with uniform texture.As a basic research, we excludes the material appearance other than the graininess. Therefore, thismodel cannot be applied to the material appearance containing other elements such as gloss. Thefineness / roughness is greatly affected by image contrast. However, the modulation of the texture23
is effective only under the condition that the intensity contrast or the shape of the intensityhistogram match the characteristic of the fine texture.11) Since the size of the device affects the sizeof grain of the graininess object, the device used for the material appearance control is preferablythe same size as the device before the control. Moreover, our model is only applicable to objectswith a plane surface. As many kinds of objects with complex shapes exist in the world, futurestudies will have to achieve a more practical way to match appearance so that e-commerce canprogress.AcknowledgementsWe thank Adam Phillips, PhD, from Edanz Group (www.edanzediting.com/ac) for editing adraft of this manuscript.References1. M. Ludwig, G. Meyer, “Effects of Mesoscale Surface Structure on Perceived Brightness”,Electron. Imaging Meas. Model. Reprod. Mater, 1–7 (7), 20162. Jie Guo, Jingui Pan, Real-time multi-scale refraction under all- frequency environmentallighting. CAD/Graphics, 2013.3. Jie Guo, Jinghui Qian, Yanwen Guo, and Jingui Pan, Rendering Thin Transparent Layerswith Extended Normal Distribution Functions, IEEE Transactions on Visualization andComputer Graphics, 20164. Fabio Pellacini, James A. Ferwerda, and Donald P.Greenberg, “Toward a psychophysicallybased light reflection model for image synthesis”, In Proc. SIGGRAPH ’00, pp.55-64, 2000-0701.24
5. Busing F., Commandeur J., and Heiser W. (1997), “PROXSCAL: a multidimensional scalingprogram for individual differences scaling with constraints.”, In W. Bandilla and Faulbaum(Eds.), Advances in Statistical Software, 6, Lucius & Lucius: Stuttgart, 67-73.6. G.J.Ward, ”Measuring and modeling anisotropic reflection”, ACM SIGGRAPH ComputerGraphics, 26(2), pp.265-272(1992).Joseph B. Kruskal et al., “Multidimensional Scaling”, SAGEPUBLICATIONS, 1978.7. Matt Pharr et al., “Physically Based Rendering: From Theory to ide.html, (2017/01/03 access).8. Hunter, R.S. and Harold R.W. (1987), “The Measurement of Appearance (2nd edition)”,Wiley, New York.9. Norimichi Tsumura, Tetsuo Ikeda, Yoichi Miyake, ”Device Independent Gloss ReproductionModel for E-Commerce: Estimation of Radiance on Display”, PICS, 200310. B. Phong, “Illumination for c
Graduate School of Advanced Integration Science, Chiba University, 1-21-11 Kurosunadai, Inage-ku, Chiba 263-0041, Japan 1Tokyo Metropolitan College of Industrial Technology, 8 -17 1 Minamisenju, Arakawa ku, Tokyo 116-0003, Japan Abstract. We evaluated a method for building a psychophysically based model of graininess