Transcription
Fuel FocusUnderstanding Gasoline Markets in Canadaand Economic Drivers Influencing PricesVolume 10, Issue 1February 6, 2015
Copies of this publication may be obtained free of charge from:Natural Resources CanadaPetroleum Resources Branch580 Booth Street, 17th FloorOttawa, Ontario K1A 0E4Phone: (613) 992-9612TTY Service: (613) 996-4397 (Teletype for the hearing-impaired)Fax (613) 992-0614Web site: http://nrcan.gc.ca/eneene/focinf-eng.php Her Majesty the Queen in Right of Canada 2014ISSN 1918-3321Aussi offert en français sous le titre Info-Carburant
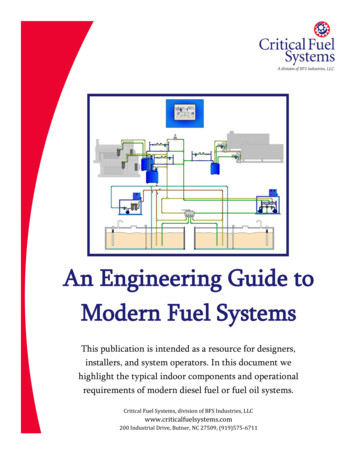
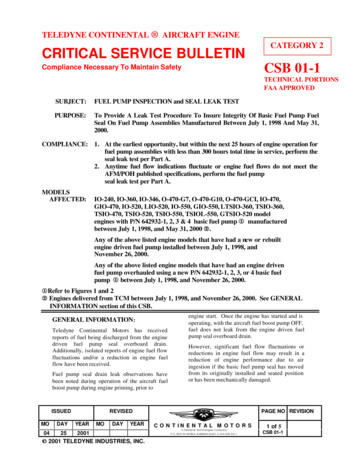
Fuel FocusFigure 1: Crude Oil and Regular GasolinePrice Comparison (National Average)National Overview Domestic Gasoline Sales Up 2%: Canadiansconsumed 38 billion litres of gasoline in the firstnine months of 2014, or more than 800 millionlitres more than the same period last year. In thesame period, diesel fuel sales increased by 3% to26 billion litres, while furnace oil sales increased by2% to 3 billion litres. (Statistics Canada, CansimTable 134-0004; NRCan)14012012010080806060Cents / Litre1004020Gasoline at RetailExcluding TaxesCanadian Light BlendBrent igure 2: Weekly Regular Gasoline Prices201320142015150140130Cents / Litre U.S. Gasoline Inventories Climb: As oil priceshave tumbled during the past few months, U.S.refiners have been sucking up as much of theabnormally inexpensive crude as they can, turningit into gasoline, diesel and other fuels. Prices at thepump have plunged to almost 2 a gallon, thelowest nationwide average in more than five years.Even though U.S. drivers are filling their tanksmore often, they can’t keep pace with surginggasoline supplies. So a lot of the fuel that refinersare producing is sitting in storage tanks. Gasolineinventories stood at 240 million barrels as ofJanuary 9th —the highest they have been at thistime of year since at least 1990. Refining capacityutilization has increased to more than 93% in thefour weeks ending January 9, 2015, with U.S.refiners processing an average of 16 million barrelsof oil a day—unusually high for this time of year.(Source: Wall Street Journal)16014040Diesel fuel prices remained unchanged at 1.09 perlitre compared to the previous week. This is adecrease of 35 cents per litre from the same periodlast year. Furnace oil prices rose by 0.1 cent per litrefrom the previous week to an average of 1.06 perlitre.Recent Developments160Cents / LitreCanadianRetailGasolinePricesIncreased 4 Cents per Litre from LastWeekFor the week ending February 3, 2015, the Canadianaverage retail gasoline price was nearly 97 cents perlitre, up 4 cents per litre from the previous week.This represents a 1.5 cent-per-litre decrease since thebeginning of the year. However, compared to lastyear at this time, average retail pump prices are29 cents per litre lower.Volume 10, Issue 1February 6, 20151201101009080JFMAMJJASONDChanges in Fuel PricesWeek of: /L2015-02-03Change from:PreviousWeekLastYear 3.9-29.4Gasoline96.5Diesel108.50.0-35.4Furnace Oil105.5 0.1-26.7Natural Gas Prices in CA/GJAlberta (NGX)2.51-0.06-2.64Ontario (Dawn)3.35-0.28-5.65Source: NRCan, Bloomberg, NGXNatural Gas Prices for Vehicles2015-02-03 /kilogram /L gasolineequivalent /L 075.978.7Toronto128.484.787.8Source: /kg Kent Marketing Services LimitedIn this IssueNational OverviewRecent DevelopmentsRetail Gasoline OverviewWholesale Gasoline PricesGasoline Refining and Marketing MarginsCrude Oil OverviewPage112345
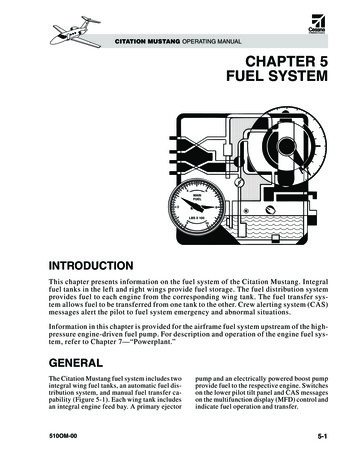
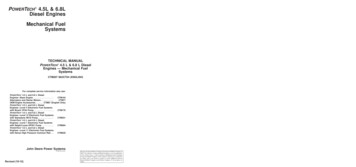
Volume 10, Issue 1Page 2 of 5Retail Gasoline OverviewThe four-week average Canadian pump price inselected cities across Canada was 91 cents per litre forthe period ending February 3, 2015. This represents a35 cent-per-litre decrease compared to the sameperiod in 2013.For the period ending February 3, 2015, the overallfour-week average crude oil price decreased bynearly 3 cents per litre to 37 cents per litre comparedto two weeks ago.Retail gasoline prices in Western centres ranged from77 cents per litre to 1.03 per litre while prices inEastern centres ranged from 90 cents per litre to 1.02 per litre.Refining and marketing costs and margins registeredat 18 cents per litre, an increase of 0.2 cent per litrefrom two weeks ago. Margins are 6 cents per litrelower than last year at this time.Figure 3: Regular Gasoline Pump Prices in Selected CitiesFour-Week Average (January 13 to February 3, 2015)Source: NRCan* Regulated MarketsNote: Toronto crude oil cost includes pipeline tolls of 4 per barrel for light crude oil from Edmonton to Sarnia, Ontario.CPI Annual Review 2014In 2014, the annual average increase in the Consumer Price Index (CPI) was 2.0%. This increase followedgains of 0.9% in 2013 and 1.5% in 2012.The transportation index rose 1.1% on an annual average basis in 2014, led by higher prices for the purchaseof passenger vehicles ( 1.3%). Meanwhile, gasoline prices rose 0.2%, the lowest annual average increase since2009. After increasing in the first half of 2014, the gasoline index posted six consecutive monthly declines.The monthly declines in November and December were the largest since 2008.Among the provinces, eight posted larger annual average increases in consumer prices in 2014 than in 2013.Ontario recorded the largest acceleration in consumer price inflation. Prince Edward Island and Manitobawere the only two provinces where annual average price increases were smaller in 2014 than in the previousyear.Source: The Daily, 150123c-eng.htm
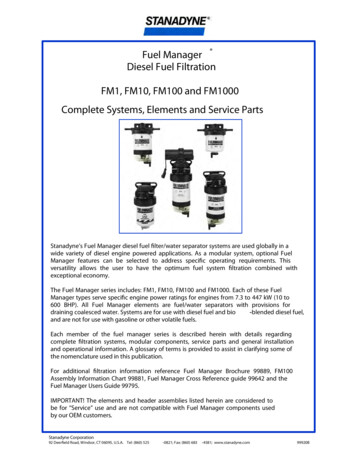
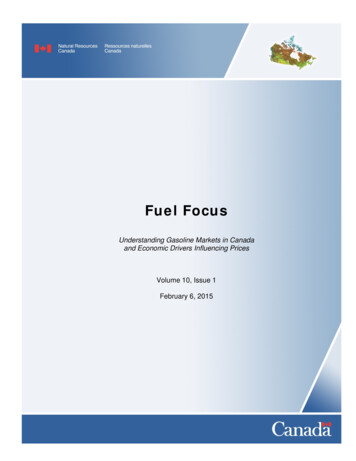
Volume 10, Issue 1Page 3 of 5Wholesale Gasoline PricesWholesale gasoline prices ranged from 43 to 51 centsper litre in selected centres for the week ofJanuary 29, 2015. Overall, compared to theprevious week, Canadian and American centresrecorded price increases in the range of nearly 1 tomore than 4 cents per litre.In the Western centres, prices increased from 2 to4 cents per litre compared to the previous week, withprices ending at 43 to 49 cents per litre.Prices in Eastern centres rose from less than 1 to3 cents per litre and ended at 47 to 51 cents per litre.In the last four weeks, wholesale prices in mostCanadian and American selected centres rangedbetween a decrease of 4 cents per litre to an increase ofnearly 7 cents per litre.Overall, compared to the same period last year,wholesale prices in all selected centres declined from27 to 35 cents per litre.Figure 4: Wholesale Gasoline PricesRack Terminal Prices for Selected Canadian and American Cities Ending January 29, 2015(CAN 040403030303020202020BraintreeSources: NRCan, Bloomberg Oil Buyers 4J-14F-14Cents / LitreJ-14J-15MontrealBuffaloCents / 50J-1460A-1460M-147060M-1470F-1470Cents / M-14100A-14100M-14110100J-14110110Cents / LitreGrand Forks110F-14Cents / LitreVancouver110
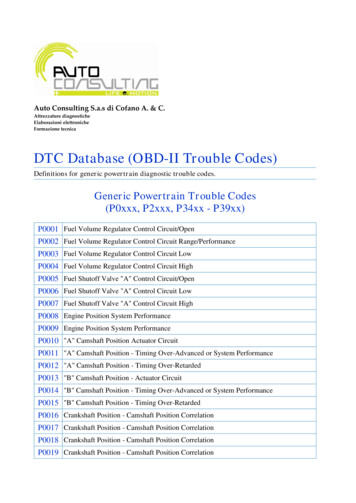
Volume 10, Issue 1Page 4 of 5Gasoline Refining and Marketing MarginsFour-week rolling averages are used for gasolinerefining and marketing margins.Refining margins for gasoline have been showing somegains which is indicative of a tightening on supplies.These margins have increased more promptly thancrude oil prices. Nationally, refining margins reached16 cents per litre, a 1.5 cent per litre increase comparedto the same period a year ago.Overall, marketing margins declined nearly 2 centsper litre to 7.6 cents per litre. For the five centres,marketing margins ranged from a low of 5.7 cents perlitre in Montreal to a high of 8.6 cents per litre inVancouver.Marketing margins have to cover the costs associatedwith operating an outlet and generating a profit forthe station owner. These margins can varysignificantly depending on the region, volume sold,and availability of other product offerings. Most ofthe costs of operating an outlet are fixed and do notdecline with lower gasoline prices.Figure 5: Gasoline Refining and Marketing MarginsFour-Week Rolling Average Ending February 3, 2015------- Refining MarginMarketing 42520A-143025O-133530J-134035A-1340J-14Cents / Litre454045Cents / 050-545J-15O-14J-14A-14J-14O-13O-13J-13A-13Source: NRCanCents / 520151050-5Montreal454035302520151050-5J-13Cents / 20151050-5J-13Cents / LitreCents / LitreNational Average454035302520151050-5
Volume 10, Issue 1Page 5 of 5Crude Oil OverviewSlight Rebound in Global Light Crude oil PricesOn January 28, 2015, the NYMEX crude oil pricesclosed at US 44 per barrel, its lowest point level innearly six years. However, overall crude oil pricesrebounded in the week ending January 30, 2015, onnews of falling drilling rig count, which suggests adecline in oil supply will follow.For the week ending January 30, 2015, light crude oilprices averaged between 307/m3 and 391/m3, (US 39to US 50 per barrel). Prices for the light crudeincreased, compared to last week, in the range of lessthan 1/m3 to 15/m3.The price for Canadian heavy oil (Western CanadaSelect) averaged 253/m3 (US 32 per barrel) for theweek ending January 30, 2015. Compared to last year atthe same period, WCS prices fell by 46%.U.S. crude oil inventories remain above their fiveyear average range, putting downward pressure onNorth American crude oil prices.Can /m3Figure 6: Crude Oil Price 35025025015015001- 03- 05- 07- 09- 11- 01- 03- 05- 07- 09- 11- 01Jan.13 13 13 13 13 13 14 14 14 14 14 14 15 (Weekly)Edmonton Par Adjusted (Canadian Light crude blend after May 1, 2014)WTI at CushingBrentWCSChanges in Crude Oil PricesCrude Oil TypesWeek Ending:2015-01-30Change From:Previous WeekLast Year Can/3m US/bbl Can/3m US/bbl Can/3m US/bblCanadian Light307.1738.98 3.69-0.22-282.47-45.19WTI360.2645.72 0.12-0.80-320.94-51.52Brent391.4349.67 15.28 1.09-359.94-57.59WCS252.7432.07 1.55-0.37-300.27-46.87Source: NRCanCrude Oil Price Forecasts(US Dollar per Barrel)WTIInstitutionBrent2015201620152016Bank of America /MerrillUS EIA5057525855715875RBC Capital Markets65747183ABN AMRO55706075Goldman Sachs47655070Deutsche Bank55655970Societe Generale51605565Den Norske Bank(DNB)SuncorNANA657959NA65NABMO NANABernstein75858090Sproule Associates65806883CITI Research55626370CIBC80828590TD Bank6880NANACommerzbank69807383Credit urce: Natural Resources Canada, forecast dates varyfrom December 1, 2014 to January 13, 2105.
Source: NRCan, Bloomberg, NGX Natural Gas Prices for Vehicles 2015-02-03 /kilogram /L gasoline equivalent /L diesel equivalent Vancouver 114.5 75.5 78.3 Edmonton 115.0 75.9 78.7 Toronto 128.4 84.7 87.8 Source: /kg Kent Marketing Services Limited In this Issue Page National Overview 1 Recent Developments 1 Retail Gasoline Overview 2