Transcription
6. Process or Product Monitoring and Control6. Process or Product Monitoring and ControlThis chapter presents techniques for monitoring and controlling processesand signaling when corrective actions are necessary.1. Introduction1.2.3.4.5.6.HistoryProcess Control TechniquesProcess Control"Out of Control""In Control" but UnacceptableProcess Capability3. Univariate and MultivariateControl Charts1.2.3.4.Control ChartsVariables Control ChartsAttributes Control ChartsMultivariate Control charts5. Tutorials1. What do we mean by"Normal" data?2. What to do when data are nonnormal3. Elements of Matrix Algebra4. Elements of MultivariateAnalysis5. Principal Components2. Test Product for Acceptability1. Acceptance Sampling2. Kinds of Sampling Plans3. Choosing a Single SamplingPlan4. Double Sampling Plans5. Multiple Sampling Plans6. Sequential Sampling Plans7. Skip Lot Sampling Plans4. Time Series Models1. Definitions, Applications andTechniques2. Moving Average orSmoothing Techniques3. Exponential Smoothing4. Univariate Time SeriesModels5. Multivariate Time SeriesModels6. Case Study1. Lithography Process Data2. Box-Jenkins ModelingExampleDetailed Table of andbook/pmc/pmc.htm[6/27/2012 2:37:20 PM]
6. Process or Product Monitoring and Control6. Process or Product Monitoring and Control - Detailed Table ofContents [6.]1. Introduction [6.1.]1. How did Statistical Quality Control Begin? [6.1.1.]2. What are Process Control Techniques? [6.1.2.]3. What is Process Control? [6.1.3.]4. What to do if the process is "Out of Control"? [6.1.4.]5. What to do if "In Control" but Unacceptable? [6.1.5.]6. What is Process Capability? [6.1.6.]2. Test Product for Acceptability: Lot Acceptance Sampling [6.2.]1. What is Acceptance Sampling? [6.2.1.]2. What kinds of Lot Acceptance Sampling Plans (LASPs) are there? [6.2.2.]3. How do you Choose a Single Sampling Plan? [6.2.3.]1. Choosing a Sampling Plan: MIL Standard 105D [6.2.3.1.]2. Choosing a Sampling Plan with a given OC Curve [6.2.3.2.]4. What is Double Sampling? [6.2.4.]5. What is Multiple Sampling? [6.2.5.]6. What is a Sequential Sampling Plan? [6.2.6.]7. What is Skip Lot Sampling? [6.2.7.]3. Univariate and Multivariate Control Charts [6.3.]1. What are Control Charts? [6.3.1.]2. What are Variables Control Charts? [6.3.2.]1. Shewhart X-bar and R and S Control Charts [6.3.2.1.]2. Individuals Control Charts [6.3.2.2.]3. Cusum Control Charts [6.3.2.3.]1. Cusum Average Run Length [6.3.2.3.1.]4. EWMA Control Charts [6.3.2.4.]3. What are Attributes Control Charts? [6.3.3.]1. Counts Control Charts [6.3.3.1.]2. Proportions Control Charts [6.3.3.2.]4. What are Multivariate Control Charts? [6.3.4.]1. Hotelling Control Charts [6.3.4.1.]2. Principal Components Control Charts [6.3.4.2.]3. Multivariate EWMA Charts [6.3.4.3.]4. Introduction to Time Series Analysis [6.4.]1. Definitions, Applications and Techniques [6.4.1.]2. What are Moving Average or Smoothing Techniques? [6.4.2.]1. Single Moving Average [6.4.2.1.]2. Centered Moving 8/handbook/pmc/pmc d.htm[6/27/2012 2:35:29 PM]
6. Process or Product Monitoring and Control3. What is Exponential Smoothing? [6.4.3.]1. Single Exponential Smoothing [6.4.3.1.]2. Forecasting with Single Exponential Smoothing [6.4.3.2.]3. Double Exponential Smoothing [6.4.3.3.]4. Forecasting with Double Exponential Smoothing(LASP) [6.4.3.4.]5. Triple Exponential Smoothing [6.4.3.5.]6. Example of Triple Exponential Smoothing [6.4.3.6.]7. Exponential Smoothing Summary [6.4.3.7.]4. Univariate Time Series Models [6.4.4.]1. Sample Data Sets [6.4.4.1.]1. Data Set of Monthly CO2 Concentrations [6.4.4.1.1.]2. Data Set of Southern Oscillations [6.4.4.1.2.]2. Stationarity [6.4.4.2.]3. Seasonality [6.4.4.3.]1. Seasonal Subseries Plot [6.4.4.3.1.]4. Common Approaches to Univariate Time Series [6.4.4.4.]5. Box-Jenkins Models [6.4.4.5.]6. Box-Jenkins Model Identification [6.4.4.6.]1. Model Identification for Southern Oscillations Data [6.4.4.6.1.]2. Model Identification for the CO 2 Concentrations Data [6.4.4.6.2.]3. Partial Autocorrelation Plot [6.4.4.6.3.]7. Box-Jenkins Model Estimation [6.4.4.7.]8. Box-Jenkins Model Diagnostics [6.4.4.8.]1. Box-Ljung Test [6.4.4.8.1.]9. Example of Univariate Box-Jenkins Analysis [6.4.4.9.]10. Box-Jenkins Analysis on Seasonal Data [6.4.4.10.]5. Multivariate Time Series Models [6.4.5.]1. Example of Multivariate Time Series Analysis [6.4.5.1.]5. Tutorials [6.5.]1. What do we mean by "Normal" data? [6.5.1.]2. What do we do when data are "Non-normal"? [6.5.2.]3. Elements of Matrix Algebra [6.5.3.]1. Numerical Examples [6.5.3.1.]2. Determinant and Eigenstructure [6.5.3.2.]4. Elements of Multivariate Analysis [6.5.4.]1. Mean Vector and Covariance Matrix [6.5.4.1.]2. The Multivariate Normal Distribution [6.5.4.2.]3. Hotelling's T squared [6.5.4.3.]1. T2 Chart for Subgroup Averages -- Phase I [6.5.4.3.1.]2. T2 Chart for Subgroup Averages -- Phase II [6.5.4.3.2.]3. Chart for Individual Observations -- Phase I [6.5.4.3.3.]4. Chart for Individual Observations -- Phase II [6.5.4.3.4.]5. Charts for Controlling Multivariate Variability [6.5.4.3.5.]6. Constructing Multivariate Charts [6.5.4.3.6.]5. Principal Components [6.5.5.]1. Properties of Principal Components [6.5.5.1.]2. Numerical Example [6.5.5.2.]6. Case Studies in Process Monitoring [6.6.]1. Lithography Process [6.6.1.]1. Background and Data [6.6.1.1.]2. Graphical Representation of the andbook/pmc/pmc d.htm[6/27/2012 2:35:29 PM]
6. Process or Product Monitoring and Control3. Subgroup Analysis [6.6.1.3.]4. Shewhart Control Chart [6.6.1.4.]5. Work This Example Yourself [6.6.1.5.]2. Aerosol Particle Size [6.6.2.]1. Background and Data [6.6.2.1.]2. Model Identification [6.6.2.2.]3. Model Estimation [6.6.2.3.]4. Model Validation [6.6.2.4.]5. Work This Example Yourself [6.6.2.5.]7. /handbook/pmc/pmc d.htm[6/27/2012 2:35:29 PM]
6.1. Introduction6. Process or Product Monitoring and Control6.1. IntroductionContentsof SectionThis section discusses the basic concepts of statistical processcontrol, quality control and process capability.1.2.3.4.How did Statistical Quality Control Begin?What are Process Control Techniques?What is Process Control?What to do if the process is "Out ofControl"?5. What to do if "In Control" butUnacceptable?6. What is Process /pmc/section1/pmc1.htm[6/27/2012 2:35:35 PM]
6.1.1. How did Statistical Quality Control Begin?6. Process or Product Monitoring and Control6.1. Introduction6.1.1. How did Statistical Quality ControlBegin?HistoricalperspectiveQuality Control has been with us for a long time. Howlong? It is safe to say that when manufacturing began andcompetition accompanied manufacturing, consumers wouldcompare and choose the most attractive product (barring amonopoly of course). If manufacturer A discovered thatmanufacturer B's profits soared, the former tried toimprove his/her offerings, probably by improving thequality of the output, and/or lowering the price.Improvement of quality did not necessarily stop with theproduct - but also included the process used for making theproduct.The process was held in high esteem, as manifested by themedieval guilds of the Middle Ages. These guildsmandated long periods of training for apprentices, andthose who were aiming to become master craftsmen had todemonstrate evidence of their ability. Such procedureswere, in general, aimed at the maintenance andimprovement of the quality of the process.In modern times we have professional societies,governmental regulatory bodies such as the Food and DrugAdministration, factory inspection, etc., aimed at assuringthe quality of products sold to consumers. Quality Controlhas thus had a long history.Science ofstatistics isfairly recentOn the other hand, statistical quality control iscomparatively new. The science of statistics itself goesback only two to three centuries. And its greatestdevelopments have taken place during the 20th century.The earlier applications were made in astronomy andphysics and in the biological and social sciences. It was notuntil the 1920s that statistical theory began to be appliedeffectively to quality control as a result of the developmentof sampling theory.The concept ofqualitycontrol inmanufacturingwas firstThe first to apply the newly discovered statistical methodsto the problem of quality control was Walter A. Shewhartof the Bell Telephone Laboratories. He issued amemorandum on May 16, 1924 that featured a sketch of amodern control section1/pmc11.htm[6/27/2012 2:35:35 PM]
6.1.1. How did Statistical Quality Control Begin?advanced byWalterShewhartContributionsof Dodge andRomig tosamplinginspectionShewhart kept improving and working on this scheme, andin 1931 he published a book on statistical quality control,"Economic Control of Quality of Manufactured Product",published by Van Nostrand in New York. This book set thetone for subsequent applications of statistical methods toprocess control.Two other Bell Labs statisticians, H.F. Dodge and H.G.Romig spearheaded efforts in applying statistical theory tosampling inspection. The work of these three pioneersconstitutes much of what nowadays comprises the theoryof statistical quality and control. There is much more tosay about the history of statistical quality control and theinterested reader is invited to peruse one or more of thereferences. A very good summary of the historicalbackground of SQC is found in chapter 1 of "QualityControl and Industrial Statistics", by Acheson J. Duncan.See also Juran /section1/pmc11.htm[6/27/2012 2:35:35 PM]
6.1.2. What are Process Control Techniques?6. Process or Product Monitoring and Control6.1. Introduction6.1.2. What are Process Control Techniques?Statistical Process Control (SPC)TypicalprocesscontroltechniquesThere are many ways to implement process control. Keymonitoring and investigating tools include:HistogramsCheck SheetsPareto ChartsCause and Effect DiagramsDefect Concentration DiagramsScatter DiagramsControl ChartsAll these are described in Montgomery (2000). This chapterwill focus (Section 3) on control chart methods, specifically:Classical Shewhart Control charts,Cumulative Sum (CUSUM) chartsExponentially Weighted Moving Average (EWMA)chartsMultivariate control chartsUnderlyingconceptsThe underlying concept of statistical process control is basedon a comparison of what is happening today with whathappened previously. We take a snapshot of how the processtypically performs or build a model of how we think theprocess will perform and calculate control limits for theexpected measurements of the output of the process. Then wecollect data from the process and compare the data to thecontrol limits. The majority of measurements should fallwithin the control limits. Measurements that fall outside thecontrol limits are examined to see if they belong to the samepopulation as our initial snapshot or model. Stated differently,we use historical data to compute the initial control limits.Then the data are compared against these initial limits. Pointsthat fall outside of the limits are investigated and, perhaps,some will later be discarded. If so, the limits would berecomputed and the process repeated. This is referred to asPhase I. Real-time process monitoring, using the limits fromthe end of Phase I, is Phase II.Statistical Quality Control ection1/pmc12.htm[6/27/2012 2:35:36 PM]
6.1.2. What are Process Control Techniques?Tools ofstatisticalqualitycontrolSeveral techniques can be used to investigate the product fordefects or defective pieces after all processing is complete.Typical tools of SQC (described in section 2) are:Lot Acceptance sampling plansSkip lot sampling plansMilitary (MIL) Standard sampling plansUnderlyingconcepts ofstatisticalqualitycontrolThe purpose of statistical quality control is to ensure, in a costefficient manner, that the product shipped to customers meetstheir specifications. Inspecting every product is costly andinefficient, but the consequences of shipping non conformingproduct can be significant in terms of customer dissatisfaction.Statistical Quality Control is the process of inspecting enoughproduct from given lots to probabilistically ensure a specifiedquality section1/pmc12.htm[6/27/2012 2:35:36 PM]
6.1.3. What is Process Control?6. Process or Product Monitoring and Control6.1. Introduction6.1.3. What is Process Control?Two typesofinterventionarepossible -one isbased onengineeringjudgmentand theother isautomatedProcess Control is the active changing of the process based onthe results of process monitoring. Once the processmonitoring tools have detected an out-of-control situation,the person responsible for the process makes a change tobring the process back into control.1. Out-of-control Action Plans (OCAPS) detail the actionto be taken once an out-of-control situation is detected.A specific flowchart, that leads the process engineerthrough the corrective procedure, may be provided foreach unique process.2. Advanced Process Control Loops are automatedchanges to the process that are programmed to correctfor the size of the out-of-control k/pmc/section1/pmc13.htm[6/27/2012 2:35:37 PM]
6.1.4. What to do if the process is "Out of Control"?6. Process or Product Monitoring and Control6.1. Introduction6.1.4. What to do if the process is "Out ofControl"?Reactionsto out-ofcontrolconditionsIf the process is out-of-control, the process engineer looks foran assignable cause by following the out-of-control actionplan (OCAP) associated with the control chart. Out-of-controlrefers to rejecting the assumption that the current data are fromthe same population as the data used to create the initialcontrol chart limits.For classical Shewhart charts, a set of rules called the WesternElectric Rules (WECO Rules) and a set of trend rules often areused to determine book/pmc/section1/pmc14.htm[6/27/2012 2:35:37 PM]
6.1.5. What to do if "In Control" but Unacceptable?6. Process or Product Monitoring and Control6.1. Introduction6.1.5. What to do if "In Control" butUnacceptable?In controlmeansprocess ispredictable"In Control" only means that the process is predictable in astatistical sense. What do you do if the process is “incontrol” but the average level is too high or too low or thevariability is unacceptable?ProcessimprovementtechniquesProcess improvement techniques such asexperimentscalibrationre-analysis of historical databasecan be initiated to put the process on target or reduce thevariability.Processmust bestableNote that the process must be stable before it can becentered at a target value or its overall variation can pmc/section1/pmc15.htm[6/27/2012 2:35:38 PM]
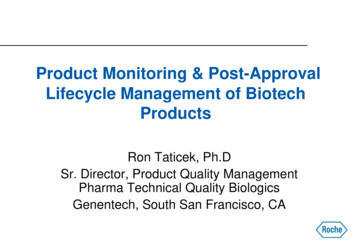
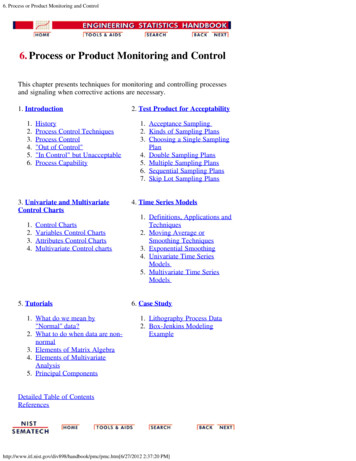
6.1.6. What is Process Capability?6. Process or Product Monitoring and Control6.1. Introduction6.1.6. What is Process Capability?Process capability compares the output of an in-control process to the specificationlimits by using capability indices. The comparison is made by forming the ratio ofthe spread between the process specifications (the specification "width") to thespread of the process values, as measured by 6 process standard deviation units (theprocess "width").Process Capability IndicesA processcapabilityindex usesboth theprocessvariabilityand theprocessspecificationsto determinewhether theprocess is"capable"We are often required to compare the output of a stable process with the processspecifications and make a statement about how well the process meets specification.To do this we compare the natural variability of a stable process with the processspecification limits.A process where almost all the measurements fall inside the specification limits is acapable process. This can be represented pictorially by the plot below:There are several statistics that can be used to measure the capability of a process:Cp , Cpk , Cpm.Most capability indices estimates are valid only if the sample size used is 'largeenough'. Large enough is generally thought to be about 50 independent data values.The Cp , Cpk , and Cpm statistics assume that the population of data values is normallydistributed. Assuming a two-sided specification, if and are the mean tion1/pmc16.htm[6/27/2012 2:35:40 PM]
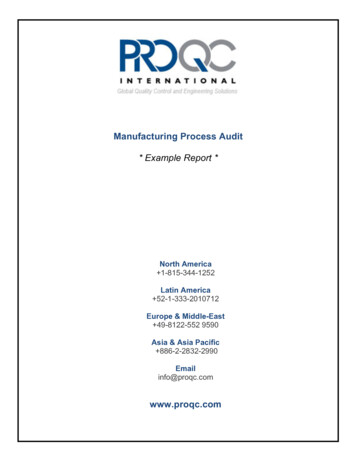
6.1.6. What is Process Capability?standard deviation, respectively, of the normal data and USL, LSL, and T are theupper and lower specification limits and the target value, respectively, then thepopulation capability indices are defined as follows:Definitions ofvariousprocesscapabilityindicesSampleestimates ofcapabilityindicesSample estimators for these indices are given below. (Estimators are indicated witha "hat" over them).The estimator for Cpk can also be expressed as Cpk Cp (1-k), where k is a scaleddistance between the midpoint of the specification range, m, and the process mean,.Denote the midpoint of the specification range by m (USL LSL)/2. The distancebetween the process mean, , and the optimum, which is m, is - m, where. The scaled distance is(the absolute sign takes care of the case whenestimated value, , we estimate by . Note that). To determine the.The estimator for the Cp index, adjusted by the k factor, isSincePlot showingCp for varyingprocesswidths, it follows that.To get an idea of the value of the Cp statistic for varying process widths, considerthe following ction1/pmc16.htm[6/27/2012 2:35:40 PM]
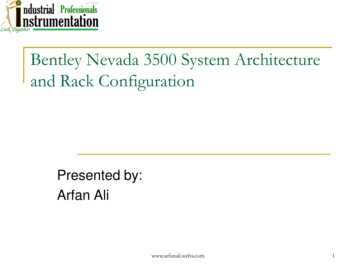
6.1.6. What is Process Capability?This can be expressed numerically by the table below:Translatingcapability into"rejects"USL - LSL681012Cp1.001.331.662.00Rejects.27% 64 ppm .6 ppm 2 ppb% of spec used 100756050where ppm parts per million and ppb parts per billion. Note that the rejectfigures are based on the assumption that the distribution is centered at .We have discussed the situation with two spec. limits, the USL and LSL. This isknown as the bilateral or two-sided case. There are many cases where only thelower or upper specifications are used. Using one spec limit is called unilateral orone-sided. The corresponding capability indices areOne-sidedspecificationsand thecorrespondingcapabilityindicesandwhereandare the process mean and standard deviation, respectively.Estimators of Cpu and Cpl are obtained by replacingrespectively. The following relationship ection1/pmc16.htm[6/27/2012 2:35:40 PM]andbyand s,
6.1.6. What is Process Capability?Cp (Cpu Cpl ) /2.This can be represented pictorially byNote that we also can write:Cpk min {C pl , Cpu}.Confidence Limits For Capability IndicesConfidenceintervals forindicesAssuming normally distributed process data, the distribution of the samplefollows from a Chi-square distribution andandhave distributions relatedto the non-central t distribution. Fortunately, approximate confidence limits relatedto the normal distribution have been derived. Various approximations to thedistribution ofhave been proposed, including those given by Bissell (1990),and we will use a normal approximation.The resulting formulas for confidence limits are given below:100(1- )% Confidence Limits for Cpwhereν degrees of c/section1/pmc16.htm[6/27/2012 2:35:40 PM]
6.1.6. What is Process Capability?ConfidenceIntervals forCpu and CplApproximate 100(1- )% confidence limits for Cpu with sample size n are:with z denoting the percent point function of the standard normal distribution. Ifnot known, set it to .Limits for Cpl are obtained by replacingConfidenceInterval forCpkbyis.Zhang et al. (1990) derived the exact variance for the estimator of Cpk as well as anapproximation for large n. The reference paper is Zhang, Stenback and Wardrop(1990), "Interval Estimation of the process capability index", Communications inStatistics: Theory and Methods, 19(21), 4455-4470.The variance is obtained as follows:LetThenTheir approximation is given c/section1/pmc16.htm[6/27/2012 2:35:40 PM]
6.1.6. What is Process Capability?The following approximation is commonly used in practiceIt is important to note that the sample size should be at least 25 before theseapproximations are valid. In general, however, we need n 100 for capabilitystudies. Another point to observe is that variations are not negligible due to therandomness of capability indices.Capability Index ExampleAn exampleFor a certain process the USL 20 and the LSL 8. The observed process average, 16, and the standard deviation, s 2. From this we obtainThis means that the process is capable as long as it is located at the midpoint, m (USL LSL)/2 14.But it doesn't, since 16. Thefactor is found byandWe would like to haveat least 1.0, so this is not a good process. If possible,reduce the variability or/and center the process. We can compute theFrom this we see that theNote that the formula,and, which is the smallest of the above indices, is 0.6667.is the algebraic equivalent of the min{} definition.What happens if the process is not approximately normally distributed?What you canThe indices that we considered thus far are based on normality of the /section1/pmc16.htm[6/27/2012 2:35:40 PM]
6.1.6. What is Process Capability?do with nonnormal datadistribution. This poses a problem when the process distribution is not normal.Without going into the specifics, we can list some remedies.1. Transform the data so that they become approximately normal. A populartransformation is the Box-Cox transformation2. Use or develop another set of indices, that apply to nonnormal distributions.One statistic is called Cnpk (for non-parametric Cpk ). Its estimator is calculatedbywhere p(0.995) is the 99.5th percentile of the data and p(.005) is the 0.5thpercentile of the data.For additional information on nonnormal distributions, see Johnson and Kotz(1993).There is, of course, much more that can be said about the case of nonnormal data.However, if a Box-Cox transformation can be successfully performed, one isencouraged to use tion1/pmc16.htm[6/27/2012 2:35:40 PM]
6.2. Test Product for Acceptability: Lot Acceptance Sampling6. Process or Product Monitoring and Control6.2. Test Product for Acceptability: LotAcceptance SamplingThis section describes how to make decisions on a lot-by-lotbasis whether to accept a lot as likely to meet requirements orreject the lot as likely to have too many defective units.Contentsof section2This section consists of the following topics.1. What is Acceptance Sampling?2. What kinds of Lot Acceptance Sampling Plans (LASPs)are there?3. How do you Choose a Single Sampling Plan?1. Choosing a Sampling Plan: MIL Standard 105D2. Choosing a Sampling Plan with a given OCCurve4. What is Double Sampling?5. What is Multiple Sampling?6. What is a Sequential Sampling Plan?7. What is Skip Lot mc/section2/pmc2.htm[6/27/2012 2:35:41 PM]
6.2.1. What is Acceptance Sampling?6. Process or Product Monitoring and Control6.2. Test Product for Acceptability: Lot Acceptance Sampling6.2.1. What is Acceptance Sampling?Contributionsof Dodge andRomig toacceptancesamplingAcceptance sampling is an important field of statisticalquality control that was popularized by Dodge and Romigand originally applied by the U.S. military to the testing ofbullets during World War II. If every bullet was tested inadvance, no bullets would be left to ship. If, on the otherhand, none were tested, malfunctions might occur in thefield of battle, with potentially disastrous results.Definintionof LotAcceptanceSamplingDodge reasoned that a sample should be picked at randomfrom the lot, and on the basis of information that wasyielded by the sample, a decision should be made regardingthe disposition of the lot. In general, the decision is either toaccept or reject the lot. This process is called LotAcceptance Sampling or just Acceptance Sampling."Attributes"(i.e., defectcounting)will beassumedAcceptance sampling is "the middle of the road" approachbetween no inspection and 100% inspection. There are twomajor classifications of acceptance plans: by attributes ("go,no-go") and by variables. The attribute case is the mostcommon for acceptance sampling, and will be assumed forthe rest of this section.ImportantpointA point to remember is that the main purpose of acceptancesampling is to decide whether or not the lot is likely to beacceptable, not to estimate the quality of the lot.Scenariosleading toacceptancesamplingAcceptance sampling is employed when one or several ofthe following hold:AcceptanceQualityControl andAcceptanceSamplingIt was pointed out by Harold Dodge in 1969 thatAcceptance Quality Control is not the same as AcceptanceSampling. The latter depends on specific sampling plans,which when implemented indicate the conditions foracceptance or rejection of the immediate lot that is beinginspected. The former may be implemented in the form ofan Acceptance Control Chart. The control limits for theAcceptance Control Chart are computed using theTesting is destructiveThe cost of 100% inspection is very high100% inspection takes too ction2/pmc21.htm[6/27/2012 2:35:42 PM]
6.2.1. What is Acceptance Sampling?specification limits and the standard deviation of what isbeing monitored (see Ryan, 2000 for details).Anobservationby HaroldDodgeIn 1942, Dodge stated:".basically the "acceptance quality control" system thatwas developed encompasses the concept of protecting theconsumer from getting unacceptable defective product, andencouraging the producer in the use of process qualitycontrol by: varying the quantity and severity of acceptanceinspections in direct relation to the importance of thecharacteristics inspected, and in the inverse relation to thegoodness of the quality level as indication by thoseinspections."To reiterate the difference in these two approaches:acceptance sampling plans are one-shot deals, whichessentially test short-run effects. Quality control is of thelong-run variety, and is part of a well-designed system forlot acceptance.Anobservationby EdSchillingSchilling (1989) said:Control ofproductquality usingacceptancecontrolchartsAccording to the ISO standard on acceptance control charts(ISO 7966, 1993), an acceptance control chart combinesconsideration of control implications with elements ofacceptance sampling. It is an appropriate tool for helping tomake decisions with respect to process acceptance. Thedifference between acceptance sampling approaches andacceptance control charts is the emphasis on processacceptability rather than on product disposition decisions."An individual sampling plan has much the effect of a lonesniper, while the sampling plan scheme can provide afusillade in the battle for quality ok/pmc/section2/pmc21.htm[6/27/2012 2:35:42 PM]
6.2.2. What kinds of Lot Acceptance Sampling Plans (LASPs) are there?6. Process or Product Monitoring and Control6.2. Test Product for Acceptability: Lot Acceptance Sampling6.2.2. What kinds of Lot Acceptance SamplingPlans (LASPs) are there?LASP is asamplingschemeand a setof rulesA lot acceptance sampling plan (LASP) is a sampling schemeand a set of rules for making decisions. The decision, basedon counting the number of defectives in a sample, can be toaccept the lot, reject the lot, or even, for multiple or sequentialsampling schemes, to take another sample and then repeat thedecision process.Types ofacceptanceplans tochoosefromLASPs fall into the following categories:Single sampling plans:. One sample of items isselected at random from a lot and the disposition of thelot is determined from the resulting information. Theseplans are usually denoted as (n,c) plans for a samplesize n, where the lot is rejected if there are more than cdefectives. These are the most common (and easiest)plans to use although not the most efficient in terms ofaverage number of samples needed.Double sampling plans: After the first sample is tested,there are three possibilities:1. Accept the lot2. Reject the lot3. No decisionIf the outcome is (3), and a second sample is taken, theprocedure is to combine the results of both samples andmake a final decision based on that information.Multiple sampling plans: This is an extension of thedouble sampling plans where more than two samples areneeded to reach a conclusion. The advantage of multiplesampling is smaller sample sizes.Sequential sampling plans: . This is the ultimateextension of multiple sampling where items are selectedfrom a lot one at a time and after inspection of eachitem a decision is made to accept or reject the lot orselect another unit.Skip lot sampling plans:. Skip lot sampling means thatonly a fraction of the submitted lots are pmc/section2/pmc22.htm[6/27/2012 2:35:42 PM]
6.2.2. What kinds of Lot Acceptance Sampling Plans (LASPs) are there?Definitionsof basicAcceptanceSamplingtermsDeriving a plan, within one of the categories listed above, isdiscussed in the pages that follow. All derivations depend onthe properties you want the plan to have. These are describedusing the following terms:Acceptable Quality Le
in 1931 he published a book on statistical quality control, "Economic Control of Quality of Manufactured Product", published by Van Nostrand in New York. This book set the . Statistical Process Control (SPC) Typical process control techniques There are many ways to implement process control