Transcription
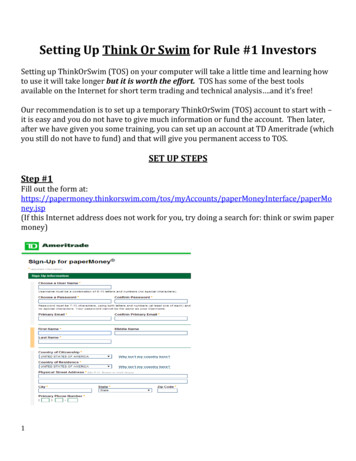
Setting Up Think Or Swim for Rule #1 InvestorsSetting up ThinkOrSwim (TOS) on your computer will take a little time and learning howto use it will take longer but it is worth the effort. TOS has some of the best toolsavailable on the Internet for short term trading and technical analysis .and it’s free!Our recommendation is to set up a temporary ThinkOrSwim (TOS) account to start with –it is easy and you do not have to give much information or fund the account. Then later,after we have given you some training, you can set up an account at TD Ameritrade (whichyou still do not have to fund) and that will give you permanent access to TOS.SET UP STEPSStep #1Fill out the form ts/paperMoneyInterface/paperMoney.jsp(If this Internet address does not work for you, try doing a search for: think or swim papermoney)1
TD Ameritrade, which owns ThinkOrSwim, will send you an email. Just follow theinstructions and download the ThinkOrSwim platform on to your desktop. If you need to,call TOS to get help with their web site and trading platform.Step #2Before logging into TOS, choose “Paper Money” (instead of “Live Trading”) bymoving the toggle button to the right. Then click on the settings icon (a gear orsun looking icon) in the bottom left corner of the log-in box.2
Change the settings to the following (you can always change them back if youdon’t like them):Step #3Log in and close the “Home Screen” by clicking the X in the top left corner.3
Step #4Click on the “Charts” tab and then on the “Prophet” sub tab.Put a stock symbol in the blank box and click “Go.”Click inside the time box (next to “Go”) and choose one year (1 Yr).Click inside the next box and choose one day (D).4
Step #5Chart settings:Step 1. Select, “Chart Settings” in the upper left hand corner (underneath the“Charts” sub tab.Step 2. Change the Graph Type to, “Candle.”Step 3. Click on, “Color Bars.”Step 4. Click on, “Streaming Chart.”5
Select, “Hide” and click on, “Grid Lines.”6
Step #6To draw lines on the chart, click on an icon at the bottom of the chart.In Prophet, select grid lines to change the scaling of your chart if you need to. The secondarrow pointing to the horizontal line is what you can use to draw floors and ceiling on thechart. The diagonal line icons are for drawing trend lines.Left click once to begin the line. Move your cursor across the page and when you have theline where you want it, left click a second time to set the line.Once a line is drawn, you can right click on the line and options for manipulating the linebecome available.7
Step #7To add the technical indicators to your Prophet Chart, click on the “Studies” sub tab andthen click on “Apply Studies.”8
Choose the following studies and give them the following settings:MA Breakout Signals (Moving Average Breakout Signals): 10MACD Hist. Breakout Signals: 8, 17, 9Stochastics with Breakout Signals: 14, 5, 09
To edit the studies, click on the study you want and then click on “Edit Study.”Change the settings to the Rule #1 recommended numbers (on the previous page).10
The Prophet Chart should look something like this after making all the settings.CONCLUSION:There is a brief video on our web site, www.ruleoneinvesting.com, that shows how tocreate the technical indicator (studies) settings on TOS Prophet. To find it, put a stocksymbol into the search box on our web site and that will take you to the STOCK AT AGLANCE page. Look to the left side of the page for the QUICK LINKS box. In that box, lookfor ARROWS CHART and click on it. A video will start up that helps explain the process.Everyone struggles with using TOS to start with. Don’t get discouraged. This is a veryvaluable tool for making money and worth the time to learn how to use it.11
1 Setting Up Think Or Swim for Rule #1 Investors Setting up ThinkOrSwim (TOS) on your computer will take a little time and learning how to use it will take longer but