Transcription
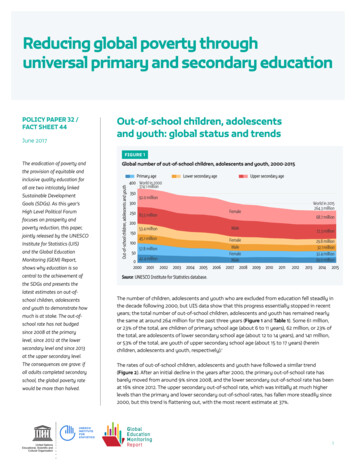
Reducing global poverty throughuniversal primary and secondary educationPOLICY PAPER 32 /FACT SHEET 44June 2017Out-of-school children, adolescentsand youth: global status and trendsFIGURE 1The eradication of poverty andGlobal number of out-of-school children, adolescents and youth, 2000-2015the provision of equitable andPrimary ageall are two intricately linkedSustainable DevelopmentGoals (SDGs). As this year’sHigh Level Political Forumfocuses on prosperity andpoverty reduction, this paper,jointly released by the UNESCOInstitute for Statistics (UIS)and the Global EducationMonitoring (GEM) Report,shows why education is socentral to the achievement ofOut-of-school children, adolescents and youthinclusive quality education forLower secondary ageUpper secondary age400 World in 2000374.1 million35092.0 million300Female250 83.5 million68.7 million2001501005053.4 millionMale45.1 millionFemale57.8 millionMaleFemaleMale42.4 million02000 2001 2002World in 2015264.3 million20032004200520062007200872.3 million29.8 million32.1 million32.4 million29.0 million2009201020112012201320142015Source: UNESCO Institute for Statistics database.the SDGs and presents thelatest estimates on out-ofschool children, adolescentsand youth to demonstrate howmuch is at stake. The out-ofschool rate has not budgedsince 2008 at the primarylevel, since 2012 at the lowersecondary level and since 2013at the upper secondary level.The consequences are grave: ifall adults completed secondaryschool, the global poverty ratewould be more than halved.The number of children, adolescents and youth who are excluded from education fell steadily inthe decade following 2000, but UIS data show that this progress essentially stopped in recentyears; the total number of out-of-school children, adolescents and youth has remained nearlythe same at around 264 million for the past three years (Figure 1 and Table 1). Some 61 million,or 23% of the total, are children of primary school age (about 6 to 11 years), 62 million, or 23% ofthe total, are adolescents of lower secondary school age (about 12 to 14 years), and 141 million,or 53% of the total, are youth of upper secondary school age (about 15 to 17 years) (hereinchildren, adolescents and youth, respectively).iThe rates of out-of-school children, adolescents and youth have followed a similar trend(Figure 2). After an initial decline in the years after 2000, the primary out-of-school rate hasbarely moved from around 9% since 2008, and the lower secondary out-of-school rate has beenat 16% since 2012. The upper secondary out-of-school rate, which was initially at much higherlevels than the primary and lower secondary out-of-school rates, has fallen more steadily since2000, but this trend is flattening out, with the most recent estimate at 37%.1
TABLE 1Out-of-school rates and numbers by SDG region, 2015Out-of-school children of primary school ageRegionNorthern America and EuropeLatin America and the CaribbeanCentral Asia and Southern AsiaEastern Asia and South-eastern AsiaWestern Asia and Northern AfricaSub-Saharan AfricaOceaniaWorldBoth sexes3.24.95.94.110.620.66.68.8Out-of-school rate .85.77.58.19.7GPIA0.860.841.191.021.181.191.23Both sexes2.12.911.06.95.532.60.31.1661.4Out-of-school number 14.817.90.10.129.032.4Out-of-school adolescents of lower secondary school ageRegionOut-of-school rate (%)Out-of-school number (millions)Both sexesMaleFemaleGPIABoth sexesMaleNorthern America and Europe1.8 0.8 Female Latin America and the Caribbean8.08.27.90.962.91.51.4Central Asia and Southern Asia17.919.216.50.8619.911.28.7Eastern Asia and South-eastern Asia9.810.29.30.918.54.63.8Western Asia and Northern Africa14.611.717.61.334.11.72.4Sub-Saharan Africa36.135.137.11.0525.712.613.1Oceania2.1 0.0 World16.416.416.30.9961.932.129.8Both sexesMaleFemaleGPIABoth sexesMaleNorthern America and Europe7.88.37.10.862.91.61.3Latin America and the Caribbean23.624.322.90.947.53.93.6Central Asia and Southern Asia48.847.750.01.0568.935.233.7Eastern Asia and South-eastern Asia21.924.618.90.7717.910.67.4Western Asia and Northern Africa33.132.134.21.068.84.44.4Out-of-school youth of upper secondary school ageRegionOut-of-school rate (%)Out-of-school number (millions)FemaleSub-Saharan Notes: GPIA adjusted gender parity index (female/male out-of-school rate; see Box 1). not available. For Northern America and Europe and for Oceania, male and female out-of-school rates and numbers are not available for 2015.Source: UNESCO Institute for Statistics database.FIGURE 2Global out-of-school rate by age group and sex, 2000-2015Both sexesMaleFemale5250 4845Out-of-school rate (%)In other words, youth are more than fourtimes as likely to be out of school as childrenand more than twice as likely to be out ofschool as adolescents. The high out-of-schoolrates for older cohorts can be explained bypoverty and a variety of other reasons: manyyouth never had a chance to enter schoolwhen they were younger, upper secondaryeducation is often not compulsory, and youthhave a right to employment in most countries(UIS and GEM Report, 2016).Upper secondaryout-of-school rate40373028252320181512100Lower secondaryout-of-school ratePrimary out-of-school rate1610982000 2001 2002 2003 2004 2005 2006 2007 2008 2009 2010 2011 2012 2013 2014 2015Source: UNESCO Institute for Statistics database.POLICY PAPER 32 / FACT SHEET 44 Reducing global poverty through universal primary and secondary education2
The decline in out-of-school rates andnumbers over the past 15 years wasaccompanied by a reduction in genderdisparity at the global level. Historically,girls and young women were more likely tobe excluded from education. However, themale and female out-of-school rates for thelower secondary- and upper secondary-agepopulations are now nearly identical, whilethe gender gap among primary-age childrendropped from more than five percentagepoints in 2000 to less than two percentagepoints in 2015.FIGURE 3GPIA of global out-of-school rate by age group, 2000-2015PrimaryageLowersecondary ageUppersecondary ageGender parity(GPIA 0.97-1.03)1.3 1.31GPIA 1.03:female disadvantage1.2 1.20Adjusted GPIThe world is moving towardsgender parity in out-of-school rates1.161.131.11.020.991.00.92000 2001 2002 2003 2004 2005 2006 2007 2008 2009 2010 2011 2012 2013 2014 2015Notes: GPIA adjusted gender parity index (female/male out-of-school rate; see Box 1).Source: UNESCO Institute for Statistics database.The trend in gender parity can also be seenin the values of the adjusted gender parityindex (GPIA) of the out-of-school rate inFigure 3, a new indicator developed and released by the UIS for the first time in this paper (see Box 1). The adjustedGPI of the global primary out-of-school rate fell from 1.31 in 2000 to a low of 1.11 in 2011, but in recent years, therewas a small uptick, caused by a continued decline of the male out-of-school rate combined with a small increase inthe female out-of-school rate. This means that, globally, girls of primary age are still more likely to be out of schoolcompared to boys.BOX 1Adjusted gender parity indexParity indices are the main indicator used to monitor progress towards SDGtarget 4.5: ‘eliminate gender disparities in education and ensure equal accessto all levels of education and vocational training for the vulnerable, includingpersons with disabilities, indigenous peoples and children in vulnerablesituations’. The most widely known index of this kind is the gender parityindex (GPI). The GPI is calculated by dividing the female value of an indicatorby the male value. If both values are the same, the GPI has a value of 1. Toallow small variations in indicator values, gender parity is usually assumed toexist at values between 0.97 and 1.03.However, the GPI is an imperfect measure because it is not symmetricalaround 1 and has no upper limit, with a theoretical range of 0 to infinity. Forexample, if the female primary net enrolment rate (NER) is 40% and the maleNER is 50%, the GPI has a value of 0.8. If the female and male values arereversed, the GPI has a value of 1.25, which gives the mistaken impressionof greater gender disparity because 1.25 is at a greater distance from 1 than0.8. With small indicator values, the GPI can also take on very high values, faroutside the usual 0 to 2 range.To address these disadvantages, the UIS has developed an adjusted GPI(GPIA) that is symmetrical around 1 and limited to a range between 0 and 2.The adjusted GPI is calculated as follows: If female indicator value male indicator value:Adjusted GPI female value / male value If female indicator value male indicator value:Adjusted GPI 2 1 / (female value / male value)If the female value of an indicator is less than or equal to the male value,the unadjusted and adjusted GPI are identical. If the female value is greaterthan the male value, the adjusted GPI is systematically smaller than theunadjusted GPI. Taking the example above, a female NER of 50% and a maleNER of 40% yields an adjusted GPI of 1.2, which is the same distance from 1as the value 0.8, in contrast to the unadjusted GPI value of 1.25.For the out-of-school rate, an adjusted GPI greater than 1 means that girls aremore likely to be out of school than boys and thus at a relative disadvantage,whereas a value below 1 means that boys are more likely to be out of schooland thus at a relative disadvantage. As with the unadjusted GPI, values of theadjusted GPI between 0.97 and 1.03 are interpreted to indicate gender parity.POLICY PAPER 32 / FACT SHEET 44 Reducing global poverty through universal primary and secondary education3
In contrast, the most recent values of the adjusted GPI for the lower secondary and upper secondary out-of-schoolrates are in the gender parity range between 0.97 and 1.03, meaning that males and females in these age groups havethe same probability of being out of school.It is important to note that global averages mask disparities at the regional and country levels, which are discussedbelow. In many countries, girls of all ages face considerable barriers to education.Regional and national out-of-school figuresThe global out-of-school figures hide large regional differences. The section that follows presents data for the regionsused to monitor the SDGs (see Box 2).Sub-Saharan Africa has thehighest out-of-school ratesAs in previous years, sub-SaharanAfrica remains the region with thehighest out-of-school rates for allage groups (see Table 1 and Figure5). Of the 61 million out-of-schoolchildren, 33 million, or more thanhalf, live in sub-Saharan Africa.Central Asia and Southern Asiahas the second highest numberof out-of-school children with 11million. Sub-Saharan Africa also hasthe highest rate of exclusion, with21% of children denied the right toeducation, followed by WesternAsia and Northern Africa (11%) andOceania (7%).The global lower secondary out-ofschool rate (16%) is nearly twice ashigh as the primary out-of-schoolrate, but because it is calculated fora smaller age cohort, the globalnumber of out-of-school adolescents(62 million) is only slightly higherthan the number of out-of-schoolchildren.BOX 2SDG regionsThis analysis applies a new set of regional groupings that are used to monitor theSDGs, including the education goal (SDG 4). It is important to note that they aredifferent from the 10 regions used to monitor the Millennium Development Goalsbetween 2000 and 2015. For SDG monitoring, the world is divided into the sevenregions displayed in Figure 4.FIGURE 4Sustainable Development Goal regionsSustainable Development Goal regionsNorthern America and EuropeCentral Asia and Southern AsiaWestern Asia and Northern AfricaOceaniaLatin America and the CarribbeanEastern Asia and South-eastern AsiaSub-Saharan AfricaNotes: The depiction and use of boundaries and related data shown on this map are notwarranted to be error free nor do they necessarily imply official endorsement oracceptance by UNESCO.Source: UNESCO Institute for Statistics database.Three regions are home to nine out of ten out-of-school adolescents: sub-Saharan Africa (26 million), Central Asia andSouthern Asia (20 million) and Eastern and South-eastern Asia (8.5 million). Sub-Saharan Africa is also the region withthe highest rate of out-of-school adolescents (36%), followed by Central and Southern Asia (18%), and Western Asiaand Northern Africa (15%).In all regions, out-of-school rates and numbers are far higher among youth of upper secondary age than amongyounger cohorts. In total, 141 million youth were not in school in 2015, 18 million more than the combined number ofPOLICY PAPER 32 / FACT SHEET 44 Reducing global poverty through universal primary and secondary education4
out-of-school children and adolescents. The largestproportion, 69 million, live in Central Asia andSouthern Asia, a further 34 million in sub-SaharanAfrica, and 18 million in Eastern Asia and Southeastern Asia. More than half of all youth are out ofschool in sub-Saharan Africa (57%), and nearly half ofall youth in Central Asia and Southern Asia (49%).FIGURE 5Out-of-school rate by region and age group, 2015Primary ageLower secondary age2Northern America and Europe384Eastern Asia and South-eastern AsiaGender disparities persist at theregional level105Latin America and the Caribbean228246Central Asia and Southern AsiaIn 2000, 54% of the 374 million out-of-schoolchildren, adolescents and youth were female,according to UIS data. By 2015, the female shareof the global out-of-school population had fallento 50%. However, these global averages maskconsiderable differences at regional and nationallevels.184972OceaniaUpper secondary age3411Western Asia and Northern Africa153321Sub-Saharan Africa9World0361610203037405750Out-of-school rate (%)Primary-age girls face a disadvantage in mostregions, with the exception of Latin America and theCaribbean, and Northern America and Europe, whereboys are more likely to be out of school (Figure 6).Notes: Regions are sorted by the primary out-of-school rate.Source: UNESCO Institute for Statistics database.FIGURE 6GPIA of out-of-school rate by region and age group, 2015 or latest yearPrimary ageLower secondary ageOceania0.64Upper secondary age1.230.681.190.86Central Asia and Southern AsiaSub-Saharan Africa1.051.191.05GPIA 0.97:male disadvantageWestern Asia and Northern AfricaGender parity (GPIA 0.97-1.03)1.121.181.331.06Eastern Asia and South-eastern Asia0.860.860.84Northern America and EuropeLatin America and the Caribbean1.020.910.77GPIA 1.03:female .0211.11.21.3Adjusted GPINotes: GPIA adjusted gender parity index (female/male out-of-school rate; see Box 1). Regions are sorted by the GPIA of the primary out-ofschool rate. For lower secondary age, the GPIA for Northern America and Europe is for 2013 and the GPIA for Oceania is for 2012.Source: UNESCO Institute for Statistics database.POLICY PAPER 32 / FACT SHEET 44 Reducing global poverty through universal primary and secondary education5
The widest gender disparities at primary age are observed in Oceania, with an adjusted GPI of 1.23. Gender parityamong children has only been achieved in one region: Eastern Asia and South-eastern Asia.For lower secondary out-of-school rates, the widest gender disparities are observed in Oceania and in Western Asiaand Northern Africa. In the former region, male adolescents are more likely to be out of school, with an adjusted GPIof 0.64; whereas, in the latter region, females are disadvantaged, with an adjusted GPI of 1.33. No region has achievedgender parity, but Latin America and the Caribbean (adjusted GPI 0.96) and sub-Saharan Africa (adjusted GPI 1.05) areclose to parity for this age group.Among youth, large disparities in favour of females are observed in Oceania (adjusted GPI 0.68), and Eastern Asiaand South-eastern Asia (adjusted GPI 0.77). Central Asia and Southern Asia (adjusted GPI 1.05), Western and Asia andNorthern Africa (1.06), and Latin America and the Caribbean (adjusted GPI 0.94) are close to gender parity.The countries with the highest out-of-school rates are in AfricaTurning to national data, the map in Figure 7 shows that more than one out of five children of primary age are outof school in several countries of sub-Saharan Africa, Western Asia, and Southern Asia. The countries with the highestout-of-school rates include South Sudan (69%), Liberia (62%), Eritrea (61%), Sudan (45%), Equatorial Guinea (43%), andDjibouti (43%).The United States of America is one of the rare countries in Northern America and Europe with a relatively high rateof out-of-school children (5.5%), but the majority of these children are being homeschooled (Redford et al., 2017).FIGURE 7Primary out-of-school rate, 2015 or latest year0% - 5%5% - 10%10% - 20%20% - 40%40% or moreNo dataNotes: The depiction and use of boundaries and related data shown on this map are not warranted to be error free nor do theynecessarily imply official endorsement or acceptance by UNESCO.Source: UNESCO Institute for Statistics database.POLICY PAPER 32 / FACT SHEET 44 Reducing global poverty through universal primary and secondary education6
A few countries have very large out-of-school populationsWhereas Figure 7 displays out-of-school rates, Figure 8 shows countries with 2 or more million out-of-school children,adolescents and youth. Six countries are home to more than one-third of all out-of-school children: Nigeria (8.7 million),Pakistan (5.6 million), India (2.9 million), Sudan (2.7 million), Indonesia (2.6 million) and Ethiopia (2.2 million).It should be noted that, for some countries, reliable estimates for all three age groups are not available. For example,the United Republic of Tanzania only has an estimate of out-of-school children. For other countries with largenumbers of children out of school, such as the Democratic Republic of the Congo, no reliable numbers for any agegroup are available. However, estimates for these countries are included in global out-of-school figures.FIGURE 8Out-of-school population in selected countries by age group, 2015 or latest yearPrimary ageLower secondary ageUpper secondary .8 0.71.20.60.80.60.90.90.60.31.1NigerBurkina FasoMaliMozambiqueAngolaUnited Republic of 61.00.90.60.71.1Syrian Arab RepublicYemen051045Out-of-school population (millions)Notes: Countries with an out-of-school population of 2 million or more are shown. Countries are grouped by SDG region and sorted by the total out-of-schoolpopulation. Data for Mexico, Myanmar, and United Republic of Tanzania refer to 2014. Data for India, Syrian Arab Republic and Yemen refer to 2013. Data for Sudanrefer to 2012. Data for Angola refer to 2011. Data for Nigeria refer to 2010.Source: UNESCO Institute for Statistics database.POLICY PAPER 32 / FACT SHEET 44 Reducing global poverty through universal primary and secondary education7
More than one out of four out-of-school children will never enter a classroomIt is important to keep in mind that not all out-of-school children are permanently excluded from education. Someout-of-school children have attended school in the past but dropped out. Others may attend in the future, while athird group is unlikely ever to set foot in a classroom. Figure 9 presents estimates for the distribution of out-of-schoolchildren based on a new methodology described in Box 3.FIGURE 9School exposure of out-of-school children of primary age by region, 2015Sub-SaharanAfrica3236Central Asia andSouthern Asia56Eastern Asia andSouth-eastern Asia1839Western Asia andNorthern Africa35Oceania35World194220Left school2.1534402.923603805.53350Northern Americaand Europe6.920393211.0274128Latin America andthe Caribbean32.6320.32860Likely to enterschool in the future61.4100% 080Unlikely ever toenter schoolOut-of-schoolchildren (millions)Note: Regions are sorted by the number of out-of-school children.Source: UNESCO Institute for Statistics database.BOX 3Refined methodology for estimates of the out-of-school typologyMore than a decade ago, the UIS developed a methodologyto estimate the distribution of out-of-school children acrossthree main groups with respect to their exposure to education(UIS, 2005):1.2.3.Children who were in school but have since dropped out.Children who were never in school but are expected to enterbeyond the official starting age for primary education.Children who were never in school and are not expectedever to enrol.Generating estimates for this out-of-school typology with aprobability analysis of future entry and non-entry is no easyfeat because of imperfect input data. Another challenge is thatenrolment data are available for most countries, but entrydata are not. Because of these methodological challenges,the estimation of the out-of-school typology is subject tocontinuous refinement at the UIS.In 2016 and 2017, the UIS carried out a thorough reviewof the methodology, which led to several improvements,including a method to derive entry from enrolment and betterprojection of future entry. In contrast to the previous approach,the new methodology also considers re-entry of studentswho had previously dropped out. The typology estimatespublished in this paper are based on this new methodology(UIS, forthcoming).Compared to the methodology used previously by the UIS,the main difference is that, with the new methodology, fewerchildren on average are estimated never to enter school.Whereas in previous years, 40% or more of the out-of-schoolpopulation were estimated to be in this group, according to thenew methodology, less than 30% of all out-of-school childrenare unlikely ever to enrol in school.POLICY PAPER 32 / FACT SHEET 44 Reducing global poverty through universal primary and secondary education8
Globally, 28%, or 17 million, of all out-of-school children have never attended school and will probably never start, ifcurrent trends continue. About 38% of all out-of-school children attended school in the past but did not continue theireducation, and 34% are likely to enter school late and will be over-age for their grade, according to UIS estimates.In sub-Saharan Africa and in Western Asia and Northern Africa, one out of three out-of-school children will probablynever receive any formal education. This is also the case for more than one out of four out-of-school children inCentral Asia and Southern Asia. In Oceania and in Latin America and the Caribbean, most out-of-school children willstart school late. Central Asia and Southern Asia has the highest proportion of early school leavers among childrenout of school. Across this region, more than one in every two out-of-school children started primary school but didnot make it to the last grade.The classification of out-of-school children by past and possible future school attendance yields important insightsfor policy-makers. To be effective, policies must be tailored to address the different situations facing out-of-schoolchildren. If the majority of out-of-school children in a country attended but left school, interventions should focus onreducing the dropout rate. For children who are likely to attend in the future, the goal is to ensure earlier entry intothe education system. The most challenging group of out-of-school children are those who are unlikely ever to attendschool, often because of a perpetuating cycle of lack of education and poverty. The final section of this paper offerssome suggestions for improving the situation of children, adolescents and youth who are excluded from educationbecause of poverty and other factors.Poverty and educationMany studies have shown a strong association between poverty and education regarding both school attendanceand learning outcomes. These links can be observed at the country level and at the level of individuals.Out-of-school rates are highest in poor countriesThe World Bank assigns countries to four groups according to their gross national income (GNI) per capita (WorldBank, 2017). In low-income countries, out-of-school rates are systematically higher than in lower-middle-income,upper-middle-income and high-income countries (see Table 2 and Figure 10). For example, the primary out-of-schoolrate is 19% in low-income countries and 3% in high-income countries. The lower secondary out-of-school rate is 38%and 2%, respectively, and the upper secondary out-of-school rate is 62% and 7%, respectively. As a group, low-incomecountries combined have higher out-of-school rates than all individual SDG regions, except for sub-Saharan Africa,which has a marginally higher primary out-of-school rate.Poverty levels also have a direct impact on gender disparities in education. A comparison of male and female out-ofschool rates shows that, in low-income countries, females are more likely to be out of school than males (see Table 2).This is especially true for youth, where female out-of-school rates are higher in low-income and lower-middle-incomecountries, while male out-of-school rates are higher in upper-middle-income and high-income countries.Low-income countries are home to a disproportionately large share of the global out-ofschool populationLower-middle-income countries (including Bangladesh, India, Indonesia, Nigeria and Pakistan) and upper-middleincome countries (including Brazil and China) are home to the majority of the school-age population.Low-income countries (including Afghanistan, Burkina Faso, Ethiopia, Mali, Mozambique, Niger and the UnitedRepublic of Tanzania) account for a disproportionately large share of the global number of out-of-school children,adolescents and youth. They are home to 13% of the world’s school-age population but 24% of the global populationPOLICY PAPER 32 / FACT SHEET 44 Reducing global poverty through universal primary and secondary education9
TABLE 2Out-of-school rates and numbers by country income level, 2015Out-of-school children of primary school ageOut-of-school rate me levelBoth sexesLow-income countries19.1Lower-middle-income countries9.7Upper-middle-income countries4.3High-income countries2.8World8.8Out-of-school adolescents of lower secondary school ageGPIA1.221.151.090.881.16Out-of-school number (millions)Both 1.21.061.429.032.4Out-of-school rate (%)Income levelOut-of-school number (millions)Both sexesMaleFemaleGPIABoth sexesMaleFemaleLow-income ncome income countries7.47.17.71.078.14.14.1High-income countries1.5 0.6 World16.416.416.30.9961.932.129.8Out-of-school youth of upper secondary school ageOut-of-school rate (%)Income levelOut-of-school number (millions)Both sexesMaleFemaleGPIABoth sexesMaleLow-income iddle-income income countries21.623.919.20.8022.512.99.5High-income 01.772.31.368.7Notes: GPIA adjusted gender parity index (female/male out-of-school rate; see Box 1). not available. For high-income countries, male and female out-of-school rates and numbers are not available for 2015.Source: UNESCO Institute for Statistics database.FIGURE 10Out-of-school rate by income level and age group, 2015Primary age626050Out-of-school rate (%)Upper secondary ageLower secondary age473840302022191910100out of school. By contrast, high-income countries accountfor 11% of the global school-age population and only 2% ofthe global number of out-of-school children, adolescentsand eincome countries income countriesSource: UNESCO Institute for Statistics database.372High-incomecountriesThe correlation between national income and out-ofschool rates can also be observed at the level of individualcountries. Figure 11 plots national GNI per capita againstthe out-of-school rate of children. Low-income countrieshave significantly higher out-of-school rates thancountries at higher levels of national income. Poorercountries not only tend to have higher out-of-schoolrates, they also tend to have larger absolute numbersof out-of-school children, as indicated by the size of thecountry markers in Figure 11. The three countries with thehighest number of out-of-school children – India, Nigeriaand Pakistan – are in the lower-middle-income group ofcountries.POLICY PAPER 32 / FACT SHEET 44 Reducing global poverty through universal primary and secondary education10
Education policy andpoverty reductionFIGURE 11GNI per capita and primary out-of-school rate and number, 2015or latest year70South Sudan60Out-of-school rate (%)On its own, the correlation between per capitaincome and out-of-school rate in Figure 11 isnot evidence of causation, but several studieshave demonstrated that an educated populationis one of the key prerequisites for economicgrowth and poverty reduction. This relationshipwill be examined in more detail in the sectionthat zaniaEthiopia KenyaIndonesiaUSAIndiaEducation is key to the development als, households, communities andGNI per capita, PPP ( )societies. However, as the previous section hasshown, there are about 264 million children,Notes: The size of markers reflects the number of out-of-school children of primary schooladolescents and youth out of school in the world,age. Countries with more than 1 million out-of-school children are identified by na
Source: UNESCO Institute for Statistics database. Adjusted gender parity index BOX 1 Parity indices are the main indicator used to monitor progress towards SDG target 4.5: 'eliminate gender disparities in education and ensure equal access to all levels of education and vocational training for the vulnerable, including