Transcription
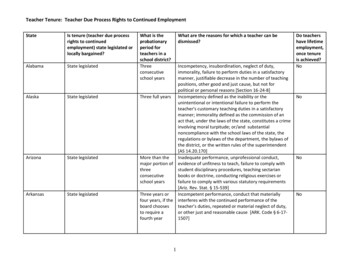
EDUCATIONOhio Teacher Employment and Salary Levels,by School District (Page 1 of 14)Teacher FTEsOhio Median HouseholdIncomeTeacher Average SalaryTeacher Median 2011AdamsAdams County/Ohio Valley Local326.45275.37 21,803 24,509 33,728 50,250 34,268 51,143AllenAllen East Local59.9066.35 31,279 33,750 37,343 46,815 34,229 47,076AllenBath Local113.01107.79 29,926 31,268 41,484 55,679 43,133 54,533AllenBluffton Exempted Village64.3862.07 31,962 33,972 39,995 54,019 39,633 56,563AllenDelphos City65.9063.42 26,961 29,221 39,555 50,351 40,615 43,859AllenElida Local149.64140.55 28,670 29,520 37,736 53,318 39,735 54,286AllenLima City387.67338.99 20,494 20,761 37,420 47,356 37,289 47,245AllenPerry Local46.0050.32 24,369 25,486 37,385 50,506 36,754 40,000AllenShawnee Local138.72149.34 35,733 35,985 38,467 52,646 36,257 53,166AllenSpencerville Local59.3758.66 28,455 30,591 36,629 51,381 36,072 50,485AshlandAshland City222.83229.95 28,600 26,690 43,451 50,895 43,838 49,516AshlandHillsdale Local69.7158.71 31,394 33,462 39,493 56,643 42,189 53,299AshlandLoudonville–Perrysville Exempted Village86.0078.81 27,811 26,259 40,269 52,911 41,157 49,608AshlandMapleton Local67.0060.29 27,820 32,594 38,039 47,110 38,810 45,753AshtabulaAshtabula Area City314.90239.83 23,230 23,897 40,499 51,418 43,750 52,647AshtabulaBuckeye Local127.69115.03 27,006 27,650 41,325 57,102 41,717 58,724AshtabulaConneaut Area City140.95118.36 24,512 23,976 43,828 50,617 42,897 48,450AshtabulaGeneva Area City152.04140.77 25,554 27,810 45,017 58,194 46,387 62,013AshtabulaGrand Valley Local72.9280.23 27,893 27,858 38,471 51,291 40,747 52,685AshtabulaJefferson Area Local115.50114.33 27,586 29,777 40,864 52,170 43,242 53,662AshtabulaPymatuning Valley Local83.7580.07 25,197 25,354 41,045 49,361 41,511 52,087AthensAlexander Local115.00112.75 26,883 30,208 34,626 48,734 35,767 48,972AthensAthens City209.81216.20 24,429 25,328 38,699 55,352 38,866 56,308AthensFederal Hocking Local117.0075.00 26,334-- 33,746 46,280 35,147 48,586AthensNelsonville–York City81.0091.45 20,671 22,301 36,057 45,049 38,239 48,333AthensTrimble Local82.0060.00 20,650 25,401 38,295 52,145 39,444 50,587AuglaizeMinster Local58.1255.40 32,728 36,174 43,995 55,875 46,543 39,882AuglaizeNew Bremen Local54.4954.78 32,387 34,401 44,463 55,234 45,560 50,538AuglaizeNew Knoxville Local29.0031.62 24,592 29,804 33,999 47,637 32,916 38,977AuglaizeSt Marys City150.95140.52 28,739 29,379 39,361 57,536 39,500 55,886AuglaizeWapakoneta City165.02156.52 28,192 30,732 38,364 56,851 40,086 48,067AuglaizeWaynesfield–Goshen Local39.0053.85 30,300 33,436 33,304 39,682 34,486 41,006BelmontBarnesville Exempted Village93.5074.83 21,542 25,788 36,495 45,288 36,918 46,936BelmontBellaire Local103.5087.58 19,619 24,427 39,468 44,892 40,923 46,642BelmontBridgeport Exempted Village57.0052.00 20,828 23,666 32,901 42,279 34,968 44,143BelmontMartins Ferry City87.0090.90 23,984 24,453 36,369 42,697 36,285 45,384BelmontShadyside Local49.9951.50 25,524 28,082 39,020 49,805 37,840 49,476BelmontSt Clairsville–Richland City100.0097.37 27,141 32,289 38,641 51,044 41,685 46,855BelmontUnion Local73.50102.00 23,000 29,500 57,189 48,863 38,507 53,491BrownEastern Local87.0075.15 25,564 30,057 38,498 53,653 39,198 54,658BrownFayetteville–Perry Local54.0053.15 30,817 34,657 31,350 48,333 27,711 49,139BrownGeorgetown Exempted Village69.1263.29 25,373 26,602 38,366 46,712 37,865 46,158BrownRipley–Union–Lewis–Huntington Local80.0080.00 22,738 25,808 33,846 47,816 33,396 48,349BrownWestern Brown Local171.53177.00 26,984 30,351 36,850 55,335 35,758 56,297ButlerEdgewood City193.22204.87 34,713 34,655 38,657 55,160 37,870 54,427ButlerFairfield City490.98490.20 35,986 36,119 44,351 58,628 46,279 58,786ButlerHamilton City586.28524.81 25,851 26,201 40,239 56,551 41,107 59,129ButlerLakota Local872.27911.62 48,423 52,956 40,697 63,505 40,244 63,736ButlerMadison Local95.0093.70 33,597 34,940 35,043 50,765 33,665 52,491ButlerMiddletown City505.01437.85 27,596 24,456 42,471 58,683 44,437 61,256ButlerMonroe Local 39,909 40,952 54,489 42,053 51,919ButlerNew Miami 0 29,41150.5049.20 24,932 23,399 41,902 48,262 40,087 47,093Ross Local136.10151.81 33,630 38,502 41,409 57,137 42,082 56,620Talawanda City166.70190.00 30,697 33,760 42,040 55,863 40,277 56,869
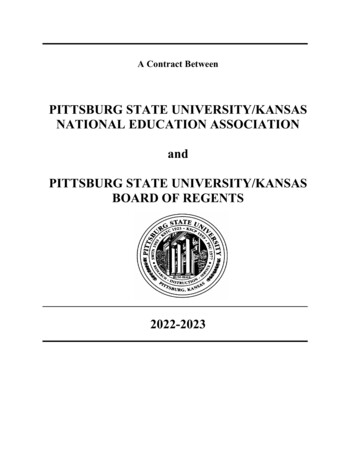
AuglaizeWaynesfield–Goshen Local39.0053.85 30,300 33,436 33,304 39,682 34,486 41,006BelmontBarnesville Exempted Village93.5074.83 21,542 25,788 36,495 45,288 36,918 46,936BelmontBellaire Local103.5087.58 19,619 24,427 39,468 44,892 40,923 46,64257.0052.00 20,828 23,666 32,901 42,279 34,968 44,143BelmontBridgeport Exempted VillageEDUCATIONOhio Teacher Employment and Salary Levels,by School District (Page 2 of 14)BelmontMartins Ferry City87.0090.90 23,984 24,453 36,369 42,697 36,285 45,384BelmontShadyside Local49.9951.50 25,524 28,082 39,020 49,805 37,840 49,476BelmontSt Clairsville–Richland City100.0097.37 27,141 32,289 38,641 51,044 41,685 46,855BelmontUnion Local73.50102.00 23,000 29,500 57,189 48,863 38,507 53,491BrownEastern Local87.0075.15 25,564 30,057 38,498 53,653 39,198 54,658BrownFayetteville–Perry Local54.0053.15 30,817 34,657 31,350 48,333 27,711 49,139BrownGeorgetown Exempted Village69.1263.29 38,366 46,712 37,865 46,158BrownRipley–Union–Lewis–Huntington LocalBrownCountiesButlerWestern Brown LocalDistrictEdgewood CityButler80.00Teacher FTEs80.00171.53177.0020012011 25,373 26,602Ohio Median Household 22,738Income 25,808 33,846Average 47,816TeacherSalary 36,850 55,33520012011 33,396 Median 48,349TeacherSalary 35,758 56,29720012011193.22204.87 26,9842001 34,713 30,3512011 34,655 38,657 55,160 37,870 54,427Fairfield City490.98490.20 35,986 36,119 44,351 58,628 46,279 58,786ButlerHamilton City586.28524.81 25,851 26,201 40,239 56,551 41,107 59,129ButlerLakota Local872.27911.62 48,423 52,956 40,697 63,505 40,244 63,736ButlerMadison Local95.0093.70 33,597 34,940 35,043 50,765 33,665 52,491ButlerMiddletown City505.01437.85 27,596 24,456 42,471 58,683 44,437 61,256ButlerMonroe Local89.71133.20 29,411 39,909 40,952 54,489 42,053 51,919ButlerNew Miami Local50.5049.20 24,932 23,399 41,902 48,262 40,087 47,093ButlerRoss Local136.10151.81 33,630 38,502 41,409 57,137 42,082 56,620ButlerTalawanda City166.70190.00 30,697 33,760 42,040 55,863 40,277 56,869CarrollBrown Local59.0048.00 28,176 29,999 41,397 48,124 45,449 42,639CarrollCarrollton Exempted Village136.30129.00 26,475 27,900 42,860 49,891 44,579 53,001ChampaignGraham Local127.35124.54 32,450 33,437 41,310 57,713 40,923 45,012ChampaignMechanicsburg Exempted Village52.5066.08 30,729 34,416 33,068 48,660 31,263 41,252ChampaignTriad Local66.2772.25 33,164 35,722 37,042 50,516 38,460 47,049ChampaignUrbana City135.68140.48 28,533 27,378 41,085 62,482 43,894 48,711ChampaignWest Liberty–Salem Local70.7582.17 32,190 34,601 39,181 52,885 40,343 52,867ClarkClark–Shawnee Local132.20121.68 34,325 33,090 44,263 63,182 43,528 64,144ClarkGreenon Local116.08108.86 35,094 36,275 36,299 53,152 37,101 51,675ClarkNortheastern Local193.33221.41 35,878 35,599 40,877 52,469 40,785 51,584ClarkNorthwestern Local111.72104.98 31,561 32,829 40,230 53,178 40,003 51,863ClarkSoutheastern Local50.0057.63 28,996 34,525 41,189 49,602 41,553 42,968ClarkSpringfield City669.21458.50 23,901 22,815 37,540 55,025 38,832 58,531ClarkTecumseh Local219.43191.41 28,703 28,837 41,424 57,296 44,295 60,415ClermontBatavia Local106.63122.34 29,908 32,404 41,421 51,345 39,828 44,183ClermontBethel–Tate Local100.00106.63 28,553 30,718 41,349 53,154 43,057 46,352ClermontClermont Northeastern Local112.00104.51 31,517 34,003 40,200 52,184 42,559 41,175ClermontFelicity–Franklin Local72.0066.69 25,251 29,202 36,953 52,838 31,933 46,249ClermontGoshen Local136.00155.77 28,502 31,091 37,032 52,196 34,877 46,830ClermontMilford Exempted Village290.99355.42 36,497 40,748 43,216 60,080 44,948 60,074ClermontNew Richmond Exempted Village139.55158.76 30,031 34,854 56,869 65,094 48,009 66,076ClermontWest Clermont Local487.20463.33 34,155 34,045 45,097 60,784 47,238 59,605ClermontWilliamsburg Local61.7959.07 29,635 31,644 40,217 55,337 39,884 48,617ClintonBlanchester Local98.2999.20 27,170 30,188 35,651 45,690 36,702 46,821ClintonClinton–Massie Local86.00106.75 30,629 38,416 35,341 52,383 37,021 52,597ClintonEast Clinton Local88.9591.85 26,544 28,835 33,770 46,047 34,338 44,956ClintonWilmington City177.50175.92 28,847 29,985 42,657 56,416 44,706 55,161ColumbianaBeaver Local133.00124.58 25,489 29,843 36,999 51,542 41,229 55,551ColumbianaColumbiana Exempted Village61.5073.06 27,647 28,080 38,835 47,692 39,699 41,451ColumbianaCrestview Local67.5071.67 25,980 28,935 38,040 49,543 37,418 49,720ColumbianaEast Liverpool City219.00155.97 21,343 24,477 39,862 49,273 42,722 51,147ColumbianaEast Palestine City82.5073.26 24,625 27,802 38,859 49,919 39,638 48,038ColumbianaLeetonia Exempted Village50.0049.28 25,284 26,534 36,472 45,306 37,317 29,396ColumbianaLisbon Exempted Village68.0070.39 23,499 25,855 41,166 50,009 42,584 46,544ColumbianaSalem City147.00125.42 25,013 25,513 40,961 49,490 43,509 51,650ColumbianaSouthern Local56.0062.61 27,167 28,369 29,643 41,396 31,952 42,572ColumbianaUnited Local86.0083.64 27,413 28,558 39,989 48,397 41,908 48,837ColumbianaWellsville Local74.1058.31 21,916 23,972 35,087 44,822 31,149 49,532CoshoctonCoshocton City108.00121.65 23,965 22,063 43,723 49,976 44,465 51,250CoshoctonRidgewood Local88.9874.57 25,171 27,316 35,968 51,994 32,550 52,098CoshoctonRiver View Local144.80137.93 26,781 28,162 39,612 48,941 41,375 50,099CrawfordBuckeye Central Local 30,249 35,519 46,673 38,452 47,835CrawfordBucyrus .92 28,955123.00114.70 23,326 23,170 36,547 48,065 36,048 49,860Colonel Crawford Local66.1761.82 31,137 31,111 36,709 47,291 34,576 41,908Crestline Exempted Village75.7751.60 24,759 23,656 36,486 45,064 36,774 38,451
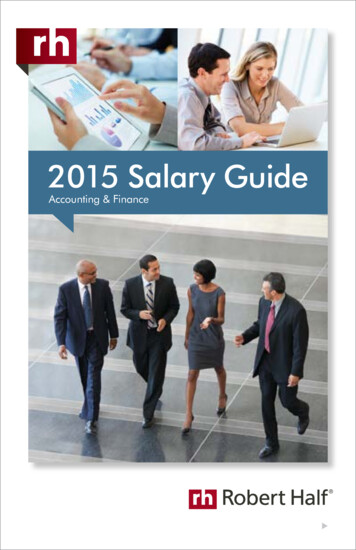
ClermontWilliamsburg Local61.7959.07 29,635 31,644 40,217 55,337 39,884 48,617ClintonBlanchester Local98.2999.20 27,170 30,188 35,651 45,690 36,702 46,821ClintonClinton–Massie Local86.00106.75 30,629 38,416 35,341 52,383 37,021 52,59788.9591.85 26,544 28,835 33,770 46,047 34,338 44,956ClintonEast Clinton LocalEDUCATIONOhio Teacher Employment and Salary Levels,by School District (Page 3 of 14)ClintonWilmington City177.50175.92 28,847 29,985 42,657 56,416 44,706 55,161ColumbianaBeaver Local133.00124.58 25,489 29,843 36,999 51,542 41,229 55,551ColumbianaColumbiana Exempted Village61.5073.06 27,647 28,080 38,835 47,692 39,699 41,451ColumbianaCrestview Local67.5071.67 25,980 28,935 38,040 49,543 37,418 49,720ColumbianaEast Liverpool City219.00155.97 21,343 24,477 39,862 49,273 42,722 51,147ColumbianaEast Palestine City82.5073.26 24,625 27,802 38,859 49,919 39,638 48,038ColumbianaLeetonia Exempted Village50.0049.28 36,472 45,306 37,317 29,396ColumbianaLisbon Exempted VillageColumbianaCountiesColumbianaSalem CityDistrictSouthern LocalColumbianaUnited LocalColumbianaWellsville LocalCoshoctonCoshocton CityCoshoctonRidgewood LocalCoshoctonRiver View LocalCrawfordBuckeye Central LocalCrawfordBucyrus CityCrawford68.00Teacher FTEs70.39147.00125.4220012011 25,284 26,534Ohio Median Household 23,499Income 25,855 41,166Average 50,009TeacherSalary 40,961 49,49020012011 42,584 Median 46,544TeacherSalary 43,509 51,6502001201156.0062.61 25,0132001 27,167 25,5132011 28,369 29,643 41,396 31,952 42,57286.0083.64 27,413 28,558 39,989 48,397 41,908 48,83774.1058.31 21,916 23,972 35,087 44,822 31,149 49,532108.00121.65 23,965 22,063 43,723 49,976 44,465 51,25088.9874.57 25,171 27,316 35,968 51,994 32,550 52,098144.80137.93 26,781 28,162 39,612 48,941 41,375 50,09944.5052.92 28,955 30,249 35,519 46,673 38,452 47,835123.00114.70 23,326 23,170 36,547 48,065 36,048 49,860Colonel Crawford Local66.1761.82 31,137 31,111 36,709 47,291 34,576 41,908CrawfordCrestline Exempted Village75.7751.60 24,759 23,656 36,486 45,064 36,774 38,451CrawfordGalion City133.93128.07 24,624 25,563 41,107 51,238 42,415 49,975CrawfordWynford Local71.0072.70 29,095 30,503 41,111 50,897 38,509 51,578CuyahogaBay Village City146.05152.83 42,574 53,082 46,956 70,636 45,240 68,488CuyahogaBeachwood City143.50130.92 44,568 47,331 58,440 80,203 61,258 84,403CuyahogaBedford City244.00238.52 29,196 29,484 47,953 59,160 50,578 56,847CuyahogaBerea City462.35453.12 31,555 32,411 45,062 63,308 40,758 59,923CuyahogaBrecksville–Broadview Heights City224.96233.60 41,961 44,855 52,487 78,868 54,544 80,292CuyahogaBrooklyn City78.5089.47 28,671 28,380 45,945 60,636 40,329 59,927CuyahogaChagrin Falls Exempted Village123.18134.88 48,262 55,726 48,373 64,623 50,842 57,311CuyahogaCleveland Heights–University Heights City488.53474.83 35,706 37,234 54,278 69,602 54,700 69,650CuyahogaCleveland Municipal City4,868.003,186.80 20,890 22,226 46,257 65,518 48,087 70,170CuyahogaCuyahoga Heights Local59.0059.20 33,922 33,135 59,863 75,261 61,831 62,724CuyahogaEast Cleveland City396.00240.02 18,898 20,242 47,626 58,928 52,808 58,365CuyahogaEuclid City360.00386.90 28,328 27,707 46,538 64,981 43,717 66,518CuyahogaFairview Park City122.65103.32 36,862 36,144 48,070 64,706 50,253 63,896CuyahogaGarfield Heights City195.50208.39 28,735 28,266 47,508 59,791 48,586 59,057CuyahogaIndependence Local69.5084.30 36,983 41,356 51,650 67,665 52,882 66,603CuyahogaLakewood City417.26376.72 32,377 30,130 51,299 66,951 51,867 66,217CuyahogaMaple Heights City244.50235.25 28,817 27,583 40,105 58,700 34,820 58,072CuyahogaMayfield City295.71306.51 33,182 37,100 54,075 77,006 55,388 77,539CuyahogaNorth Olmsted City328.90243.64 34,493 33,973 48,883 68,897 49,621 67,666CuyahogaNorth Royalton City241.70262.99 37,781 38,989 48,927 63,159 51,160 65,829CuyahogaOlmsted Falls City162.27198.37 35,351 40,041 47,996 65,550 48,343 62,348CuyahogaOrange City176.65181.44 57,883 62,811 57,669 81,534 61,274 81,971CuyahogaParma City791.71722.13 30,797 30,549 47,682 61,806 48,118 58,703CuyahogaRichmond Heights Local63.6255.73 33,420 33,008 44,791 63,098 41,659 63,578CuyahogaRocky River City138.40145.08 41,937 41,107 47,700 73,950 42,487 69,727CuyahogaShaker Heights City395.16376.41 42,453 43,664 56,498 73,191 58,948 76,449CuyahogaSolon City322.80312.50 42,380 50,361 53,644 80,400 54,927 81,418CuyahogaSouth Euclid–Lyndhurst City289.70295.30 35,080 36,219 49,030 64,613 49,842 67,218CuyahogaStrongsville City389.92363.69 43,943 42,344 47,324 66,558 49,444 68,916CuyahogaWarrensville Heights City216.00131.69 25,886 25,703 50,631 66,835 54,107 71,637CuyahogaWestlake City239.00257.65 41,860 43,896 52,643 71,274 56,021 71,619DarkeAnsonia Local56.5052.41 26,522 28,500 31,548 48,212 36,602 48,980DarkeArcanum–Butler Local69.0065.38 30,670 31,687 39,183 49,616 40,800 51,130DarkeFranklin Monroe Local40.3642.77 30,454 33,285 39,624 52,275 39,242 48,043DarkeGreenville City221.50197.11 26,042 25,959 38,969 49,302 39,920 54,977DarkeMississinawa Valley Local49.0053.93 23,462 24,539 33,995 48,131 34,597 50,918DarkeTri–Village Local53.7450.75 27,354 29,978 37,697 45,592 36,211 44,307DarkeVersailles Exempted Village79.6381.35 28,748 32,547 42,172 58,628 43,120 59,527DefianceAyersville Local56.1254.59 32,189 33,925 42,215 53,435 41,045 44,897DefianceCentral Local 31,765 53,692 54,226 35,154 54,704DefianceDefiance .78 31,423161.39167.34 27,928 27,760 40,436 51,444 41,563 48,845Hicksville Exempted Village54.8763.73 28,248 28,116 35,741 50,138 36,286 49,800Northeastern Local75.3073.90 34,203 34,398 38,875 50,434 41,433 42,081
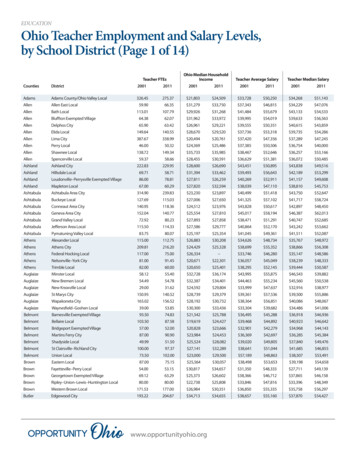
CuyahogaOlmsted Falls City162.27198.37 35,351 40,041 47,996 65,550 48,343 62,348CuyahogaOrange City176.65181.44 57,883 62,811 57,669 81,534 61,274 81,971CuyahogaParma City791.71722.13 30,797 30,549 47,682 61,806 48,118 58,70363.6255.73 33,420 33,008 44,791 63,098 41,659 63,578CuyahogaRichmond Heights LocalEDUCATIONOhio Teacher Employment and Salary Levels,by School District (Page 4 of 14)CuyahogaRocky River City138.40145.08 41,937 41,107 47,700 73,950 42,487 69,727CuyahogaShaker Heights City395.16376.41 42,453 43,664 56,498 73,191 58,948 76,449CuyahogaSolon City322.80312.50 42,380 50,361 53,644 80,400 54,927 81,418CuyahogaSouth Euclid–Lyndhurst City289.70295.30 35,080 36,219 49,030 64,613 49,842 67,218CuyahogaStrongsville City389.92363.69 43,943 42,344 47,324 66,558 49,444 68,916CuyahogaWarrensville Heights City216.00131.69 25,886 25,703 50,631 66,835 54,107 71,637CuyahogaWestlake City239.00257.65 52,643 71,274 56,021 71,619DarkeAnsonia LocalDarkeCountiesDarkeArcanum–Butler LocalDistrictFranklin Monroe Local56.50Teacher FTEs52.4169.0065.3820012011DarkeGreenville CityDarkeDarke 41,860 43,896Ohio Median Household 26,522Income 28,500 31,548Average 48,212TeacherSalary 39,183 49,61620012011 36,602 Median 48,980TeacherSalary 40,800 51,1302001201140.3642.77 30,6702001 30,454 31,6872011 33,285 39,624 52,275 39,242 48,043221.50197.11 26,042 25,959 38,969 49,302 39,920 54,977Mississinawa Valley Local49.0053.93 23,462 24,539 33,995 48,131 34,597 50,918Tri–Village Local53.7450.75 27,354 29,978 37,697 45,592 36,211 44,307DarkeVersailles Exempted Village79.6381.35 28,748 32,547 42,172 58,628 43,120 59,527DefianceAyersville Local56.1254.59 32,189 33,925 42,215 53,435 41,045 44,897DefianceCentral Local52.0968.78 31,423 31,765 53,692 54,226 35,154 54,704DefianceDefiance City161.39167.34 27,928 27,760 40,436 51,444 41,563 48,845DefianceHicksville Exempted Village54.8763.73 28,248 28,116 35,741 50,138 36,286 49,800DefianceNortheastern Local75.3073.90 34,203 34,398 38,875 50,434 41,433 42,081DelawareBig Walnut Local158.50156.23 37,491 42,924 40,264 58,837 40,712 58,626DelawareBuckeye Valley Local110.00134.35 36,655 44,229 43,310 55,000 45,679 54,864DelawareDelaware City257.28294.99 31,447 35,419 42,179 57,373 42,435 57,447DelawareOlentangy Local358.82927.93 58,379 71,487 43,549 63,783 40,093 56,782ErieEdison Local103.5096.39 32,091 32,520 38,400 55,707 38,057 53,775ErieHuron City83.7289.22 35,127 34,674 43,116 56,399 37,941 52,929ErieMargaretta Local76.0076.17 30,416 31,042 47,741 54,239 46,100 50,003EriePerkins Local127.50146.77 32,447-- 45,219 59,959 42,668 60,497ErieSandusky City308.85255.01 22,324 20,818 45,384 59,968 45,256 61,440ErieVermilion Local143.00127.55 32,016 30,944 41,826 58,415 46,420 56,444FairfieldAmanda–Clearcreek Local84.0096.80 30,834 32,367 39,099 49,444 40,636 48,435FairfieldBerne Union Local60.0062.10 28,617 33,119 38,741 48,967 36,892 45,107FairfieldBloom–Carroll Local94.3594.52 35,486 41,624 39,099 53,167 32,564 44,037FairfieldFairfield Union Local96.59102.61 31,710 32,784 43,093 58,203 41,907 54,066FairfieldLancaster City377.66348.08 27,446 27,724 42,568 55,716 45,502 55,399FairfieldLiberty Union–Thurston Local77.0079.59 32,126 36,069 43,640 53,362 43,223 52,575FairfieldPickerington Local407.60561.12 46,683 46,375 47,605 64,072 47,233 64,462FairfieldWalnut Township Local45.4441.62 30,596 30,396 36,456 52,482 34,223 52,179FayetteMiami Trace Local160.60150.97 26,226 29,857 36,280 49,138 35,211 47,160FayetteWashington Court House City135.57138.86 24,345 24,790 38,272 49,076 36,577 51,017FranklinBexley City154.71155.91 43,539 58,020 56,908 74,633 55,355 74,887FranklinCanal Winchester Local132.50223.09 36,347 41,278 37,849 53,544 35,523 52,693FranklinColumbus City4,223.113,215.50 26,769 26,772 45,814 67,167 45,484 69,447FranklinDublin City758.60941.40 48,105 48,313 47,543 69,761 47,267 70,728FranklinGahanna–Jefferson City392.55466.37 40,988 44,747 46,733 67,855 48,176 56,360FranklinGrandview Heights City80.7781.98 33,960 42,687 60,136 70,877 57,915 73,100FranklinGroveport Madison Local332.00326.95 32,781 30,591 46,727 57,777 50,518 56,229FranklinHamilton Local154.00158.50 28,691 28,571 37,739 53,937 35,637 52,374FranklinHilliard City753.53896.91 43,925 47,617 45,352 69,870 42,249 69,367FranklinNew Albany–Plain Local131.75272.34 52,028 68,627 42,533 64,553 39,399 61,309FranklinReynoldsburg City347.06300.35 33,680 33,512 48,937 63,191 41,216 59,303FranklinSouth–Western City1,130.401,204.34 31,209 32,125 45,709 61,180 44,655 61,269FranklinUpper Arlington City380.38431.22 48,169 57,176 54,320 74,874 53,086 70,171FranklinWesterville City753.48813.16 42,197 41,284 51,733 60,681 53,143 58,075FranklinWhitehall City189.00183.39 26,174 23,742 42,427 57,426 39,125 54,965FranklinWorthington City690.30620.92 44,209 43,998 53,353 74,737 49,060 73,297FultonArchbold–Area Local84.2885.28 30,084 32,261 42,664 52,597 43,167 38,876FultonEvergreen Local76.0081.53 30,507 34,372 39,388 51,898 39,132 41,744FultonFayette Local32.2536.03 26,398 26,779 37,426 46,905 31,891 8,827FultonPettisville Local31.1634.68 30,453 32,468 38,800 53,957 33,631 31,641FultonPike–Delta–York Local92.7581.06 29,697 30,384 40,960 53,149 41,420 34,148FultonSwanton Local 35,035 42,628 51,375 45,175 39,012FultonWauseon Exempted Village111.84114.06 29,677 28,640 39,638 56,167 40,957 53,790GalliaGallia County Local181.00153.50 22,423 26,775 36,750 48,609 38,230 52,145GalliaGallipolis City143.44134.15 25,390 28,025 39,964 51,567 43,295 52,845www.opportunityohio.org92.0084.94 32,474
FranklinColumbus City4,223.113,215.50 26,769 26,772 45,814 67,167 45,484 69,447FranklinDublin City758.60941.40 48,105 48,313 47,543 69,761 47,267 70,728FranklinGahanna–Jefferson City392.55466.37 40,988 44,747 46,733 67,855 48,176 56,36080.7781.98 33,960 42,687 60,136 70,877 57,915 73,100FranklinGrandview Heights CityEDUCATIONOhio Teacher Employment and Salary Levels,by School District (Page 5 of 14)FranklinGroveport Madison Local332.00326.95 32,781 30,591 46,727 57,777 50,518 56,229FranklinHamilton Local154.00158.50 28,691 28,571 37,739 53,937 35,637 52,374FranklinHilliard City753.53896.91 43,925 47,617 45,352 69,870 42,249 69,367FranklinNew Albany–Plain Local131.75272.34 52,028 68,627 42,533 64,553 39,399 61,309FranklinReynoldsburg City347.06300.35 33,680 33,512 48,937 63,191 41,216 59,303FranklinSouth–Western City1,130.401,204.34 31,209 32,125 45,709 61,180 44,655 61,269FranklinUpper Arlington City380.38431.22 54,320 74,874 53,086 70,171FranklinWesterville CityFranklinCountiesFranklinWhitehall CityDistrictWorthington City753.48813.16Teacher FTEs189.00183.3920012011Fulton 48,169 57,176Ohio Median Household 42,197Income 41,284 51,733Average 60,681TeacherSalary 42,427 57,42620012011 53,143Median 58,075TeacherSalary 39,125 54,96520012011690.30620.92 26,1742001 44,209 23,7422011 43,998 53,353 74,737 49,060 73,297Archbold–Area Local84.2885.28 30,084 32,261 42,664 52,597 43,167 38,876FultonEvergreen Local76.0081.53 30,507 34,372 39,388 51,898 39,132 41,744FultonFayette Local32.2536.03 26,398 26,779 37,426 46,905 31,891 8,827FultonPettisville Local31.1634.68 30,453 32,468 38,800 53,957 33,631 31,641FultonPike–Delta–York Local92.7581.06 29,697 30,384 40,960 53,149 41,420 34,148FultonSwanton Local92.0084.94 32,474 35,035 42,628 51,375 45,175 39,012FultonWauseon Exempted Village111.84114.06 29,677 28,640 39,638 56,167 40,957 53,790GalliaGallia County Local181.00153.50 22,423 26,775 36,750 48,609 38,230 52,145GalliaGallipolis City143.44134.15 25,390 28,025 39,964 51,567 43,295 52,845GeaugaBerkshire Local76.5567.65 31,306 32,431 43,143 50,587 45,000 54,765GeaugaCardinal Local89.5073.67 26,545 26,911 43,901 57,984 46,577 61,256GeaugaChardon Local164.10181.86 35,726 38,896 46,537 58,113 46,966 55,960GeaugaKenston Local183.71192.30 47,599 51,290 47,289 65,088 45,314 64,501GeaugaLedgemont Local42.5340.68 32,258 37,275 37,309 41,399 34,026 33,833GeaugaNewbury Local53.3747.91 35,445 35,609 40,884 54,944 41,372 55,299GeaugaWest Geauga Local147.59132.30 39,742 41,320 44,789 63,109 41,859 60,399GreeneBeavercreek City359.50445.84 44,977 46,541 47,917 64,304 49,691 61,323GreeneBellbrook–Sugarcreek Local139.78133.40 45,115 49,820 42,053 66,075 40,577 66,012GreeneCedar Cliff Local37.0038.53 28,492 33,744 42,017 50,697 44,773 38,738GreeneFairborn City320.50285.73 28,231 26,594 41,871 56,249 45,462 55,500GreeneGreeneview Local86.1480.81 30,198 35,124 35,978 47,669 36,738 43,913GreeneXenia Community City339.10313.71 27,678 28,742 40,604 57,549 39,984 56,261GreeneYellow Springs Exempted Village50.2549.21 33,871 37,944 43,194 62,801 41,271 49,841GuernseyCambridge City178.50148.72 22,483 22,738 39,872 51,515 40,834 53,833GuernseyEast Guernsey Local72.5063.38 23,190 25,845 38,773 47,180 38,052 45,307GuernseyRolling Hills Local119.00114.00 22,306 24,778 37,744 46,209 40,104 48,670HamiltonCincinnati City2,684.422,007.43 24,420 27,186 52,690 64,638 53,995 66,428HamiltonDeer Park Community City88.9477.30 29,921 33,208 44,155 65,597 41,363 66,943HamiltonFinneytown Local121.8796.70 35,185 36,021 41,593 64,822 40,285 62,697HamiltonForest Hills Local418.12425.40 42,171 48,282 48,677 67,269 49,482 65,659HamiltonIndian Hill Exempted Village157.81153.65 56,248 60,610 48,238 74,457 43,312 69,129HamiltonLockland Local50.0051.00 24,983 22,219 40,970 49,929 35,735 49,349HamiltonLoveland City211.00250.65 43,683 49,161 44,714 66,240 43,409 66,575HamiltonMadeira City95.9999.58 43,484 50,398 47,010 63,872 44,799 62,811HamiltonMariemont City124.99114.13 38,311 44,672 47,194 70,399 47,015 67,020HamiltonMt Healthy City262.70223.79 27,565 28,487 43,275 54,603 44,591 55,134HamiltonNorth College Hill City86.0087.61 28,105 28,039 39,709 57,095 35,123 49,199HamiltonNorthwest Local613.66538.77 33,947 34,302 45,296 55,226 42,982 57,128HamiltonNorwood City172.00148.44 26,247 26,861 45,020 58,858 45,977 54,023HamiltonOak Hills Local430.26458.33 34,573 37,090 46,896 61,540 49,189 62,209HamiltonPrinceton City472.68380.62 34,427 32,429 43,688 68,807 43,328 69,518HamiltonReading Community CityHamiltonSouthwest LocalHamiltonSt Bernard–Elmwood Place CityHamilton87.01102.71 28,757 29,190 41,205 55,829 40,012 53,209198.30179.45 30,685 32,297 45,736 69,344 46,268 70,38272.5266.10 26,051 26,293 45,732 62,652 47,195 64,525Sycamore Community City409.92371.62 44,125 47,867 54,660 73,471 54,638 74,788HamiltonThree Rivers Local116.00114.29 36,208 41,594 43,893 63,349 45,771 63,083HamiltonWinton Woods City264.98231.34 35,022 32,243 44,406 60,762 47,287 63,509HamiltonWyoming City149.49142.12 51,123 60,830 45,518 61,094 40,841 55,878HancockArcadia Local39.0536.83 30,258 33,259 37,349 50,796 35,631 40,475HancockArlington Local41.1846.42 31,741 34,587 38,182 49,702 30,868 34,411HancockCory–Rawson Local 33,332 37,674 50,499 33,106 42,789HancockFindlay 1 30,548427.14365.30 29,520 29,434 41,648 56,750 42,950 55,690Liberty–Benton Local84.2483.62 36,524 36,406 32,412 51,091 35,467 48,414McComb Local55.6758.37 30,247 31,589 35,513 47,123 35,375 41,383
HamiltonLockland Local50.0051.00 24,983 22,219 40,970 49,929 35,735 49,349HamiltonLoveland City211.00250.65 43,683 49,161 44,714 66,240 43,409 66,575HamiltonMadeira City95.9999.58 43,484 50,398 47,010 63,872 44,799 62,811124.99114.13 38,311 44,672 47,194 70,399 47,015 67,020262.70223.79 27,565 28,487 43,275 54,603 44,591 55,13486.0087.61 28,105 28,039 39,709 57,095 35,123 49,199HamiltonMariemont CityEDUCATIONOhio Teacher Employment and Salary Levels,by School District (Page 6 of 14)HamiltonMt Healthy CityHamiltonNorth College Hill CityHamiltonNorthwest Local613.66538.77 33,947 34,302 45,296 55,226 42,982 57,128HamiltonNorwood City172.00148.44 26,247 26,861 45,020 58,858 45,977 54,023HamiltonOak Hills Local430.26458.33 34,573 37,090 46,896 61,540 49,189 62,209HamiltonPrinceton City472.68380.62 34,427 32,429 43,688 68,807 43,328 69,518HamiltonReading Community City87.01102.71 41,205 55,829 40,012 53,209HamiltonSouthwest LocalHamiltonCountiesHamiltonSt Bernard–Elmwood Place CityDistrictSycamore Community CityHamilton198.30179.45Teacher FTEs72.5266.1020012011 28,757 29,190Ohio Median Household 30,685Income 32,297 45,736Average 69,344TeacherSalary 45,732 62,65220012011 46,268Median 70,382TeacherSalary 47,195 64,52520012011409.92371.62 26,0512001 44,125 26,2932011 47,867 54,660 73,471 54,638 74,788Three Rivers Local116.00114.29 36,208 41,594 43,893 63,349 45,771 63,083HamiltonWinton Woods City264.98231.34 35,022 32,243 44,406 60,762 47,287 63,509HamiltonWyoming City149.49142.12 51,123 60,830 45,518 61,094 40,841 55,878HancockArcadia Local39.0536.83 30,258 33,259 37,349 50,796 35,631 40,475HancockArlington Local41.1846.42 31,741 34,587 38,182 49,702 30,868 34,411HancockCory–Rawson Local48.5044.21 30,548 33,332 37,674 50,499 33,106 42,789HancockFindlay City427.14365.30 29,520 29,434 41,648 56,750 42,950 55,690HancockLiberty–Benton Local84.2483.62 36,524 36,406 32,412 51,091 35,467 48,414HancockMcComb Local55.6758.37 30,247 31,589 35,513 47,123 35,375 41,383HancockVan Buren Local55.0063.70 36,452 41,958 38,546 51,152 36,574 42,942HancockVanlue Local30.4020.37 31,664 34,760 26,693 39,401 24,456 28,849HardinAda Exempted Village62.6055.79 27,129 28,856 34,931 49,048 35,441 48,726HardinHardin Northern Local35.7536.78 28,200 32,888 34,992 44,029 39,072 41,576HardinKenton City139.10120.85 25,263 25,840 38,150 52,813 38,469 54,000HardinRidgemont Local43.0040.35 28,684 32,019 31,262 40,591 31,015 39,797HardinRiverdale Local77.0072.82 29,797 32,119 32,580 45,358 33,453 48,187HardinUpper Scioto Valley Local40.3356.94 27,686 29,829 39,976 38,569 34,624 36,420HarrisonConotton Valley Union Local40.0041.00 24,306 28,556 26,490 39,903 25,742 41,564HarrisonHarrison Hills City137.0099.00 21,773 25,678 33,936 45,772 35,437 46,452HenryHolgate Local34.0039.30 28,397 33,037 39,799 50,920 42,557 47,614HenryLiberty Center Local64.5776.43 30,982 35,035 36,996 53,812 37,484 47,293HenryNapoleon Area City154.08134.92 28,890 29,896 37,952 51,715 40,828 52,768HenryPatrick Henry Local66.6364.79 30,324 31,033 39,321 54,474 38,954 45,499HighlandBright Local50.5054.98 25,109 27,686 34,274 45,946 32,382 43,686HighlandFairfield Local46.6551.33 26,725 30,531 34,254 48,163 32,753 47,923HighlandGreenfield Exempted Village122.30120.47 24,360 25,961 38,060 48,913 39,720 50,578HighlandHillsboro City161.00164.93 24,296 26,173 37,922 48,183 39,240
by School District (Page 1 of 14) Teacher FTEs Ohio Median Household Income Teacher Average Salary Teacher Median Salary Counties District 2001 2011 2001 2011 2001 2011 2001 2011. www.opportunityohio.org EDUCATION Ohio Teacher Employment and Salary Levels, Teacher FTEs