Transcription
Proceedings of the 2017 Winter Simulation ConferenceW. K. V. Chan, A. D’Ambrogio, G. Zacharewicz, N. Mustafee, G. Wainer, and E. Page, eds.EFFICIENCY OF NON-COMPLIANCE CHARGEBACK MECHANISMS IN RETAIL SUPPLYCHAINSChun-Miin (Jimmy) ChenSchool of ManagementBucknell UniversityOne Dent DriveLewisburg, PA 17837, USAABSTRACTIn practice, suppliers fill retailers’ purchase orders to the fill-rate targets to avoid the non-compliancefinancial penalty, or chargeback, in the presence of service level agreement. Two chargeback mechanisms– flat-fee and linear – have been proven to effectively coordinate the supply chain in a single-period setting.However, the mechanisms’ efficiency, the incurred penalty costs necessary to coordinate the supply chain,have not been studied yet. Since retailers are often accused of treating chargeback as an additional source ofrevenue, this study compares the expected penalties resulted from the flat-fee or linear chargeback to shedlight on the retailers’ choice of mechanisms. Using experimental scenarios consisting of various demandfunctions, demand variabilities, and fill-rate targets, the simulation results offer counter-evidence to theaccusation.1INTRODUCTIONTo retailers, any non-compliance on product availability can lead to not only operational disruptions but alsorevenue loss. It has been estimated that North American retailers annually lose 158.5 billion in revenuedue to supplier issues, and 4.1% of that loss could be related to out-of-stock non-compliance (Chain StoreAge 2016). To mitigate this issue for its merchandise suppliers, a retailer may create and maintain a servicelevel agreement (SLA) as a reference for the inbound logistics and fulfillment requirements. Ideally, SLAsprovide clear guidance as to how the purchase orders should be fulfilled. A jointly agreed-upon SLAbetween a supplier and a retailer can benefit both parties by enhancing the overall merchandise handlingand customer service (CVS/pharmacy 2016). SLA is a widely-used contract in a variety of industries,especially in the field of retailing (Sinha and Ganesan 2011, Chen 2016). In fact, many SLAs state that, assoon as a supplier acknowledges the business relationship with the retailer and starts to process any orders,the SLA is deemed effective immediately and serves as a binding contract (Toys“R”Us 2013, Kroger 2015).In the presence of an SLA, a retailer can impose a chargeback on its suppliers should they fail to meetthe contractually specified expectations, such as the fill-rate target (Chen and Thomas 2016). Typically, thefill-rate target is defined as a ratio of the shipment quantity received to the shipment quantity ordered withina predetermined time horizon (Thomas 2005). From a retailer’s perspective, a chargeback is a revenue,but from a supplier’s perspective, it is a cost. As a result, the practitioners’ perceptions on chargebackare rarely unanimous. Some think that the chargeback is a way for retailers to recoup their financial lossdue to unsatisfactory service levels, while the others think that the chargeback is just a way for retailersto artificially inflate their own profits (Anderson 2010). Hence, retailers can often be accused of treatingchargebacks as an additional source of revenue (Gilmore 2010, Barry 2013).In practice, chargebacks can be characterized by the mechanisms and terms. The mechanisms indicatethe structure of penalty cost to be flat-fee or linear. Under a flat-fee chargeback, the penalty cost stays978-1-5386-3428-8/17/ 31.00 2017 IEEE3404
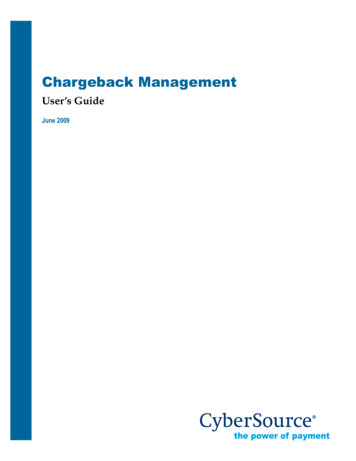
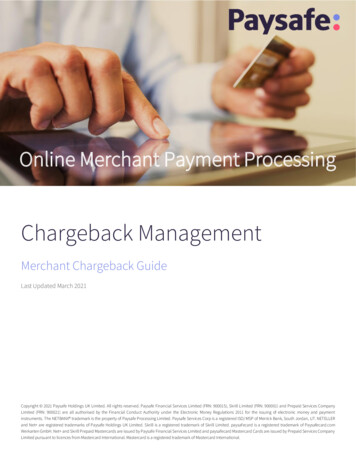
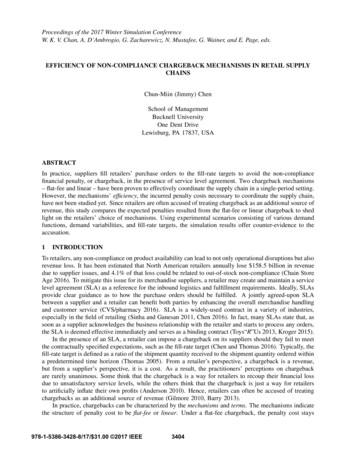
Chenconstant for any non-compliance events, regardless of how much the actual fill rate fell short of thecontractual fill-rate target. In contrast, under a linear chargeback, the penalty cost in any non-complianceevent can linearly vary with the shortfall quantity which is the quantity that was ordered but not receivedin time. The terms of a given mechanism further specify the magnitude of the penalty cost. That is, aflat-fee chargeback would be some constant figure, whereas a linear chargeback would a multiplier to anyshortfall quantity.In terms of supply chain contracts, chargebacks are essentially a transfer payment between a supplierand a retailer in the context of supply-chain coordination. Prior studies have shown that the flat-fee orlinear chargeback can effectively coordinate the supply chains in a single time period setting. Consideringthe case where replenishment lead time is zero, Liang and Atkins (2013) proved the existence of optimalbase-stock levels for minimizing a supplier’s expected cost of flat-fee or linear chargeback. Sieke et al.(2012) analytically established the relation between fill-rate target and chargeback that induces the optimalbase-stock levels. Katok et al. (2008) viewed SLAs as coordination mechanisms and experimentallyinvestigated the implications of SLA parameters on a supplier’s optimal base-stock level. Based on theliterature review, the presumption of our study is that both the flat-fee and linear chargebacks can beeffective mechanisms in supply-chain coordination.Despite its rightful purpose in coordinating the supply chain, the penalty cost assessed as chargebackconcerns many suppliers as the increasingly onerous chargeback of all sorts could amount to a detrimentalshare of a supplier’s annual sales revenue (Anderson 2010). In fact, many suppliers have gone out of businessas a consequence of hefty chargebacks (Rozhon 2005). Assuming that the efficiency of a mechanism isinversely proportional to its resultant expected penalty cost, we believe that a chargeback mechanism shouldbe not only effective but also efficient so that it causes the smallest possible transfer payment between asupplier and a retailer. To the best of our knowledge, little attention has been paid to the efficiency ofchargeback mechanisms.To model empirically grounded chargeback mechanisms and terms, we have sampled 29 SLAs of U.S.retailers that specify flat-fee or linear chargeback as shown in Table 1. Clearly, not all of the retailersTable 1: Observation of SLA chargeback mechanisms and fill-rate target.FrequencyFill-ratetarget 98% 98%Linear chargeback5 (e.g., Lowe’s (2015))0MechanismsFlat-fee chargeback14 (e.g., Nordstrom (2016))10 (e.g., Burlington Stores (2016))use the same chargeback mechanism. Moreover, we suspect that all of the retailers set the chargebackmechanism and fill rate-target as shown in Table 1 for a reason, and our conjecture is that they pair themechanism and the target so as to artificially inflate penalty payments from the supplier. To this end, weherein define the relative efficiency of flat-fee and linear chargebacks as follows:Definition 1 If the expected penalty cost for coordinating the supply chain is smaller under one chargebackmechanism than under the other, then the former has a higher efficiency than the latter.To facilitate the understanding of this study, Figure 1 summarizes the SLA academic literature reviewand the research question of this study. The remainder of this paper is organized as follows: Section 2of this paper presents a simple supply chain model. In Section 3, we present the Monte Carlo simulationanalyses and results. In Section 4, we conclude the paper.2SUPPLY CHAIN MODELINGWe consider a single-period newsvendor model and a simple supply chain consisting of one supplier andone retailer. The retailer places one purchase order in every period. The demand quantity D is a randomvariable that is independent, identically distributed, and stationary across time periods. φ (·) and Φ(·)denote the probability density and cumulative distribution functions of demand, respectively. The retailer3405
ChenFigure 1: Diagram of the academic literature on which this paper is based.measures the single-period fill rate against the target β . The supplier follows a periodic-review, base-stocklevel y inventory policy, and replenishes inventory with negligible lead time. Moreover, the supplier incursthe expected inventory holding cost H and the expected penalty cost Pm . The subscript m { f , u} denotethe flat-fee mechanism, f , and linear chargeback mechanism, u. We can hence write the expected penaltycost as(E [a b(D y)c ] if β D y,Pm (a, b) 0if β D y,where a is the flat-fee chargeback term, b is the linear chargeback term, and c is a binary variable contingentupon the retailer’s chargeback mechanism choice. Particularly, c 0 if m f , and c 1 otherwise.Subsequently, we construct the supplier’s expected total inventory cost, which is the sum of the expectedholding cost and the expected penalty cost (Akcay et al. 2013):Gm (y) H Pm (a, b)Z y h(y x)φ (x)dx 0Z [a b(x y)c ] φ (x)dx,y/βwhere h is the unit holding cost per excess inventory per time period. Next, we verify the convexity of theexpected total inventory cost with respect to the base-stock level by taking the first partial derivative: c Z 1y Gm (y) hΦ(y) φ (y/β ) a b y bc (x y)c 1 φ (x)dx.(1) yββy/βClearly, the first term of (1) increases in y, and the second and third terms of (1) would be negative givenany non-negative values of a and b. That is, the higher the base-stock level, the smaller the expectedpenalty cost. Hence, the total expected cost is a convex function with respect to the base-stock level. Asa result, one can specify φ and Φ before deriving the globally optimal base-stock level y that minimizesthe expected total inventory cost by solving (1) equal to zero.The retailer assumes that the supplier sets the base-stock level using (1). If the retailer’s SLA sets aflat-fee chargeback, i.e. m f , we set b c 0, and the coordinating flat-fee chargeback term isa(y ) hΦ(y )1.(1/β )φ (y /β )3406(2)
ChenSimilarly, if the retailer’s SLA sets a linear chargeback, i.e., m u, we set a 0 and c 1, and thecoordinating linear chargeback term isb(y ) hΦ(y )(y /β )(1/β1. 1)φ (y /β ) 1 Φ(y /β )(3)For (2) and (3), we use ỹ which, on average, warrants the fill-rate target with a single-period reviewhorizon (Chen et al. 2003, Banerjee and Paul 2005, Thomas 2005): Minimum {D, y}ỹ argminE βDy Minimum {D, y} β.subject to EDIn a coordinated supply chain, ỹ can render the same minimized expected holding cost under the twochargeback mechanisms for comparison purposes. Note that we use ỹ instead of y because deriving aclosed-form solution of y from (1) without specific functions for φ and Φ is not straightforward. Moreover,we believe no supplier in practice would intentionally set some base-stock level that is destined to fail thefill-rate target and disappoint its retailer.3MONTE CARLO SIMULATIONSWe use MATLAB codes to simulate penalty costs and holding costs of the supplier facing various demandvariability or functions. Regarding demand variability, McGavin et al. (1993) investigated inventoryallocation policies while setting the retailers’ demand coefficient of variation (CV) to be low (0.1), medium(0.33), or high (1). Waller et al. (1999) found that a retailer’s demand CV can be as high as 2 in practice,but the authors specified CV to be low (0.1), medium (0.5), or high (1.0) for simulation purposes. Similarly,Johnson et al. (1995) in the numerical experiments set CV {0.1, 0.5, 1.0} and Silver et al. (2009) setCV {0.1, 0.3, 0.5}.Regarding demand functions, we consider a number of different probability distribution functions forsimulating random demand as we do not assume any specific product-life-cycle phase or nature of a product.That is, a generic product life cycle includes introduction, growth, maturity, saturation, and decline phases(Aitken et al. 2003). As a product moves from one life-cycle phase to another, the distribution functionof the product demand is likely to change (Graves and Willems 2008). Additionally, product demandvariability can depend on the nature of the product (e.g., functional or innovative) or on the industries (e.g.,consumer product or electronic product) (Fisher 1997, Waller et al. 1999).To generate random demands, we set aside a sample path of 10 million uniformly distributed randomnumbers between 0 and 1 to feed the inverse cumulative distribution functions each corresponding tothe specified demand distribution, a method known as the inverse transform sampling. The distributionparameters are adjusted to yield the desired range of CV and to keep the expected demand constant.3.1 Demand FunctionsWe will use three common distributions – Lognormal, Gamma, and Negative Binomial – to generaterandom demands. We believe these functions reasonably represent a wide variety of demand scenarios thata supplier may face. When enlisting potential demand distribution functions for this study, we considerthose which have been conventionally used for modeling stochastic demands. Additionally, the functionsmust allow us to vary demand CV without altering the expected demand for fair comparisons. For example,Poisson function is popular for modeling slow-moving items, but it does not allow us to vary the demandCV without altering the expected demand.Some notes about the enlisted demand functions are as follow. The Negative Binomial function hasbeen shown to fit a wide variety of empirical demand distributions, particularly at the retail level (Silver3407
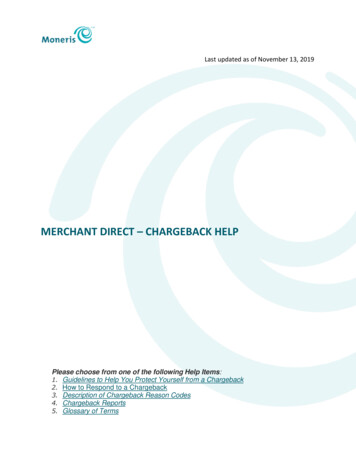
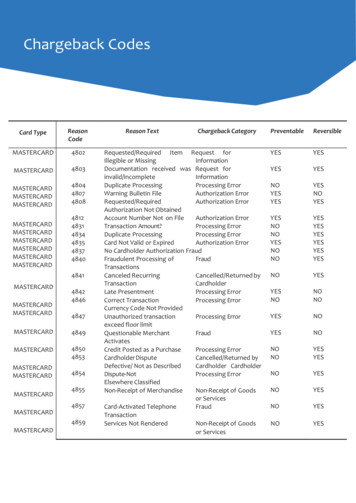
Chenet al. 2012). Specifically, the discrete Negative Binomial distribution function typically represents stochasticdemands of a slow-moving item (Silver et al. 2012). Some other studies that used Negative Binomialfunction are Bagchi et al. (1983), Bagchi et al. (1986), Gallego et al. (2007), Silver et al. (2012), Bijvank(2014). Demands that are highly volatile (large CV) tend to be modeled by Lognormal function (Teunterand Duncan 2009, Huang 2013). Some other studies that used Lognormal function are Das (1983), Johnsonet al. (1995), Gallego et al. (2007), Hsieh and Lu (2010), Berman et al. (2011). Gamma function ishighly flexible and can assume almost any shape, hence ideal for modeling slow-moving items as well asfast-moving items with appropriate scaling of the units of measure (McGavin et al. 1993, Keaton 1995,Tyworth et al. 1996, Ramamurthy et al. 2012). Some other studies that used Lognormal function are Moorsand Strijbosch (2002), Berman et al. (2011). (In fact, we ran the following experiments with truncatedNormal and Uniform functions as well, but the results added little value to our findings, so we decided tonot report them here for the brevity of this study.)3.2 Simulation ExperimentsTo align with the literature, the intended demand CV for this study is between 0.1 and 1. Constrained bythe integer input for the parameter, the Negative Binomial function does not allow consistent CV increment.Thus, we will have irregular CV increments for Negative Binomial function, compared to the other functions.Moreover, only when the expected demand is 100 can we have the demand CV between 0.1 and 1 forNegative Binomial function. Therefore, for every demand distribution besides Negative Binomial, we willadjust the function parameters such that the expected demand always stays at 100. Of the three functions,only Lognormal and Gamma function permit the intended range and consistent increments of CV for thesimulation purposes. Please see Appendix A for the input for the function parameters considered in thesimulation and the resultant range of the flat-fee or linear chargeback terms.First, we examine the effects of distribution function on the supplier’s base-stock level ỹ. Figure 2shows that the functions used for modeling random demands can affect the supplier’s base-stock level,especially when CV is high. For example, ỹ for the Lognormal demand is much larger than that for theGamma demand, which may be attributable to the shape of the function, as discussed in Appendix B.Figure 2: Different demand functions, though with the same expected demand and the same demand CV,can result in different base-stock levels for achieving a 98% fill-rate target.Second, we consider the percentage of the expected penalty cost relative to the expected holding cost: Pm 100%.H3408
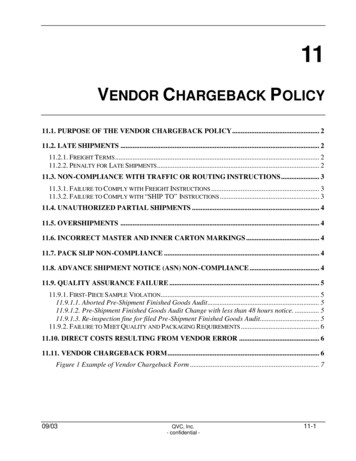
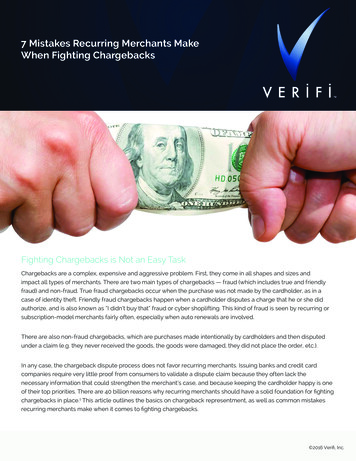
ChenThe measure of the expected costs ratio allows us to focus on the expected penalty costs in contrast tothe expected hold cost rather than the absolute magnitude of the individual expected costs. Without lossof generality, we set h 1. Figure 3 suggests that suppliers facing different demand variabilities mightnot feel the burden of chargeback the same way. In general, an increase in demand variability causes thesupplier to increase its base-stock level to warrant a given fill-rate target. In the experiments, the impactof increasing demand variability on the expected penalty cost tends to be increasingly outweighed by theimpact of the increasing base-stock level on the expected holding cost. As a result, suppliers may feel theheaviest burden of a chargeback if demand variability is low as opposed to high. Comparing the panelsbetween chargeback mechanisms (across columns), we may see that the supplier’s perception of chargebackis less affected by the demand functions when the chargeback is flat-fee than when the chargeback is linear.Comparing the panels between fill-rate targets (across rows), we see that fill-rate target can be a significantfactor that affects how a supplier may perceive the presence of a chargeback relative to holding cost.Figure 3: Given the base-stock levels attaining the specified fill-rate targets, the demand functions can affectthe expected penalty costs as a percentage of the holding cost.Third, we explicitly evaluate the relative efficiency of the chargeback mechanisms by comparing theratios of the expected holding cost to the expected total cost: HH 100%.G f Gu3409
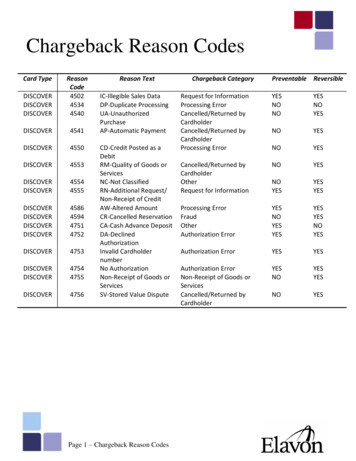
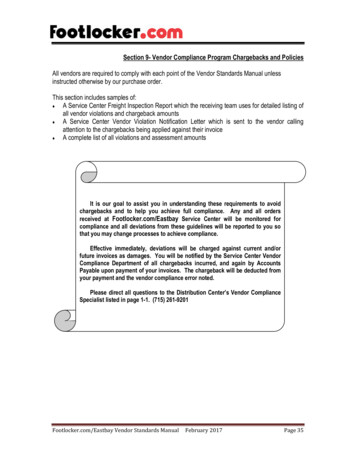
ChenFor example, if the difference is positive, then the flat-fee chargeback mechanism is more efficient thanthe linear chargeback mechanism in coordinating the supply chain. That is, the flat-fee chargeback resultsin a smaller expected penalty cost than does the linear chargeback, all else being equal. As mentioned,Lognormal and Gamma functions not only generate non-negative demands but enable consistent CVincrement between 0.1 and 1; we, therefore, use those two functions to demonstrate the effects of demandCV or fill-rate target on the magnitude or sign of the efficiency difference. Figure 4 clearly shows that, fora given fill-rate target, the retailer facing stable demands may collect larger transfer payments by settinga flat-fee chargeback, whereas the retailer facing volatile demands may collect larger transfer paymentsby setting a linear chargeback. More important, this figure suggests that there could be some relationshipbetween the chargeback mechanism and the fill-rate target, especially when the demands follow a Gammadistribution.Figure 4: Demand variability, distribution, or fill-rate target can affect efficiency of chargeback mechanisms.Finally, we plot a 3-D relative chargeback efficiency to further shed light on the conjecture raised earlierregarding retailers might be treating chargeback as an additional source of revenue. Figure 5 visualizes thesimultaneous influence of the demand CV and the fill-rate target on the efficiencies under a given demanddistribution. The circled dash lines in the panels denote the latitude where the efficiencies of the twomechanisms are equivalent. This figure reaffirms the findings that the effective mechanisms have distinctiveefficiencies in coordinating the supply chains. Most important, Figure 5 shows that the linear chargebackmechanism tends to have a greater efficiency with smaller demand CV and higher fill-rate target. On the3410
Chencontrary, the flat-fee chargeback mechanism tends to have a greater efficiency with larger demand CV andlower fill-rate target. Therefore, the retailers using the linear (flat-fee) chargeback mechanism tend to receivesmaller transfer payments from the supplier if the fill-rate target is higher (lower). Recall the conjecture thatretailers choose the chargeback mechanism and fill-rate target to artificially inflate penalty payments fromthe supplier, our findings suggest otherwise because the retailers in the upper-left or lower-right quadrantsof Table 1 are counterexamples.Figure 5: Lighter yellow areas are where the flat-fee chargeback have higher efficiencies as compared to thelinear chargeback. High demand CV or low fill-rate target tends to render high efficiency for the flat-feechargeback mechanism.4CONCLUSIONThe practice of issuing non-compliance chargeback to suppliers is very common, especially in the retailindustry. However, the retailers are often accused of treating the chargeback as an additional source ofrevenue. Prior studies have proven the effectiveness of the flat-fee and linear chargeback in coordinatingthe supply chains, but little research on the efficiency of the chargeback mechanisms can be found. In thisstudy, we assume the chargeback efficiency is inversely proportional to the expected penalty cost undera single-period newsvendor model consisting of a single supplier and a single retailer. We collected asample of SLAs to identify some pattern with respect to the chargeback mechanism and the fill-rate target.Using various demand functions, demand variabilities and fill-rate targets, we found that the chargebackmechanisms demonstrate distinctive efficiencies and hence should not be underestimated.The key practical implications of the results are as follows. First, the SLA chargebacks tend to bea rather imminent issue to the suppliers that face low demand variability than to the suppliers that facehigh demand variability. While the literature suggests that suppliers generally do not like chargebacks,the suppliers that complain chargebacks the most might not necessarily be those that face volatile retailerdemands. Second, the choice of chargeback mechanisms hold the opportunity of alleviating suppliers’financial burden of chargeback. Many retailers claim that they have no monetary goal regarding chargebacksfor SLA non-compliances. We think the retailers that are not aware of the distinctive efficiencies of themechanisms could unintentionally choose a mechanism that tends to result in penalty costs larger thansome other mechanism does.3411
ChenWe suggest the following directions for future work. Researchers may adopt the framework of this studyand investigate the efficiency of some other chargeback mechanisms. For example, Chen (2016) pointedout that the chargeback mechanisms can be affine (i.e., a combination of flat-fee and linear penalties) ornon-linear (e.g., a convex function of inventory shortage). Another potential extension of this study isusing different research methodologies to triangulate the results of this study. For example, researchers canconduct survey or interview to gain qualitative insights on the reason that different retailers adopt differentchargeback mechanisms.APPENDICESA Function ParametersA.1 Expected DemandAccording to Graves (1985), a Negative Binomial distribution can be written as r j 1φ ( j) pr (1 p) j ,jwhere j denote the number of failures until the experiment is stopped, p denote the success probability, r denotethe number of successes. The expected number of failures can then be written as E[D] µ r(1 p)/p.In the simulations, we want to vary demand CV while controlling the expected demand. That is, the2relationship of p r/(µ r) must hold for a given µ. Considerp the variance (σ ) of demand following2Negative Binomial distribution is r(1 p)/p . Thus, CV (µ r)/(µr). Hence, we will set µ suchthat a range of r are able to generate the range of CV we desire for simulation purposes. For example, ifµ 10, then CV has to be between"rr #10 r11lim, [0.3162, 1.0488] .r 10r10If µ 100, then CV has to be approximately between [0.100, 1.005] which is the desired range of CV forthis study. Thus, we will use µ 100 for the other functions as well throughout this study.A.2 Demand VariabilityOf the three demand functions under consideration, Negative Binomial function is the least flexible interms of adjusting CV without altering the expected demand. Table 2 summarizes the numerical input forthe function parameters to generate CV between 0.1 and 1.005.B Skewness Comparisonp 2The CV of the demands following a Lognormal distributionis eθ 1, where θ denote the scale parameters. 2The skewness of the Lognormal demands is eθ 2 CV . The CV of the demands following a Gamma distribution is 1/ k, where k is the shape parameter. The skewness of the Gamma demands is 2CV.Therefore, for any given CV, Lognormal demand has a greater skewness than does Gamma demand.3412
ChenTable 2: Paired parameter values for generating demand CV between 0.1 and 1.005 and the resultant rangesof the chargebacks.FunctionsParametersPaired imumLognormalLog meanLog standarddeviation? 4.60? 4.380.674.360.704.330.744.310.774.280.80# 4.26# 0.83Flat-fee? 4.92(β 90%)# 279117.40(β 98%)Linear? 0.25(β 90%)# 1112.29(β 98%)GammaShapeScale? 2.372.041.781.561.381.231.11# 1.00? 42.2549.0056.2564.0072.2581.0090.25# 100.00Flat-fee? 4.91(β 90%)# 19311.85(β 98%)Linear? 0.25(β 90%)# 177.86(β 98%)3413Negative BinomialNumber of Prob. of sucsuccessescess event? 10000.00? .000.076.000.065.000.054.000.043.000.032.000.02# 1.00# 0.01N/AFlat-fee(β 90%)# 19593.03(β 98%)Linear? 0.29(β 90%)# 180.36(β 98%)? 5.54
ChenREFERENCESAitken, J., P. Childerhouse, and D. Towill. 2003. “The impact of product life cycle on supply chain strategy”.International Journal of Production Economics 85 (2): 127–140.Akcay, A., B. Biller, and S. Tayur. 2013. “Near optimality guarantees for data-driven newsvendor withtemporally dependent demand: A Monte Carlo approach”. In Proceedings of the 2013 Winter SimulationsConference, edited by R. Pasupathy, S.-H. Kim, A. Tolk, R. Hill, and M. Kuhl, 2643–2653. Piscataway,New Jersey: Institute of Electrical and Electronics Engineers, Inc.Anderson, George. 2010, May. “Clothing vendors take chargeback hit”. Accessed October 6, 2016. ors-take-chargeback-hit/.Bagchi, U., J. C. Hayya, and C.-H. Chu. 1986. “The effect of lead-time variability: The case of independentdemand”. Journal of Operations Management 6 (2): 159–177.Bagchi, U., J. C. Hayya, and J. K. Ord. 1983. “The Hermite distribution as a model of demand during leadtime for slow-moving items”. Decision Sciences 14 (4): 447–466.Banerjee, A., and A. Paul. 2005. “Average fill rate and horizon length”. Operations Research Letters 33(5): 525–530.Curt Barry 2013. “How to make vendor compliance programs work for you”. Accessed February 17, 2017.http://www.rvcf.com/mpage/rvcf link 13 04 04.Berman, O., D. Krass, and M. M. Tajbakhsh. 2011. “On the benefits of risk pooling in inventory management”.Production and operations management 20 (1): 57–71.Bijvank, M. 2014. “Periodic review inventory systems with a service level criterion”. Journal of theOperational Research Society 65 (12): 1853–1863.Burlington Stores 2016. “Domestic Vendor Partnership Manual”. Accessed October 6, 2016. http://www.burlingtoncoatfactory.com/.Chain Store Age 2016, May. “How to increase compliance with shipment consolidation”. Accessed October6, 2016. compliance-shipment-consolidation.Chen, C.-M. J. 2016. “A review and analysis of service level agreements and chargebacks in the retailindustry”. Working paper. Available at SSRN https:// ssrn.com/ abstract 2869939.Chen, C.-M. J., and D. J. Thomas. 2016. “Inventory allocation in the presence of service level agreements”.Working paper. Available at SSRN https:// ssrn.com/ abstract 2867565.Chen, J., D. K. Lin, and D. J. Thomas. 2003. “On the single item fill rate for a finite horizon”. OperationsResearch Letters 31 (2): 119–123.CVS/pharmacy 2016. “Routing Guide & Supplier Compliance Instructions”. Accessed October 6, 2016.http://www.cvssuppliers.com/.Das, C. 1983. “Inventory control for lognormal demand”. Computers & Operations Research 10 (3):267–276.Fisher, M. L. 1997, Mar. “What is the right supply chain for your product?”. Harvard Business Review 75(2): 105–116.Gallego, G., K. Katircioglu, and B. Ramachandran. 2007. “Inventory management under highly uncertaindemand”. Operations Research Letters 35 (3): 281–289.Gilmore, Dan. 2010, May. “Thinking about supply chain chargebacks”. Accessed October 6, 2016. -14.php?cid 3464.Graves, S. C. 1985, 10. “A multi-echelon inventory model for a repairable item with one-for-one replenishment”. Management Science 31 (10): 1247–1256.Graves, S. C., and S. P. Willems. 2008, Spring. “Strategic Inventory Placement in Supply Chains: Nonstationary Demand”. Manufacturing & Service Operations Management 10 (2): 278–287.Hsieh, C.-C., and Y.-T. Lu. 2010. “Manufacturers return policy in a two-stage supply chain with two riskaverse retailers and random demand”. European Journal of Operational Research 207 (1): 514–523.Huang, M.-G. 2013. “Economic ordering model for deteriorating items with random demand and deterioration”. International Journal of Production Research 51 (18): 5612–5624.3414
ChenJohnson, M. E., H. L. Lee, T. Davis, and R. Hall. 1995. “Expressions for item fill rates in periodic inventorysystems”. Naval Research Logistics 42 (1): 57–80.Katok, E., D. Thomas, and A. Davis. 2008. “Inventory service-level agreements as coordination mechanisms:The effect of review periods”. Manufacturing & Service Operations Management 10 (4): 609–624.Keaton, M. 1995. “Using the gamma distribution to model demand when lead time is random”. Journalof Business Logistics 16 (1): 107–131.Kroger 2
School of Management Bucknell University One Dent Drive Lewisburg, PA 17837, USA . (Toys"R"Us 2013,Kroger 2015). In the presence of an SLA, a retailer can impose a chargeback on its suppliers should they fail to meet . In terms of supply chain contracts, chargebacks are essentially a transfer payment between a supplier .