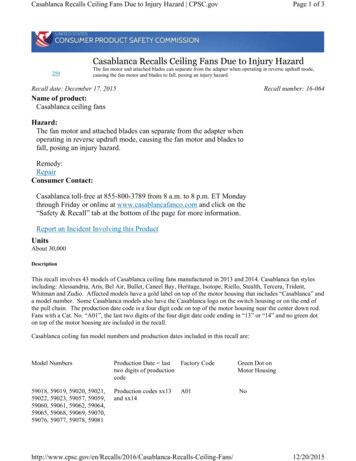
Transcription
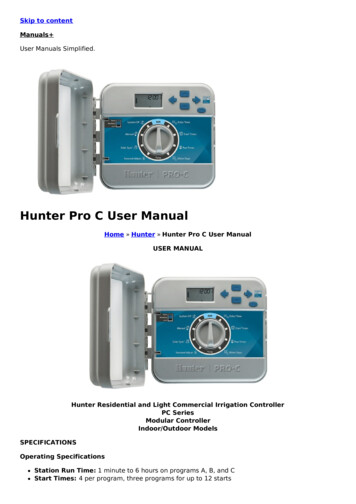
Asia Pacific Research Initiative forSustainable Energy Systems 2015(APRISES15)Office of Naval ResearchGrant Award Number N00014-16-1-2116Ceiling Fan and Thermal ComfortAssessment for Mixed-ModeClassrooms in HawaiʻiTask 7Prepared forHawaiʻi Natural Energy InstitutePrepared byUHM School of Architecture & HNEIFebruary 2021
Ceiling Fan and Thermal Comfort Assessment for Mixed-ModeClassrooms in Hawai‘iFebruary 18, 2021Eileen Peppard1, Arthur James Maskrey21Sustainability2AssociateSpecialist, Sea Grant Center for Smart Building and Community DesignSpecialist, Hawai‘i Natural Energy Institute
This page has been left blank intentionally.
Table of ContentsAcknowledgements . iERDL Team . i1. Introduction . 11.1 The FROG Classrooms’ Mixed-Mode Design. 12. Ceiling Fan and HVAC Use for the University Lab School . 22.1 Frequency of Ceiling Fan and HVAC Use . 32.2 Ceiling Fan Speeds Chosen by Instructors . 42.3 Open windows . 53. Ceiling Fan Occupancy Controls . 64. Ceiling Fan Air Velocities . 75. Thermal Comfort .105.1 Adaptive Comfort Model .135.2. Predicted Mean Vote Comfort Model .185.3 Summary and Conclusions .216. References .237. Appendices .24Appendix A.University Lab School Calendar .24Appendix B.Specification Sheet for Occupancy Sensors and Implementation.25Appendix C.Limitations to the Thermal Comfort Survey .34Appendix D.Summary Notes from Cheug et al. 2019: PMV Model Accuracy .35
This page has been left blank intentionally.
AcknowledgementsPrincipal funding for this project was provided by the Hawai‘i Natural Energy Institute (HNEI)with resources allocated to them from the Office of Naval Research’s, Asia Pacific ResearchInitiative for Sustainable Energy Systems Grant No. N00014-16-1-2116. Other funding has beenprovided by Hawai‘i Sea Grant.Environmental Research and Design LabWendy Meguro, AIA, LEED AP BD C, Director, ERDL; Assistant Professor, School of Architectureand UH Sea Grant; role: create research projects; pursue funding; manage teams; writepublication (first author); conduct outreach.Eileen Peppard, MS, Sustainability Specialist, UH Sea Grant; role: data analyst and projectmanager for ERDL, co-author on publication.Kathryn Paradis, research assistant, M.S., Animal Science; role: database management, dataacquisition, and data analysis for FROG building research and assistance with publications.Justin Delp, IT specialist for UHM Campus Planning Office on overload.Hawaii Natural Energy InstituteRichard E. Rocheleau, PhD, Director.Arthur James Maskrey, MEP, MBA, Principal Investigator.i
1. IntroductionThis report is written to summarize research on the impact of ceiling fans on thermal comfortexperienced in the two mixed-mode FROG buildings on the UH Manoa campus. Both subjectiveand objective data were collected over a period of two years to comprehensively describe fanperformance, fan control preferences, occupant responses to thermal conditions, and tocompare user perceptions with comfort model predictions using measured conditions. Thermalcomfort analyses were performed using ASHRAE 55 Standard [1] adaptive comfort and thepredicted mean vote models and the percentage of people expressing satisfaction in the surveyis compared to the level of satisfaction that would have been predicted by the models. Theresearch found that at least in Hawaii’s tropical climate, the ASHRAE models are inconsistentand sometimes poor predictors of thermal comfort.1.1 The FROG Classrooms’ Mixed-Mode DesignThe two FROG classroom buildings on the University of Hawaii campus are designed to bemixed-mode with many window openings to provide natural ventilation but also an HVACsystem for use when conditions demand. The HVAC thermostat set-point is 77ºF and isdesigned to deliver air at 62ºF to avoid condensation on the supply air registers. Theclassrooms are also equipped with three sets of three ceiling fans, each set with a 7-speedcontroller. With these choices of using natural ventilation, ceiling fans and HVAC, the varyingbehaviors and preferences of the users result in very different operating conditions of thebuildings throughout the weekly schedule and from semester to semester. Each classroom isused by the University Lab School (ULS) for 5th to 8th grade classes in the morning with only oneinstructor every morning and approximately 29 students. This is the most regular part of theschedule. The University of Hawaii instructors use the classrooms in the afternoons andevenings with an intermittent schedule and varying numbers of students. This report willdescribe how the buildings were operated: frequency of ceiling fan use, ceiling fans speeds,HVAC use, and whether windows were left open. The air velocities produced by different ceilingfans speeds was studied and the effect on thermal comfort is discussed. A survey askingoccupants to vote on their level of satisfaction with the thermal conditions in the room wasconducted in FROG1. The results of the survey are matched with the environmental conditionsin the room preceding each vote. The percentage of people expressing satisfaction in thesurvey is compared to the level of satisfaction that would have been predicted by the ASHRAE55 Standard [1] adaptive comfort and the predicted mean vote models.1
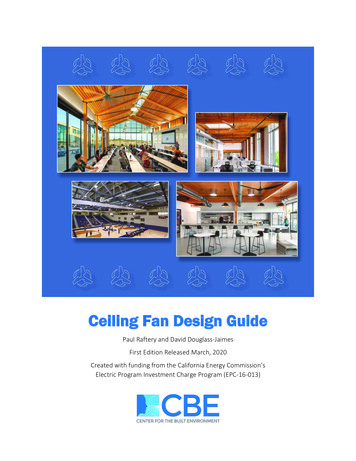
2. Ceiling Fan and HVAC Use for the University Lab SchoolThe FROGs have three sets of three ceiling fans that are metered separately: north set in theentryway, middle and south sets in the classroom (Figure 1) These are Energy Star-rated(Hampton Bay model #52860) 60-inch ceiling fans hung nine feet above the floor. The fanspeed of each row of fans is controlled by a Lutron Maestro controller (canopy module CM-FQ1and wall control MA-FQ4M) with seven speeds. The classroom ceiling is sloped from a height of17 ft on the north side to 12 ft on the south side. The HVAC ducting is to the west side with theair handler in a utility closet and the compressor located outdoors on the west side. TheUniversity Lab School has a regular morning schedule (vs the sporadic afternoon/eveningschedule of the UH classes) and was used in this analysis to capture the hours that areoccupied regularly by the same number of people. Each classroom is managed by a singleinstructor all morning.North fansMiddle fansSouth fansFigure 1. Three banks of fans in FROG buildings: north fans in entryway, middle and south fans in classroom.Parameters and assumptions for the analysis were: Dates: August 8 to December 19, 2019 (see Appendix A for school calendar) Holidays: eleven were removed from dataset Days: Monday-Friday, Hours: 7am-Noon HVAC systems for both buildings were out-of-service until October 31, 2019, so early fall(Aug. 8-Oct 30) was analyzed separately from late fall (Oct 31-Dec 19). The middle bank of ceiling fans was used in the analysis because it is located within theclassroom area; the threshold for “on” was 0.009 kW (fan setting #1 0.01 kW) The HVAC air handler and compressor operate concurrently, but for simplicity, only thecompressor was used in the analysis and the threshold for “on” was 0.03 kW.2
2.1 Frequency of Ceiling Fan and HVAC UseIn FROG1, the ceiling fans were the only option for “cooling” while the AC was out-of-service inthe early fall of 2019 (late August through October 30). They were used 96% of the time and thewindows were open 93% of the time (Table 1). During late fall, after the AC was repaired, theceiling fans were used 94% of the time, the AC was used 56% of the time and the AC andceiling fans were on concurrently 55% of the time (in other words, the ceiling fans were nearlyalways in use when the AC was on). In the late fall the windows were open only 14% of the timeand were rarely left open while the AC was running (2% of the time).Table 1. The percent of time the ceiling fans, the HVAC, and both were on during early fall 2019 and late fall 2019 inFROG1.Ceiling fans onHVAC onHVAC and ceiling fans onWindows openWindows open with HVAC onEarly Fall (HVAC out-of-service)% of Total TimeLate Fall (HVAC repaired)% of Total Time96%0%0%93%0%94%56%55%14%2%In FROG2, the ceiling fans were used 82% of the time in early fall while the HVAC was out ofservice and the windows were open 88% of the time (Table 2). In the late fall a similar usage ofceiling fans (85%) and open windows (86%) prevailed. The HVAC was used only 6% of the time(vs 56% for FROG1). This instructor chose the option of leaving at least one widow open whilethe HVAC was on.Table 2. The percent of time the ceiling fans, the HVAC, and both were on during early fall 2019 and late fall 2019 inFROG2.Ceiling fans onHVAC onHVAC and ceiling fans onWindows openWindows open with HVAC onEarly Fall (HVAC out-of-service)% of Total Time82%0%0%88%0%3Late Fall (HVAC repaired)% of Total Time85%6%6%86%5%
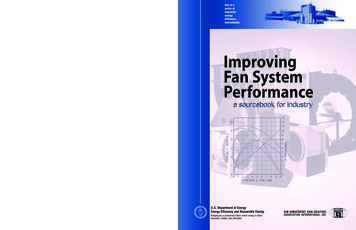
2.2 Ceiling Fan Speeds Chosen by InstructorsEach bank of three ceiling fans has a 7-speed, wall-mounted manual control. The powerconsumption of the bank of three fans in relation to the settings on the controller are as follows:1 0.01 kW, 2 0.02 kW, 3 0.05 kW,4 0.06 kW, 5 0.12 kW, 6 0.20 kW, and 7 0.34kW. The relationship (with P 0.0001) between the fan control setting and power use islogarithmic (Figure 2) with the formula: Fan control setting 1.71857*ln(Power (kW)) 8.69781Figure 2. Logarithmic relationship between fan control setting and power use of one bank of three fans.Anecdotally, we learned that the highest fan speed was too noisy for a teacher to easily hear asoftly-spoken student. This is demonstrated by the data which show that the highest fan speedis rarely chosen. In FROG1 during the early fall when the HVAC was out-of-service, medium tohigh fan settings of #5 and #6 were chosen (Figure 3 top). During late fall, when the HVAC wasrepaired, fan setting #5 was almost exclusively chosen (Figure 3 bottom).Figure 3. Ceiling fan control settings used on the middle fans in FROG1 during early fall (top) and late fall (bottom).4
During early fall in FROG2 (Figure 4 top), setting #6 was clearly favored over setting #5, but inlate fall the two settings were chosen at a similar frequency (Figure 4 bottom). The instructors inthe two buildings had different preferences.Figure 4. Ceiling fan control settings used on the middle fans in FROG2 during early fall (top) and late fall (bottom).2.3 Open windowsIn January 2019, teachers were given additional training in how to maintain indoor air quality.They were told to have either the widows open or the HVAC on to provide fresh air all times (i.e.to not allow a case where there is no fresh air introduced). They were told it was acceptable toleave some windows open while the HVAC was in use. There are contact sensors on the bankof nine windows facing south (Figure 5). The column of three windows closest on the east endare equipped with sensors. If any one of those windows is open, the data acquisition systemregisters the window status as “open”.Figure 5. The bank of nine operable windows on the south side of the buildings. The three windows on theleft side are wired with sensors to indicate if at least one window is open.5
The instructor in FROG1 had the windows open 93% of the time in the early fall and 14% of thetime in late fall. She rarely left the windows open when the HVAC was running ( 2% of time).The instructor in FROG2 had the windows open 88% of the time in the early fall and 86% of thetime in the late fall. She did not use the HVAC often after it was repaired (6% of the time) andusually had at least one window open when she did use it.3. Ceiling Fan Occupancy ControlsIn an effort to prevent fans from being left on overnight or over the weekend, occupancy controlswere installed on ceiling fans in FROG1 (the two banks of three fans within the classroom area).The controls were not compatible with the wireless Lutron control system of the fans and willneed further research. See Appendix B for occupancy sensor specification and implementation.The controls were installed April 19, 2019 and removed April 9, 2020.The hours the fans were left on either overnight or over a weekend were evaluated. The timeperiod of the evaluation was January 1, 2017 to March 10, 2020, just over 3 years 2 months (3.2 yrs).Unlike the analysis in section 1.2, this analysis uses the total ceiling fan power (the sum of thethree banks of fans). The three banks of fans are not necessarily on the same speed when lefton overnight. The threshold for power of 0.03 kW for the total ceiling fan circuit was used todetermine if fans were on.The ceiling fans were left on overnight in FROG1 twice as often as in FROG: 2,355 hrs vs 1,209hrs, respectively (Table 3). The fan speed and therefore the average power level was lower forFROG1 than for FROG2 at 0.109 kW vs 0.182 kW, respectively. See Figure 6 and Figure 7 forfrequency distributions of power consumed by the ceiling fans overnight in each building. Sorather than FROG1 using twice as much energy than FROG2, it used 32% more, 250 kWh vs190 kWh, respectively (Table 3).Table 3. Number of nights and weekends the ceiling fans were left on, the average power used, and the total energyused per year for the FROG buildings over 3.2 years of monitoring.MetricNumber of nights fans left onNumber of these nights that were weekendsTotal number of hours left on overnight/weekendTotal energy consumed overnightsPercent of time left on in the 3.2 yearsAverage power when left onAverage energy (kWh) per year from leaving onFROG1154 nights22 weekend nights2,355 hrs250 kWh8.4%0.109 kW78 kWh/yr6FROG284 nights8 weekend nights1,209 hrs190 kWh4.3%0.182 kW69 kWh/yr
Figure 6. Frequency distribution of ceiling fan power (kW) in FROG1when left on overnight.Figure 7 Frequency distribution of ceiling fan power (kW) in FROG2 when left in overnight.4. Ceiling Fan Air VelocitiesEach ceiling fan setting can create a range of air velocities throughout the room, depending onthe specific location in the room. Air velocities in FROG1 were measured for three minutes at aheight of four feet across a grid in the classroom at one fan speed (the 2020 Q2 report’sAppendix F contained a detailed report). Air velocities measured for fan setting of #4 (medium)on the controller can be seen in Figure 8. For example, under a fan in location B3, velocitiesranged from 40 fpm to 272 fpm, with an average velocity of 113 fpm. Between fans, such aslocation B4, velocities ranged from 23 fpm to 180 fpm, with an average velocity of 97 fpm.Velocities were lower in the perimeters of the classroom but were less likely to have occupantssitting in those areas. Also, row 1 was close to the front wall and is occupied by the instructor’sdesk and podium, so students were not seated in that area. Air velocity experienced by theoccupants can be best characterized by the data within rows 2-6 and columns B-D as indicatedin the red rectangle in Figure 8. The locations directly under the fans (dark blue in the figure)and between fans (light blue) are very distinct. The average velocity directly under a fan was187 fpm and the average velocity between fans was 80 fpm.7
Figure 8. Statistics of air velocity measurements in 30 locations across a grid in the classroom for fan setting #4(medium) on the controller. Row 1 is the “front” of the classroom on the east wall and column E is along the southwall of the classroom.To estimate air velocities created by other fan speed settings, one location under a fan and onelocation between fans were measured and the statistical analyses of velocities can be seen inFigure 9.Figure 9. Statistics of air velocities (fpm) measured under a fan and between two fans at different fansettings.8
The average air velocities (fpm) were plotted against the power use (kW) of a set of fans for thetwo locations in Figure 10. The polynomial equations will be used to predict the air flow in theroom in these two general locations (under a fan and between two fans) when determiningthermal comfort.Figure 10. Plots of average air velocity (fpm) vs fan power (kW) for locations between two fans (left) and under afan (right) with corresponding third degree polynomial equations, R-squared and P-values.9
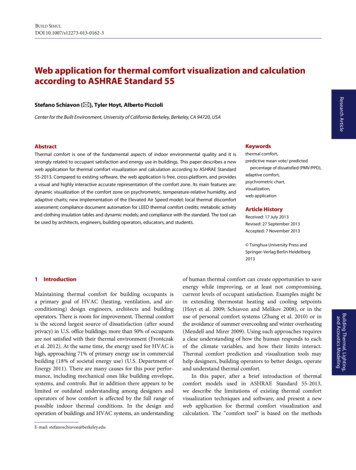
5. Thermal Comfort“comfort, thermal: that condition of mind that expresses satisfaction with thethermal environment and is assessed by subjective evaluation.” – definition,ASHRAE 55 StandardA kiosk (Figure 11) collecting thermal comfort survey responses from occupants in FROG1 wasinstalled on August 26, 2019, and data were collected until March 30, 2020. The question on thesurvey was “How acceptable is the room temperature?” (Figure 12). The possible responseswere on a 7-point Likert scale: highly acceptable, moderately acceptable, slightly acceptable,neutral, slightly unacceptable, moderately unacceptable, and highly unacceptable. Participationwas voluntary and the instructions for participation encouraged the occupant to respond at theend of their class period, so they would be acclimated to the conditions. Only responsessubmitted after 1:00 PM (university users) were analyzed since we do not have InstitutionalReview Board approval for surveying middle school students (minors) who use the classroomsin the mornings.Figure 11. A kiosk made of a tablet on a stand was installed by the door of FROG1 with a sign giving instructionsand a box of consent forms.Figure 12. A screenshot of the question on the tablet. Pressing a box on the screen triggers a “Thank You”message and automatically logs the timestamped response. The screen re-sets to the question in 3 seconds.10
A summary of all 407 responses is shown in Figure 13, with only 34% of the responses in theneutral to highly acceptable categories.Figure 13. Number of responses in each category of acceptability of the room temperature for the duration of thestudy.The HVAC was out-of-service until October 31, 2019. Figure 14 compares the responses frombefore the HVAC was repaired to the responses after it was repaired. The weather was alsocooling off after October and the rate of “acceptable” responses was only 50%.Figure 14. Number of responses in each category of acceptability of the room temperature before and after theHVAC was repaired.The ranges of indoor relative humidity and operative temperature for the votes that wereacceptable vs those that were unacceptable were quite similar, as can be seen in Figure 15.The survey did not have a follow-up question to ask about thermal sensation, so we cannotdetermine if some of the dissatisfied responses were from people feeling too cool. Limitations ofthe survey are described more fully in Appendix C.11
Figure 15. Indoor relative humidity (%) vs operative temperature (F) for each vote cast that was satisfied (left) vsunsatisfied (right).“The purpose of this standard is to specify the combinations of indoor thermal environmentalfactors and personal factors that will produce thermal environmental conditions acceptableto a majority of the occupants within the space” – ASHRAE 55-2017The ASHRAE Standard 55-2017 for Thermal Environmental Conditions for Human Occupancydescribed two main thermal comfort models: (1) the adaptive comfort model was originallydesigned for spaces that are naturally ventilated and have no HVAC system installed; (2) thepredicted mean vote (PMV) model, that was developed to predict thermal comfort inmechanically conditioned spaces. The FROG buildings are mixed-mode, so traditionally thePMV model would be used due to the air conditioning being present. Recently, researchers fromthe UC Berkeley Center for the Built Environment (CBE) and the University of Sydney [2], two ofwhom described the original adaptive comfort model in 1998, analyzed a new global databaseof thermal comfort measurements and concluded that the adaptive comfort model is moreapplicable for mixed-mode buildings than the PMV model. On Sept 1, 2020, Addendum f to thestandard [3] was published, changing the applicability criteria from: “There is no mechanicalcooling system (e.g., refrigerated air conditioning, radiant cooling, or desiccant cooling)installed. No or heating system is “in operation” to “There is no mechanical cooling system (e.g.,refrigerated air conditioning, radiant cooling, or desiccant cooling) or heating system inoperation.” For this analysis of the thermal comfort survey, we compared the responses to whatwas predicted by the two models. Each survey response was matched with the averageconditions in the classroom for the preceding 30 minutes to show the conditions the occupantwas experiencing before responding.Instrumentation used to measure indoor environmental conditions were Automated Logictemperature, humidity, and CO2 sensors (models ZS-H-ALC and ZS-HC-ALC), and a 6-inch12
diameter globe made of copper and painted black matte with a temperature sensor (Kele STR24) inserted inside it. Outdoor weather was collected with a Gill weather station 1723-1B-2111. Power data was measured with a PowerScout 24 meter equipped with Dent Instrumentcurrent transducers. Data was collected in 5-minute intervals using ERDL’s software, lonoa(https://github.com/erdl/lonoa). Thermal comfort survey responses were collected with a tabletkiosk installed by the door of the classroom. Survey data was acquired using ERDL’s software,survey display (https://github.com/erdl/survey display).5.1 Adaptive Comfort ModelThe adaptive thermal comfort model of ASHRAE Standard 55-2017 defines the acceptablethermal conditions for occupant-controlled, naturally ventilated spaces under the followingconditions: a) there is no HVAC system in operation; b) occupants have metabolic rates rangingfrom 1.0 to 1.5; c) occupants are free to adapt their clothing; and d) the prevailing outdoortemperature is greater than 50ºF and less than 92.3ºF. We analyzed the data using the adaptivecomfort model graph in the following conditions (see Figure 16 for work flow) to make acomparison between the model prediction and the actual votes: All votes under all conditions plotted on the graph with the standard 80% acceptabilitylimits for the upper and lower boundaries for the comfort zone, no filtering or adjustmentsfor conditions. Votes filtered for when HVAC was off during the previous 30 minutes in order to analyzeonly the naturally ventilated conditions. Votes when HVAC was off displayed with adjustments to the operative temperatureaccording to the estimated air speed based on middle fans power use. Since it isunknown where the occupant was sitting in the classroom, we will consider threeversions making the assumption:o no elevated air speed included in the model;o air speed calculated for an occupant seated directly under a ceiling fan;o air speed calculated for an occupant seated between two ceiling fans.Figure 16. Work flow for data analyses using the ASHRAE 55 adaptive comfort model.13
The graphic comfort zone method (Figure 17) of the model plots a graph of operativetemperatures on the y-axis and prevailing outdoor air temperatures on the x-axis and definescomfort zone. It defines a comfort zone where 80% of respondents would find the operativetemperature acceptable within upper and lower limit boundary lines set by the followingcalculations:Upper limit in ºF 0.31(prevailing average outdoor temperature) 60.5Lower limit in ºF 0.31(prevailing average outdoor temperature) 47.9The operative temperature is the average of the mean radiant temperature (MRT) and the airtemperature. The MRT was calculated from the temperature globe thermometer in the center ofthe room and the air temperature using the following formula (1) for a standard globe with forcedconvection in EN ISO 7726:2001.MRT [(tg 273)4 2.5 x 10⁸ x va0.6(tg – ta)]1/4 - 273(1)Where tg globe temperature (ºC), va air velocity (m/s), ta air temperature (ºC)The standard defines the prevailing outdoor temperature as the average for the previous sevento 30 days. This analysis used a rolling 14-day average. Figure 17 shows an example of anAdaptive Comfort Model graph with the 90% acceptable range in dark blue and the 80%acceptable range which also includes the areas in light blue.Figure 17. Center for the Built Environment online tool [4, 5] displays the thermal comfort range for the adaptivecomfort model.The thermal comfort survey was deployed on a tablet kiosk in FROG1 from August 26, 2019 toMarch 30, 2020. Votes we considered to be acceptably comfortable were these four responseoptions: highly acceptable, moderately acceptable, slightly acceptable or neutral. Of the 407total overall votes, 138 votes, or 34% were acceptably comfortable responses. When theresponses for filtered for when the HVAC was off, 351 responses remained. When plotted on14
the adaptive comfort graph shown in Figure 18, the color of the point indicates the actualresponse (pink, orange, and red are not acceptable) and the position between the boundarylines would indicate that the conditions would be predicted by the model to be acceptable to80% of respondents. Of the 162 votes where the conditions fell between the boundary lines,47% of those votes were reported as acceptable, indicating that the model was not a goodpredictor of the responses.Figure 18. Thermal comfort votes plotted on the adaptive thermal comfort model’s graph: operative temperature vsprevailing outdoor temperature. The color of the dot indicates the response category. Results from all responses aredisplayed on the left, responses when HVAC was turned off are displayed on the right.The classroom has ceiling fans providing air speeds which affect thermal comfort.Table 4 is drawn from Table 5.4.2.4 of the ASHRAE 55-2017 standard which shows the degreesFahrenheit the upper limit operative temperature increases when the air speed is elevatedabove 59 fpm.Table 4. Degrees Fahrenheit increases in the upper limit for the acceptable temperature in the adaptive comfortmodel with air speeds above 59 fpm.Average air speed 118 fpm2.2ºFAverage air speed 177 fpm3.2ºFAverage air speed 236 fpm4.0ºFThe online CBE Thermal Comfort Tool [4] [5] of the Center for the Built Environment illustrateshow the adaptive comfort graph’s upper limit line is raised with an elevated air speed (Figure 19)compared with the graph without elevated air speed (Figure 17). The degrees of elevation ofthis upper limit is dependent on the air speed between 118 fpm and 236 fpm for operativetemperatures greater than 25ºC.15
Air speed 236fpmFigure 19. The CBE Thermal Comfort Tool for adaptive comfort upper and lower limits for 80% (light blue) and 90%(dark blue) acceptability with an elevated air speed of 236 fpm.No guidance is provided in the ASHRAE 55 standard to adjust for air speeds below 118 fpm,therefore the CBE online Thermal Comfort Tool does not make any thermal comfortadjustments either. For this analysis, the same method is followed with no adjustment if the airspeed is below 118 fpm. Intuitively, one would expect an upward shift in the upper limit ofacceptability with elevated air speeds between 59 fpm and 118 fpm. That said, one researcherexplored the impact of air speed values below 118 fpm in tropical Bangladesh, and found a3.96ºF increase in the upper limit with an air speed of 59 fpm [6].If a uniform elevated air speed was used for the entire time the survey was deployed, the upperboundary line would be raised as shown in Figure 20, similar to what the CBE online tool does(Figure 19).Figure 20. If uniform elevated air speeds of 120 fpm or 200 fpm existed in the classroom, the upper boundary linewould be raised accordinglyFor this analysis and display of results, the upper boundary cannot be raised accordingly to auniform air speed because each vote is cast under different air speed conditions depending on16
whether the ceiling fans were on and which control setting was chosen. Instead of increasingthe upper boundary line, we have adjusted the operative temperature by subtracting theappropriate degrees based on Table 4. The following simple linear regression (2) was used tointerpolate temperature reductions for speeds that fall between air velocities listed in the table,:y 0.0153x 0.04333(2)y number of degrees F to subtract from operative temperaturex air speed (fpm) predicted from ceiling fan power of middle fansFor air speeds abo
2. Ceiling Fan and HVAC Use for the University Lab School The FROGs have three sets of three ceiling fans that are metered separately: north set in the entryway, middle and south sets in the classroom (Figure 1) These are Energy Star-rated (Hampton Bay model #52860) 60-inch ceiling fans hung nine feet above the floor. The fan