Transcription
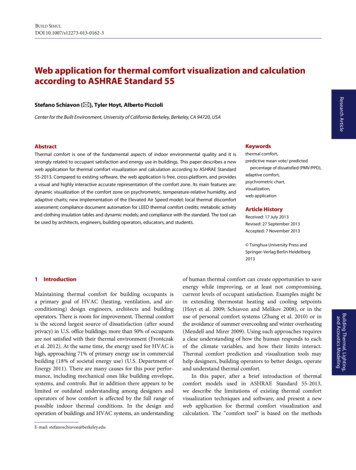
BUILD SIMULDOI 10.1007/s12273-013-0162-3Web application for thermal comfort visualization and calculationaccording to ASHRAE Standard 55Research ArticleStefano Schiavon ( ), Tyler Hoyt, Alberto PiccioliCenter for the Built Environment, University of California Berkeley, Berkeley, CA 94720, USAAbstractKeywordsThermal comfort is one of the fundamental aspects of indoor environmental quality and it isthermal comfort,strongly related to occupant satisfaction and energy use in buildings. This paper describes a newpredictive mean vote/ predictedweb application for thermal comfort visualization and calculation according to ASHRAE Standard55-2013. Compared to existing software, the web application is free, cross-platform, and providesa visual and highly interactive accurate representation of the comfort zone. Its main features are:dynamic visualization of the comfort zone on psychrometric, temperature-relative humidity, andadaptive charts; new implementation of the Elevated Air Speed model; local thermal discomfortpercentage of dissatisfied (PMV/PPD),adaptive comfort,psychrometric chart,visualization,web applicationassessment; compliance document automation for LEED thermal comfort credits; metabolic activityArticle Historyand clothing insulation tables and dynamic models; and compliance with the standard. The tool canReceived: 17 July 2013be used by architects, engineers, building operators, educators, and students.Revised: 27 September 2013Accepted: 7 November 2013 Tsinghua University Press andSpringer-Verlag Berlin Heidelberg20131IntroductionE-mail: stefanoschiavon@berkeley.eduBuilding Thermal, Lighting,and Acoustics ModelingMaintaining thermal comfort for building occupants isa primary goal of HVAC (heating, ventilation, and airconditioning) design engineers, architects and buildingoperators. There is room for improvement. Thermal comfortis the second largest source of dissatisfaction (after soundprivacy) in U.S. office buildings; more than 50% of occupantsare not satisfied with their thermal environment (Frontczaket al. 2012). At the same time, the energy used for HVAC ishigh, approaching 71% of primary energy use in commercialbuilding (18% of societal energy use) (U.S. Department ofEnergy 2011). There are many causes for this poor performance, including mechanical ones like building envelope,systems, and controls. But in addition there appears to belimited or outdated understanding among designers andoperators of how comfort is affected by the full range ofpossible indoor thermal conditions. In the design andoperation of buildings and HVAC systems, an understandingof human thermal comfort can create opportunities to saveenergy while improving, or at least not compromising,current levels of occupant satisfaction. Examples might bein extending thermostat heating and cooling setpoints(Hoyt et al. 2009; Schiavon and Melikov 2008), or in theuse of personal comfort systems (Zhang et al. 2010) or inthe avoidance of summer overcooling and winter overheating(Mendell and Mirer 2009). Using such approaches requiresa clear understanding of how the human responds to eachof the climate variables, and how their limits interact.Thermal comfort prediction and visualization tools mayhelp designers, building operators to better design, operateand understand thermal comfort.In this paper, after a brief introduction of thermalcomfort models used in ASHRAE Standard 55-2013,we describe the limitations of existing thermal comfortvisualization techniques and software, and present a newweb application for thermal comfort visualization andcalculation. The “comfort tool” is based on the methods
2Schiavon et al. / Building SimulationList of symbolsASHRAEAmerican Society of Heating, Refrigeratingand Air-conditioning EngineerscloHVACLEEDmetMRTPMVunit of clothing insulation (m2·K/W)heating, ventilation and air-conditioningLeadership in Energy and Environmental Designunit of metabolic activity (W/m2)mean radiant temperature ( )predicted mean voteand models in ASHRAE Standard 55-2013. In Section 2the web-application software architecture and a newinterpretation of the elevated air speed method are described.The thermal comfort visualization charts are shown anddescribed in Section 3, while the main features of the toolare described in Section 4.1.1 Thermal comfort modelsThe three relevant standards regarding thermal comfort arethe international standard ISO 7730 (2005), the Europeanstandard EN 15251 (CEN 2007) and the ASHRAE 55(ANSI/ASHRAE 2013). The web application describedhere is based on ASHRAE Standard 55-2013. ASHRAEStandard 55 specifies the combinations of indoor thermalenvironmental factors and personal factors that producethermal environmental conditions acceptable to a majorityof the occupants within a space. Thermal comfort isbased on the predicted mean vote/predicted percentage ofdissatisfied (PMV/PPD) (Fanger 1970) and Standard EffectiveTemperature (SET) (Fobelets and Gagge 1988; Gagge etal. 1986) comfort models. For elevated air speed levels( 0.15 m/s), the Standard uses an integrated SET-PMVapproach described in Section 2.2 and referred to as theElevated Air Speed model. The Adaptive Comfort model(de Dear and Brager 1998) can be used to assess naturallyconditioned spaces.SET is a comfort index based on a dynamic two-nodemodel of human temperature regulation, in which the bodyis modeled as two concentric cylinders, the inner representingthe body core and the outer representing the thin skin shell.The SET is defined as the equivalent air temperature of anisothermal environment at relative humidity (rh) 50% inwhich a subject, wearing clothing standardized for the activityconcerned, has the same heat stress and thermoregulatorystrain as in the actual environment (ASHRAE 2009). Theisothermal environment is at sea level, with air temperatureequal to mean radiant temperature, and with still air. Thismeans that the skin heat loss, temperature and wettednessPPDrhSETTTadjTdbvpredicted percentage of dissatisfied (%)relative humidity (%)standard effective temperature ( )dry-bulb or operative temperature depending onthe visualization chart used ( )adjusted dry-bulb temperature ( )dry-bulb temperature ( )air velocity (m/s)provided by the SET model in the isothermal environmentare equal to those of the person in the actual environment.The model applies to a lightly clothed person who is engagedin near sedentary activity. The SET lines generated withthis model are used to extend the comfort zone boundariesacross a range of air speeds.According to ASHRAE Standard 55 the Adaptive Comfortmodel can be used in naturally conditioned buildings, withno mechanical cooling system installed and no heatingsystem in operation. The standard specifies that the prevailingmean outdoor temperature should be greater than 10 and less than 33.5 , and the occupants should be engagedin near sedentary activities (met between 1.0 and 1.3) andhave the freedom to adapt their clothing level at least in therange of 0.5 to 1.0 clo. The Adaptive Comfort model is basedon the work of de Dear and Brager (1998), which showedthat occupants in naturally ventilated buildings preferred awider range of temperatures that reflected the swings of theoutdoor climate. The adaptation is due both to behavioraland physiological adjustments.1.2 Visual representation of thermal comfortThe growing power of consumer computers and browsertechnology has enabled highly accessible applications capableof real-time scientific computation and visualization.Visualizations help users understand and act on data quicklyand effectively. Providing designers, building operators andbuilding science educators with thermal comfort predictionand visualization tools will contribute to the design, operationand investigation of more comfortable and energy efficientindoor spaces. A simple, interactive and complete visualization of thermal comfort is a benefit to professionalpractice designers.To our knowledge, the first significant attempt ofcreating a single-Fig. comfort index was made by Houghtenand Yaglou (1923) and named Effective Temperature (ET).This index combines temperature and humidity, so thattwo environments with the same ET should evoke the same
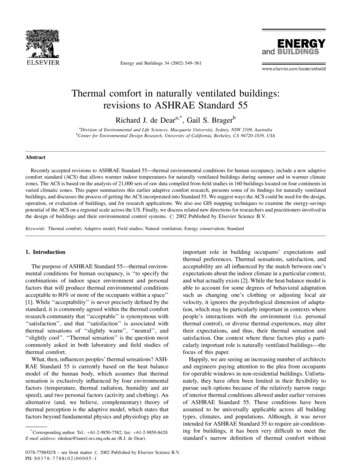
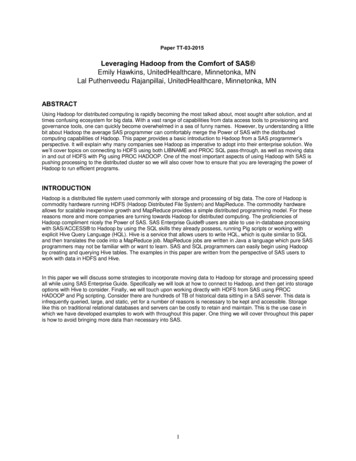
Schiavon et al. / Building Simulationthermal response even though they have different values oftemperature and humidity, as long as they have the sameair velocity (ASHRAE 2009).An important pioneer of thermal comfort representationswas Victor Olgyay, who used the previous work on the ETas the basis of his comfort diagram, the “Bioclimatic Chart”,shown in Fig. 1(a). This chart assumes the criterion that theperimeter of the comfort zone is defined by the conditionswherein the average person will not experience the feelingof discomfort, and it applies to moderate climate zones(Olgyay 1963). Four parameters are considered in hisrepresentation: air movement, vapor pressure, evaporationand radiation effect. Dry-bulb temperature is the ordinateand relative humidity (rh) the abscissa. The chart displaysthe comfort zone in the middle surrounded by curves thatdescribe how climatic effects can be used to restore thefeeling of comfort for conditions that fall outside of theboundaries. The bioclimatic chart is a powerful representationthat combines several factors and considers their interactionand effects on thermal comfort (Givoni 1998). The thermalcomfort area reported in the chart is not consistent withASHRAE 55 thermal comfort areas. Givoni, the author ofthe “Building Bioclimatic Chart” (Fig. 1(b)), partially convertedthe Olgyay’s representation to the psychrometric chart andadded rules about passive heating and cooling strategies.The Building Bioclimatic Chart has two components: thermalcomfort area and “boundaries of climatic conditions withinwhich various building design strategies and natural coolingsystems can provide comfort” (Givoni 1992). Limitations ofthe chart are reported by Lomas et al. (2004).3The psychrometric chart is the most completerepresentation of the factors involved in the study of moistair (ASHRAE 2009). It represents an equation of state andit allows all the parameters of moist air to be determinedfrom any three independent parameters. In the psychrometricchart the atmospheric pressure is fixed, the dry-bulbtemperature is on the x-axis, and the humidity ratio ison the y-axis. Vertical lines represent constant dry-bulbtemperature, and horizontal lines represent constanthumidity ratio values. Curved lines climbing from left toright represent equal relative humidity. The upper boundaryof the chart is known as saturation line, i.e. at 100%, thepoints at which moisture in the air begins to condense.These points correspond to the dew-point temperatures ata given humidity ratio, or conversely, the maximum amountof moisture that can be held by the air at a given temperature.The psychrometric chart is used for many applications,including thermal comfort assessment.According to ASHRAE Standard 55-2013, the comfortzone is defined by the combinations of the six key factors ofthermal comfort for which the PMV is within the requiredlimits (–0.5 and 0.5). To determine the comfort zone forthe PMV model, Standard 55-2013 provides two ways. First,a graphical method can be used, which defines two comfortboundaries for 0.5 and 1.0 clo—assumed to be summer andwinter conditions—and allows interpolation between theselimits. As shown in Fig. 2, the two zones are represented ingrey for a metabolic activity of 1.1 met, with no lowerhumidity limit and a maximum of 0.012 kgw/kgda. A computermodel method is allowed for a more flexibility (e.g. metabolicFig. 1 Representations of thermal comfort zones and passive design strategies, such as natural ventilation, solar radiation, shading, evaporativecooling and thermal mass. (a) Olgyay’s bioclimatic chart, adapted from (Olgyay 1963). In this chart relative humidity is on the horizontalaxis and dry-bulb temperature on the vertical axis. (b) Givoni’s building bioclimatic chart, adapted from (La Roche 2012). It is based on apsychrometric chart, with dry-bulb temperature on the horizontal axis and humidity ratio on the vertical axis
4Schiavon et al. / Building SimulationFig. 2 Psychrometric chart with superimposed comfort zones for 0.5 and 1.0 clo (summer and winter conditions), 1.1 met, air speedbelow 0.2 m/s, provided by ASHRAE Standard 55-2013 for the graphical methodactivity or clothing insulation can be changed) and releasefrom the maximum humidity constraint. Both representationscan be rendered on the psychrometric chart. However, inthe graphical method the Standard does not allow the useof dry-bulb temperature alone, and the operative temperatureis plotted on the x-axis instead. The boundary conditionsin the graph have been obtained with the MRT exactlyequal to the dry-bulb temperature for each of the pointsconsidered. This approach is reasonable for spaces inwhich the dry-bulb and mean radiant temperatures can beconsidered equal or very close to each other (e.g. core zones).If operative temperature is calculated as the average of thedry-bulb and mean radiant temperatures and these two differ,then the accuracy of the graphical method is reduced. Thisis because the same operative temperature can be obtainedwith different combinations of dry-bulb and mean radianttemperatures. These different combinations can affect thecalculated humidity ratio, changing the underlying chart.For example, an operative temperature equal to 24 canbe obtained with Tdb 22 and MRT 26 or Tdb 26 andMRT 22 . From the chart reported below the humidityratio is equal to 11 gw/kgda when the rh 60%. This value issignificantly different from both the two cases presented above(9.8 gw/kgda with Tdb 22 and 12.4 gw/kgda with Tdb 26 )if the rh is kept equal to 60%.All of the above comfort zone representations have thelimitation of being static, which means that no interactionis provided and the comfort zone is based on fixed valuesof, for example, clothing insulation
According to ASHRAE Standard 55-2013, the comfort zone is defined by the combinations of the six key factors of thermal comfort for which the PMV is within the required limits (–0.5 and 0.5). To determine the comfort zone for the PMV model, Standard 55-2013 provides two ways. First, a graphical method can be used, which defines two comfort boundaries for 0.5 and 1.0 clo—assumed to be .