Transcription
Image description. Cover Image End of image description.NATIONAL CENTER FOR EDUCATION STATISTICSWhat Is IPEDS?The Integrated Postsecondary Education DataSystem (IPEDS) is a system of survey componentsthat collects data from about 6,400 institutions thatprovide postsecondary education across the UnitedStates.These data are used at the federal and state level forpolicy analysis and development; at the institutionallevel for benchmarking and peer analysis; and bystudents and parents, through the College Navigator(https://nces.ed.gov/collegenavigator/), an online toolto aid in the college search process. Additionalinformation about IPEDS can be found on thewebsite at https://nces.ed.gov/ipeds.What Is the Purpose of This Report?The Data Feedback Report is intended to provideinstitutions a context for examining the data theysubmitted to IPEDS. The purpose of this report is toprovide institutional executives a useful resource andto help improve the quality and comparability ofIPEDS data.What Is in This Report?The figures in this report provide a selection ofindicators for your institution to compare with a groupof similar institutions. The figures draw from the datacollected during the 2018-19 IPEDS collection cycleand are the most recent data available. The insidecover of this report lists the pre-selected comparisongroup of institutions and the criteria used for theirselection. The Methodological Notes at the end of thereport describe additional information about theseindicators and the pre-selected comparison group.Where Can I Do More with IPEDS Data?Each institution can access previously released DataFeedback Reports from 2005 and customize this2019 report by using a different comparison groupand IPEDS variables of its choosing. To learn how tocustomize the 2019 report, visit this resource pagehttps://nces.ed.gov/Ipeds/Help/View/2. To downloadarchived reports or customize the current DataFeedback Report, visit the ‘Use the Data’ portal onthe IPEDS website https://nces.ed.gov/ipeds andclick on Data Feedback Report.Joliet Junior CollegeJoliet, IL
Joliet Junior CollegeCOMPARISON GROUPComparison group data are included to provide a context for interpreting your institution’s statistics. If your institution did not define a customcomparison group for this report by July 13, 2019 NCES selected a comparison group for you. (In this case, the characteristics used to definethe comparison group appears below.) The Customize Data Feedback Report functionality on the IPEDS Data Center at this provided link(https://nces.ed.gov/ipeds/datacenter/) can be used to reproduce the figures in this report using different peer groups.The custom comparison group chosen by Joliet Junior College includes the following 47 institutions:Black Hawk College (Moline, IL)Carl Sandburg College (Galesburg, IL)City Colleges of Chicago-Harold Washington College (Chicago, IL)City Colleges of Chicago-Harry S Truman College (Chicago, IL)City Colleges of Chicago-Kennedy-King College (Chicago, IL)City Colleges of Chicago-Malcolm X College (Chicago, IL)City Colleges of Chicago-Olive-Harvey College (Chicago, IL)City Colleges of Chicago-Richard J Daley College (Chicago, IL)City Colleges of Chicago-Wilbur Wright College (Chicago, IL)College of DuPage (Glen Ellyn, IL)College of Lake County (Grayslake, IL)Danville Area Community College (Danville, IL)Elgin Community College (Elgin, IL)Frontier Community College (Fairfield, IL)Heartland Community College (Normal, IL)Highland Community College (Freeport, IL)Illinois Central College (East Peoria, IL)Illinois Valley Community College (Oglesby, IL)John A Logan College (Carterville, IL)John Wood Community College (Quincy, IL)Kankakee Community College (Kankakee, IL)Kaskaskia College (Centralia, IL)Kishwaukee College (Malta, IL)Lake Land College (Mattoon, IL)Lewis and Clark Community College (Godfrey, IL)Lincoln Land Community College (Springfield, IL)Lincoln Trail College (Robinson, IL)McHenry County College (Crystal Lake, IL)Moraine Valley Community College (Palos Hills, IL)Morton College (Cicero, IL)Oakton Community College (Des Plaines, IL)Olney Central College (Olney, IL)Parkland College (Champaign, IL)Prairie State College (Chicago Heights, IL)Rend Lake College (Ina, IL)Richland Community College (Decatur, IL)Rock Valley College (Rockford, IL)Sauk Valley Community College (Dixon, IL)Shawnee Community College (Ullin, IL)South Suburban College (South Holland, IL)Southeastern Illinois College (Harrisburg, IL)Southwestern Illinois College (Belleville, IL)Spoon River College (Canton, IL)Triton College (River Grove, IL)Wabash Valley College (Mount Carmel, IL)Waubonsee Community College (Sugar Grove, IL)William Rainey Harper College (Palatine, IL)The figures in this report have been organized and ordered into the following topic areas:1) Admissions (only for non-open-admissions schools)[No charts applicable]2) Student EnrollmentFig. 1 and 2Pg. 33) AwardsFig. 3Pg. 34) Charges and Net PriceFig. 4 and 5Pg. 45) Student Financial AidFig. 6 and 7Pg. 46) Military Benefits*[No charts applicable]7) Retention and Graduation RatesFig. 8, 9, 10, 11, 12, 13, 14, 15 and 16Pg. 5, 6, 7 and 88) FinanceFig. 17 and 18Pg. 99) StaffFig. 19 and 20Pg. 910) Libraries*Fig. 21 and 22Pg. 10*These figures only appear in customized Data Feedback Reports (DFR), which are available through Use the Data portal on the IPEDS website.IPEDS DATA FEEDBACK REPORT2
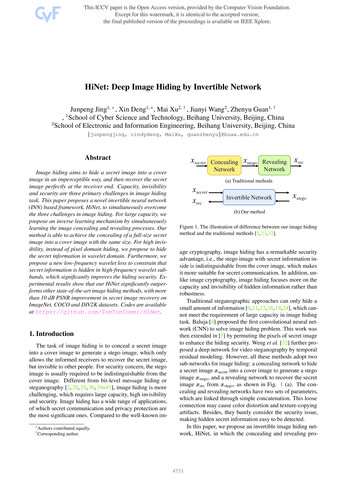
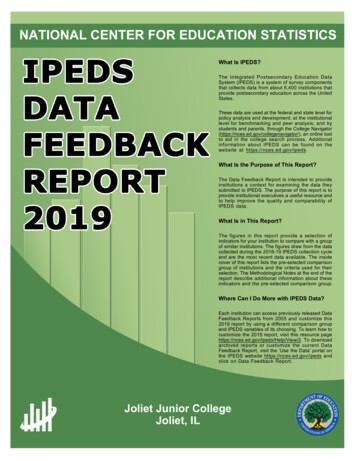
Joliet Junior CollegeFigure 1.Percent of all students enrolled, by race/ethnicity, and percent of students who are women: Fall 2018Image description.BarchartwithScale10 groupsX scalescaletitledlabel.with 2 items per group.YtitledPercent.GroupAmericanIndianor Alaska nGroupMedian (N 47) 0.01.Group2,Asian.Iteminstitution3. Median (N 47) 1.Item 1,2, YourComparisonGroupGroupBlackor AfricanItem1,3,Yourinstitution9. American.Item2,ComparisonGroupMedian (N 47) 9.GroupHispanic/Latino.Item1,4,Yourinstitution28. Median (N 47) 14.Item2,ComparisonGroupGroupNativeHawaiianor other Pacific sonGroupMedian (N 47) 0.01.GroupWhite.Item1,6,Yourinstitution55. Median (N 47) 63.Item2,ComparisonGroupGroup7,Twoormoreraces.Item 2,1, ComparisonYour institution4. Median (N 47) ion1.unknown.Item2,ComparisonGroupMedian (N 47) 1.Item 2,10,ComparisonGroup Median (N 47) 0.01.GroupWomen.Item1, ComparisonYourinstitution55. Median (N 47) 58.Item2,GroupRace/ethnicityor : Your institutionShapeComparisonGroupLegend,End of image description. Label: Comparison Group Median (N 40212000American Indian orAlaska NativeAsianBlack or AfricanAmericanHispanic/LatinoNative Hawaiian orother Pacific IslanderWhiteTwo ormore racesRace/ethnicityunknownNonresident alienWomenRace/ethnicity or genderYour institutionComparison Group Median (N 47)NOTE: For more information about disaggregation of data by race and ethnicity, see the Methodological Notes. Median values for the comparison group will not add to 100%. See 'Use ofMedian Values for Comparison Group' for how median values are determined. N is the number of institutions in the comparison group.SOURCE: U.S. Department of Education, National Center for Education Statistics, Integrated Postsecondary Education Data System (IPEDS): Spring 2019, Fall Enrollment component.Figure 2.Unduplicated 12-month headcount (2017-18), total FTEenrollment (2017-18), and full- and part-time fallenrollment (Fall 2018)Image description.EnrollmentBarmeasureHorizontalchart with4 groups with 2 items per group.Xscale titledtitled ScaleNumberof students.Yscalelabel.GroupUnduplicatedheadcount - total.Item an (N 47) 9136.GroupTotalFTE risonGroupMedian (N 47) n4685.Item 1,2, YourComparisonGroupMedian (N 47) itution10041.Item2,ComparisonGroupMedian (N 47) 2708.Shapeline,Label:ShapeInstitutionLegend,Label: Your institutionShapeComparisonGroupLegend,End of image description. Label: Comparison Group Median (N 47)Figure 3.Number of subbaccalaureate degrees and certificatesawarded, by level: 2017-18Image description.Award levelBar chart with 4 groups with 2 items per group.HorizontalXscale titledtitled ScaleNumberof awards.Yscalelabel.GroupAssociate's.Item n(N 47)487.4 years.GroupCertificatesof0.01.at least2 butless dian(N 47)0.01.2 years.Group3,Certificatesof339.at least1 butless thanIteminstitutionItem 1,2, anthan 1 (N 47)year. ian (N 47) 342.Shapeline,Label:ShapeInstitutionLegend,Label: Your institutionShapeComparisonGroupLegend,End of image description. Label: Comparison Group Median (N 47)Enrollment measureAward level23,177Unduplicatedheadcount - total1,801Associate's9,1364879,462Total FTEenrollmentCertificates of at least 2 0but less than 4 years 03,3344,685Full-timefall enrollment10,041Part-timefall 1,5002,000Number of awardsComparison Group Median (N 47)NOTE: For details on calculating full-time equivalent (FTE) enrollment, see CalculatingFTE in the Methodological Notes. N is the number of institutions in the comparison group.SOURCE: U.S. Department of Education, National Center for Education Statistics,Integrated Postsecondary Education Data System (IPEDS): Fall 2018, 12-monthEnrollment component and Spring 2019, Fall Enrollment component.3420Number of studentsYour institution83Certificates of lessthan 1 year2,7080339Certificates of at least 1but less than 2 years1,625Your institutionComparison Group Median (N 47)NOTE: N is the number of institutions in the comparison group.SOURCE: U.S. Department of Education, National Center for Education Statistics,Integrated Postsecondary Education Data System (IPEDS): Fall 2018, Completionscomponent.IPEDS DATA FEEDBACK REPORT3
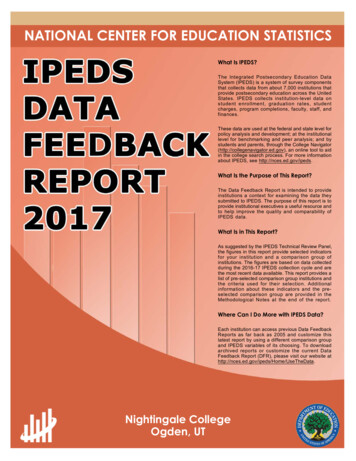
Joliet Junior CollegeFigure 4.Academic year tuition and required fees for full-time,first-time degree/certificate-seeking undergraduates:2015-16 to 2018-19Figure 5.Image description.AcademicyearHorizontalBarTuitionchart withgroups with 2 items per group.Xscale titledtitledand 4fees.YscaleScale label.Group2018-19.Item1,1,Yourinstitution 4380.Item2,ComparisonGroupMedian (N 47) 3985.Group2017-18.Item 2,1,2,Yourinstitution 4320.ItemComparisonGroupMedian (N 47) 3910.Group2016-17.Item1,3,Yourinstitution 3750.Item2,ComparisonGroupMedian (N 47) 3663.Group4,2015-16.Iteminstitution 3450.Item 1,2, YourComparisonGroupMedian (N 47) 3506.Shapeline,Label:ShapeInstitutionLegend,Label: Your institutionShapeComparisonGroupLegend,End of image description. Label: Comparison Group Median (N 47)Average net price of attendance for full-time, first-timedegree/certificate-seeking undergraduate students, whowere awarded grant or scholarship aid: 2015-16 to 201718Image description.AcademicyearHorizontalBarNetchartwith 3 groups with 2 items per group.Xscale em1,1,Yourinstitution 4428.Item2,ComparisonGroupMedian (N 47) 5663.Group2016-17.Item 2,1,2,Yourinstitution 4162.ItemComparisonGroupMedian (N 47) 5840.Group2015-16.Item1,3,Yourinstitution 4208.Item2,ComparisonGroupMedian (N 47) 5670.Shapeline,Label:ShapeInstitutionLegend,Label: Your institutionShapeComparisonGroupLegend,End of image description. Label: Comparison Group Median (N 47)Academic yearAcademic year 4,380 4,4282018-19 3,9852017-18 5,663 4,3202017-18 3,910 4,1622016-17 5,840 3,7502016-17 3,663 4,2082015-16 3,4502015-16 5,670 3,506 0 1,000 2,000 3,000 4,000 5,000 0 1,000 2,000 3,000Tuition and feesYour institution 4,000 5,000 6,000Net priceComparison Group Median (N 47)Your institutionComparison Group Median (N 47)NOTE: The tuition and required fees shown here are the lowest reported from thecategories of in-district, in-state, and out-of-state. N is the number of institutions in thecomparison group.SOURCE: U.S. Department of Education, National Center for Education Statistics,Integrated Postsecondary Education Data System (IPEDS): Fall 2018, InstitutionalCharacteristics component.NOTE: Average net price is for full-time, first-time degree/certificate-seekingundergraduate students and is generated by subtracting the average amount of federal,state/local government, and institutional grant and scholarship awarded aid from the totalcost of attendance. Total cost of attendance is the sum of published tuition and requiredfees, books and supplies, and the average room and board and other expenses. Fordetails, see the Methodological Notes. N is the number of institutions in the comparisongroup.SOURCE: U.S. Department of Education, National Center for Education Statistics,Integrated Postsecondary Education Data System (IPEDS): Fall 2018, InstitutionalCharacteristics component and Winter 2018-19, Student Financial Aid component.Figure 6.Figure 7.Percent of full-time, first-time degree/certificate-seekingundergraduate students who were awarded grant orscholarship aid from the federal government, state/localgovernment, or the institution, or loans, by type of aid:2017-18Image description.Type of aidBar chart with 8 groups with 2 items per group.HorizontalXscale titledtitled ScalePercentof students.YscaleGroupAnyinstitutiongrant label.aid.50.Item 2,1,1,YourItemComparisonGroup Median (N 47) 65.GroupFederalgrants.Item1,2,Yourinstitution36. Median (N 47) oupItem36. Median (N 47) 48.Item 1,2, Yourinstitution16. Median (N 47) tem1,5,Yourinstitution9. Median (N 47) 18.Item2,ComparisonGroupAnyinstitutionloans. GroupItem 2,1,6,Your14. Median (N 47) urinstitution14. Median (N 47) urinstitution0.01.Median (N 47) 0.01.Item 2, Comparison GroupShapeline,Label:ShapeInstitutionLegend,Label: Your institutionShapeComparisonGroupLegend,End of image description. Label: Comparison Group Median (N 47)Image description.Type of aidBar chart with 8 groups with 2 items per group.HorizontalXscale titledtitled ScaleAid dollars.YscaleGroupAnyinstitutiongrant label.aid 4064.(N 47).Item 2,1,1,YourItemComparisonGroupMedian 5225.GroupFederalgrants(N 47).Item1,2,Yourinstitution 4543.Item2,ComparisonMedian 4634.Group3,Pellinstitutiongrants Group(N 47).Item 4457.Item 1,2, YourComparisonGroupMedianGroupState/localgrants(N 47). 4587.Item1,4,Yourinstitution grants(N 46). 1291.Item1,5,Yourinstitution 2070.Item2,ComparisonMedian 2662.GroupAnyinstitutionloans Group(N 45).Item 2,1,6,Your 4495.ItemComparisonGroupMedian 4037.GroupFederalloans(N 41).Item1,7,Yourinstitution 4495.Item2,ComparisonMedian 4002.Group8,OtherloansGroup(N 12).Item1,YourinstitutionNoItem 2, Comparison Groupdata.Median 5113.Shapeline,Label:ShapeInstitutionLegend,Label: Your institutionShapeComparisonGroupLegend,End of image description. Label: Comparison Group MedianType of aidType of aidAny antsAny grantaid (N 47)6548Federalgrants (N 47)48Pellgrants (N 47)169Any loans10Federalloans10 4,457 4,587 1,248 1,291 2,070 2,66214Any loans(N 45) 4,03714Federalloans (N 41) 4,0022030405060708090100 5,113 0Percent of studentsYour institution 1,000 2,000 3,000 4,000 5,000 6,000Aid dollarsComparison Group Median (N 47)NOTE: Any grant aid above includes grant or scholarship aid awarded from the federalgovernment, state/local government, or the institution. Federal grants includes Pell grantsand other federal grants. Any loans includes federal loans and other loans awarded tostudents. For details on how students are counted for financial aid reporting, see CohortDetermination in the Methodological Notes. N is the number of institutions in thecomparison group.SOURCE: U.S. Department of Education, National Center for Education Statistics,Integrated Postsecondary Education Data System (IPEDS): Winter 2018-19, StudentFinancial Aid component. 4,495 4,495Other loans(N 12)10 5,225 4,543 4,634Institutionalgrants (N 46)18Other loans 000 4,064State/localgrants (N 47)24InstitutionalgrantsAverage amounts of awarded grant or scholarship aidfrom the federal government, state/local government, orthe institution, or loans awarded to full-time, first-timedegree/certificate-seeking undergraduate students, bytype of aid: 2017-18Your institutionComparison Group MedianNOTE: Any grant aid above includes grant or scholarship aid awarded from the federalgovernment, state/local government, or the institution. Federal grants includes Pell grantsand other federal grants. Any loans includes federal loans and other loans awarded tostudents. Average amounts of aid were calculated by dividing the total aid awarded by thetotal number of recipients in each institution. N is the number of institutions in thecomparison group.SOURCE: U.S. Department of Education, National Center for Education Statistics,Integrated Postsecondary Education Data System (IPEDS): Winter 2018-19, StudentFinancial Aid component.IPEDS DATA FEEDBACK REPORT4
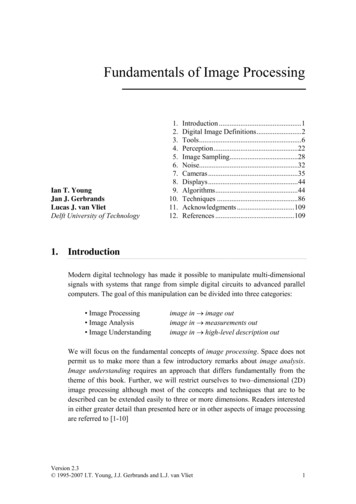
Joliet Junior CollegeFigure 8.Retention rates of full-time, first-time degree/certificateseeking students, attendance status: Fall 2017 cohortFigure 9.Image description.AttendancestatusHorizontalBarchart with 2 groups with 2 items per group.Xscale eretentionrate.Item1,1,Yourinstitution65. rate. (N 47) 65.Item 2,1,2,Yourinstitution42. MedianItemComparisonGroup(N 47) 44.Shapeline,Label:ShapeInstitutionLegend,Label: Your institutionShapeComparisonGroupLegend,End of image description. Label: Comparison Group Median (N 47)Graduation and transfer-out rates of full-time, first-timedegree/certificate-seeking undergraduates within 150%of normal time to program completion: 2015 cohortImage description.MeasureHorizontalBarPercent.chart with 2 groups with 2 items per group.Xscale titledtitledYscaleScale 7. Overall.Item2,ComparisonGroupMedian (N 47) 33.GroupTransfer-outrate.Item 2,1,2,Yourinstitution24. Median (N 47) tionLegend,Label: Your institutionShapeComparisonGroupLegend,End of image description. Label: Comparison Group Median (N 47)Attendance statusMeasure6517Full-time retentionrateGraduation rate,Overall65334224Part-time retentionrateTransfer-out rate44010203040195060708090100010203040PercentYour institution5060708090100PercentComparison Group Median (N 47)Your institutionNOTE: Retention rates are measured from the fall of first enrollment to the following fall.Academic reporting institutions report retention data as of the institution's official fallreporting date or as of October 15, 2017. Program reporters determine the cohort withenrollment any time between August 1-October 31, 2017 and retention based on August1, 2018. For more details, see the Methodological Notes. N is the number of institutions inthe comparison group.SOURCE: U.S. Department of Education, National Center for Education Statistics,Integrated Postsecondary Education Data System (IPEDS): Spring 2019, Fall Enrollmentcomponent.Comparison Group Median (N 47)NOTE: Graduation rate cohort includes all full-time, first-time degree/certificate-seekingundergraduate students. Graduation and transfer-out rates are the Student Right-to-Knowrates. Only institutions with mission to prepare students to transfer are required to reporttransfer out. For more details, see the Methodological Notes. N is the number ofinstitutions in the comparison group.SOURCE: U.S. Department of Education, National Center for Education Statistics,Integrated Postsecondary Education Data System (IPEDS): Winter 2018-19, GraduationRates component.Figure 10. Graduation rates of full-time, first-time degree/certificate-seeking undergraduates within 150% of normal time to programcompletion, by race/ethnicity: 2015 cohortImage description.BarchartwithScale10 groupsXscaletitledlabel.with 2 items per group.YscalePercent.Group1,titledGraduationrate,(N 47).Iteminstitution17. OverallItem 1,2, 33.Native (N 33).Item1,2,Yourinstitution50. orItem2,ComparisonGroupMedian 25.GroupAsian(N 38).Item1,3,Yourinstitution12. Median 30.Item2,ComparisonGroupGroupBlackor African(N 47).Item1,4,Yourinstitution4. AmericanItem2,ComparisonGroupMedian N aiianother PacificIslander (N 15).IteminstitutionNo ordata.Item 1,2, YourComparisonGroupMedian 0.01.GroupWhite(N 47).Item1,7,Yourinstitution22. Median 38.Item2,ComparisonGroupGroupTwoinstitutionor moreraces(N 40).Item1,8,Your9. nknown (N p31.GroupNonresidentalienMedian(N upMedian 17.Graduationrates by nd,Label: Your isonGroup MedianEnd of image 31301715121022221816179400Graduation rate,Overall (N 47)American Indian orAlaska Native (N 33)Asian (N 38)Black or AfricanAmerican (N 47)Hispanic/Native Hawaiian orLatino (N 45) other Pacific Islander (N 15)White(N 47)Two ormore races (N 40)Race/ethnicityunknown (N 43)Nonresidentalien (N 20)Graduation rates by race/ethnicityYour institutionComparison Group MedianNOTE: For more information about disaggregation of data by race and ethnicity, see the Methodological Notes. The graduation rates are the Student Right-to-Know (SRK) rates. Medianvalues for the comparison group will not add to 100%. N is the number of institutions in the comparison group.SOURCE: U.S. Department of Education, National Center for Education Statistics, Integrated Postsecondary Education Data System (IPEDS): Winter 2018-19, Graduation Ratescomponent.IPEDS DATA FEEDBACK REPORT5
Joliet Junior CollegeFigure 11. Graduation rates of full-time, first-time degree/certificateseeking undergraduates within 150% of normal time toprogram completion, by type of aid: 2015 cohortFigure 12. Graduation rates of full-time, first-time degree/certificateseeking undergraduates within normal time, and 150%and 200% of normal time to completion: 2014 cohortImage description.Typeof aidBar chart with 3 groups with 2 items per group.HorizontalXscale titledtitled ScalePercent.YscaleGroupPellinstitutiongrant label.(N 47).Item1,1,Your13. Median 25.Item2,ComparisonGroupGroupStaffordloan(N 38).Item 2,1,2,Yourinstitution14. Median 33.ItemComparisonGroupNeitherPellGroupgrantor Stafford loan (N 47).Item1,3,Yourinstitution19. eInstitutionLegend,Label: Your institutionShapeComparisonGroupLegend,End of image description. Label: Comparison Group MedianImage description.Timeto programcompletionHorizontalBarGraduationchartwith 3 groups with 2 items per group.Xscale titledtitledYscaleScalelabel. rate.GroupNormaltime.Item1,1,Yourinstitution6. Median (N 47) 15.Item2,ComparisonGroupGroup150%of normalItem dian (N 47) 30.Group200%of sonGroupMedian (N 47) 33.Shapeline,Label:ShapeInstitutionLegend,Label: Your institutionShapeComparisonGroupLegend,End of image description. Label: Comparison Group Median (N 47)Type of aidTime to program completion136Pell grant (N 47)Normal time25151416Stafford loan (N 38)150% of normal time333019Neither Pell grantor Stafford loan (N 47)20200% of normal time370102030334050607080901000PercentYour institution2030405060708090100Graduation rateComparison Group MedianNOTE: Graduation rate cohort includes all full-time, first-time degree/certificate-seekingundergraduate students. Data were collected on those students, who at entry of thecohort, were awarded a Pell Grant and students who were awarded a Subsidized Staffordloan, but did not receive a Pell Grant. Graduation rates are the Student Right-to-Knowrates. For more details, see the Methodological Notes. N is the number of institutions inthe comparison group.SOURCE: U.S. Department of Education, National Center for Education Statistics,Integrated Postsecondary Education Data System (IPEDS): Winter 2018-19, GraduationRates component.10Your institutionComparison Group Median (N 47)NOTE: The 150% graduation rate is the Student Right-to-Know (SRK) rates; the Normaltime and 200% rates are calculated using the same methodology. For details, see theMethodological Notes. N is the number of institutions in the comparison group.SOURCE: U.S. Department of Education, National Center for Education Statistics,Integrated Postsecondary Education Data System (IPEDS): Winter 2018-19, 200%Graduation Rates component.IPEDS DATA FEEDBACK REPORT6
Joliet Junior CollegeFigure 13. Award and enrollment rates of first-time, full-time, degree/certificate-seeking undergraduates after 8 years of entry, by Pell status:2010-11 cohortPell(N 47)Non-Pell(N 46)Image description.BarchartwithScale10 groupsX scalescaletitledlabel.with 2 items per group.YtitledPercent.GroupReceivedaward4 arisonGroup23.GroupReceivedaward6 years.Item p27.GroupReceivedaward8 titution.Item1.sameItem 1,2, YourComparisonMedian1.GroupEnrolledat Groupanotherinstitution.Item1,5,Yourinstitution49. MedianItem2,ComparisonGroup31.GroupReceivedaward4 arisonGroup31.GroupReceivedaward6 arisonGroup35.GroupReceivedaward8 n.Item 2,1, ComparisonYour institution1. Median ,10,Yourinstitution42. Label: Your institutionShapeComparisonGroupLegend,End of image description. Label: Comparison Group 141312421181035311110Received awardin 4 yearsReceived awardin 6 yearsReceived awardin 8 yearsStill enrolled atsame institutionEnrolled atanother institutionReceived awardin 4 yearsReceived awardin 6 yearsReceived awardin 8 yearsStill enrolled atsame institutionEnrolled atanother institutionCompletion and enrollment measuresYour institutionComparison Group MedianNOTE: Award measures are based on the highest award received after 8 years of entry and enrollment measures are based on students who did not receive an award after 8 years ofentry. Student cohorts (i.e., First-time, full-time; First-time, part-time; Non-first-time, full-time; and Non-first-time, part-time) are degree/certificate-seeking undergraduate students whoentered the institution between July 1, 2010-June 30, 2011. Pell recipients are students with demonstrated financial need. For more details, see the Methodological Notes. N is thenumber of institutions in the comparison group.SOURCE: U.S. Department of Education, National Center for Education Statistics, Integrated Postsecondary Education Data System (IPEDS): Winter 2018-19, Outcome Measurescomponent.Figure 14. Award and enrollment rates of first-time, part-time, degree/certificate-seeking undergraduates after 8 years of entry, by Pellstatus: 2010-11 cohortPell(N 47)Non-Pell(N 47)Image description.BarchartwithScale10 groupsXscaletitledlabel.with 2 items per group.YscalePercent.Group1,titledReceivedaward4 years.Iteminstitution5. inMedianItem 1,2, YourComparisonGroup(N 47) 16.GroupReceivedaward6 arisonGroup(N 47) 19.GroupReceivedaward8 arisonGroup(N 47) 1,4,Your2.sameItem2,ComparisonMedian(N 47) 1.GroupEnrolledat Groupanotherinstitution.Item1,5,Yourinstitution30. MedianItem2,ComparisonGroup(N 47) 26.GroupReceivedaward4 years.Item p(N 47) 17.GroupReceivedaward6 arisonGroup(N 47) 20.Group8,Receivedawardin 8 years.Item1,Yourinstitution17.Item 2,9,ComparisonGroupMedian(N 47) 1, ComparisonYour1.sameItem2,GroupMedian(N 47) nstitution33. MedianItem2,ComparisonGroup(N 47) 20.Completionand enrollment el: Your institutionShapeComparisonGroupLegend,End of image description. Label: Comparison Group Median (N 21052172120131110Received awardin 4 yearsReceived awardin 6 yearsReceived awardin 8 yearsStill enrolled atsame institutionEnrolled atanother institutionReceived awardin 4 yearsReceived awardin 6 yearsReceived awardin 8 yearsStill enrolled atsame institutionEnrolled atanother institutionCompletion and enrollment measuresYour institutionComparison Group Median (N 47)NOTE: Award measures are based on the highest award received after 8 years of entry and enrollment measures are based on students who did not receive an award after 8 years ofentry. Student cohorts (i.
to aid in the college search process. Additional information about IPEDS can be found on the . Frontier Community College (Fairfield, IL) Heartland Community College (Normal, IL) Highland Community College (Freeport, IL) . Student Financial Aid Fig. 6 and 7 Pg. 4 6) Military Benefits* [No charts applicable] .