Transcription
Brionne et al. BioData Mining(2019) T REPORTOpen AccessViSEAGO: a Bioconductor package forclustering biological functions using GeneOntology and semantic similarityAurélien Brionne*†, Amélie Juanchich† and Christelle Hennequet-Antier†* n Brionne, Amélie Juanchichand Christelle Hennequet-Antiercontributed equally to this work.BOA, INRA, Université de Tours,37380 Nouzilly, FranceAbstractThe main objective of ViSEAGO package is to carry out a data mining of biologicalfunctions and establish links between genes involved in the study. We developedViSEAGO in R to facilitate functional Gene Ontology (GO) analysis of complexexperimental design with multiple comparisons of interest. It allows to study largescale datasets together and visualize GO profiles to capture biological knowledge.The acronym stands for three major concepts of the analysis: Visualization, Semanticsimilarity and Enrichment Analysis of Gene Ontology. It provides access to the lastcurrent GO annotations, which are retrieved from one of NCBI EntrezGene, Ensemblor Uniprot databases for several species. Using available R packages and noveldevelopments, ViSEAGO extends classical functional GO analysis to focus onfunctional coherence by aggregating closely related biological themes whilestudying multiple datasets at once. It provides both a synthetic and detailed viewusing interactive functionalities respecting the GO graph structure and ensuringfunctional coherence supplied by semantic similarity. ViSEAGO has been successfullyapplied on several datasets from different species with a variety of biologicalquestions. Results can be easily shared between bioinformaticians and biologists,enhancing reporting capabilities while maintaining reproducibility. ViSEAGO ispublicly available on https://bioconductor.org/packages/ViSEAGO .Keywords: Gene ontology, Functional genomics, Visualization, Cluster analysis,Semantic similarity, Annotation, Enrichment testIntroductionLarge -omic datasets are nowadays easily produced. While bioinformatical and biostatistical data analyses are quite robust, functional analysis remains a critical step of thesehigh-throughput studies. One essential resource for such analysis is Gene Ontology(GO) [1, 2], that provides an unified vocabulary to describe gene functions (GO terms)and relations between them in three categories: biological processes (BP), molecularfunctions (MF) and cellular components (CC). GO annotation represents the association between a gene and a GO term. For each category, GO is structured in a graph,where each GO term is a node and edges are relations between GO terms. GO termannotations including GO acyclic graph and GO terms association tables are currentlymaintained and improved in major databases. However, depending on the database being used, there are important differences between supported species and corresponding The Author(s). 2019 Open Access This article is distributed under the terms of the Creative Commons Attribution 4.0 InternationalLicense (http://creativecommons.org/licenses/by/4.0/), which permits unrestricted use, distribution, and reproduction in any medium,provided you give appropriate credit to the original author(s) and the source, provide a link to the Creative Commons license, andindicate if changes were made. The Creative Commons Public Domain Dedication waiver ) applies to the data made available in this article, unless otherwise stated.
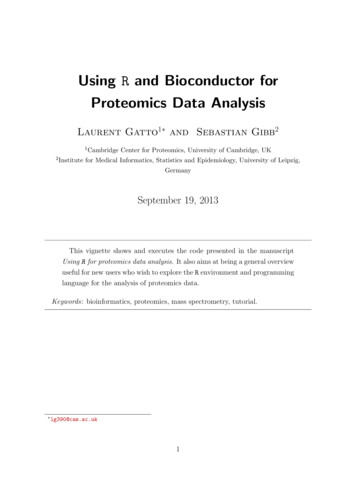
Brionne et al. BioData Mining(2019) 12:16genes knowledge. This has a strong impact on GO annotations, enrichment tests anddownstream analyses [3]. This statement is clearly illustrated in Fig. 1 with availableannotations for three golden standard models such as human, mouse, zebrafish and fivelivestock species such as cow, chicken, pig, sheep and rabbit. Numbers of GO annotations by category (MF, BP and CC) vary between databases and between species withindatabase for the eight selected vertebrate species. Globally, GO annotations are moreinferred computationally for all species, but experimental annotations represent a goodpart of human and mouse annotations (Fig. 1). Ensembl database contains moreannotations than NCBI especially for livestock species due to the use of EnsemblCompara annotation pipeline, which increases the number of terms based on theprojection of manually annotated GO terms with experimental evidence type fromorthologous genes [4].Functional enrichment analysis consists in finding which GO terms are significantlyover-represented using GO annotations. Several algorithms and tools for functional enrichment test have been developed [5]. High-throughput studies produce large-scale listsof enriched GO terms, especially in the context of multi-factor experiments. The aim offunctional analysis is then to explore lists of GO terms and facilitate biological interpretation. The GO graph provides meaningful links between GO terms, based on the variousrelationships (is a, part of, related to, regulates ). Closest GO terms in the graph sharehigh semantic similarity (SS) and also functional meaning. Indeed, SS is based on the likeness of meaning between biological features. In the last decade, many tools have been developed to compute SS between GO terms and sets of GO terms [6, 7] in differentbiological applications. SS methods are divided into three categories: those only based onterm frequency in a corpus (IC-based, like Resnik’s method [8]), those only based on hierarchical relationships between terms (graph-based like Wang’s method [9]), and thoseFig. 1 Database impacts on GO annotation. Bar plot of the number of GO annotations available forMolecular Function, Biological Process and Cellular Component category of protein-coding genes in twomajor databases (NCBI, Ensembl) on three golden standard models with Human, Mouse, Zebrafish andseven livestock animals with Chicken, Cow, Pig, Rabbit, Salmon, Sheep and Trout. Computational (blue) andExperimental (orange) evidence are represented.Page 2 of 13
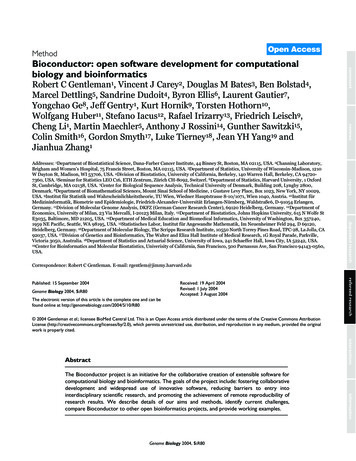
Brionne et al. BioData Mining(2019) 12:16based on hybrid method (like GOGO algorithm [10]). To our knowledge, several tools areimplemented to run enrichment tests combined to a downstream analysis that organizedthe output (using semantic similarity or other algorithms). Surprisingly, only few toolsprovide support for visualization of lists of GO terms and easier biological interpretation(Table 1) [11–15]. We developed ViSEAGO to carry out a data mining of biological functions supported by GO terms and establish links between terms and genes involved in thescientific study. The acronym stands for three major concepts used in the package (Fig. 2):Visualization, Semantic similarity and Enrichment Analysis of Gene Ontology(ViSEAGO). By using last current GO annotations, users can at once easily perform multiple enrichment tests on large datasets from complex experimental design. It provides interesting functionalities to organize biological functions into clusters by using GOsemantic similarity, an adapted distance computations between GO terms. ViSEAGO captures functional similarity based on GO annotations by respecting the topology of GOterms in the GO graph. Hence, it allows enhancing classical functional GO analysis (Table1). Moreover, through an user-friendly package developed in R language, it facilitates biological interpretation, supported by GO annotations, using several visualizations, like dendrogram of GO terms, MDS of GO terms, heatmap of enrichment p-values. It allows datamining of GO terms at different scales, from one term to cluster of GO terms and eventually groups of clusters.Based on the topology of the GO graph, thanks to the use of semantic similarity, it allowsto look for functional coherence in large dataset and to establish relationships betweengenes and functions. We demonstrate its use with publicly available RNA-seq datasets(mouse and chicken) and MeDIP dataset (cattle) with different annotation databases.MethodsThrough ViSEAGO, a functional analysis is conducted using the following steps: reading oneor multiple lists of genes of interest associated with a reference gene set (i.e. gene background) and loading the last current GO terms’ annotations from selected database in section“GO annotation”, performing functional enrichment tests in section “Enrichment Analysis”,computing semantic similarity and visualizing clusters of GO terms in section “Visualization& Semantic similarity” (Fig. 2). ViSEAGO offers the advantage of performing all analyses inthe same statistical environment R, from DE genes identification to the discovery of biological functions of interest. Although the package was developed with differential expressionanalysis in mind, it can be used with any list of genes, proteins or genomic features.Loading experimental data and GO annotationsFirst, the selected genes of interest, i.e. differentially expressed genes (DE), are divided intoone or more lists of genes depending on experimental design. The reference list can be customized. In the case of differential analysis, the reference list will be the list of all expressedgenes. We highly recommend to perform functional analysis with all genes of interest (i.e.without threshold on fold change) to maintain a continuum between underlying biologicalfunctions. Depending on species and databases, GO term annotations are then performedon these lists of genes with category BP, MF or CC. Available species (animals, plant, fungi,bacteria.) can be displayed from the selected database with ViSEAGO::available organismsmethod, before fetching the required GO annotations with the ViSEAGO::annotate method.Page 3 of 13
RR, , 12]Toolmixed types of geneidentifiers converted toEnsembl gene IDGeneID, Ensembl gene ID,can be converted in themoduleGeneID, Ensembl gene ID,Affymetrix probes, IlluminaID, Agilent ID(Do not allow lists of 3000identifiers)Input identifiers for GOannotationOld and current release,Ensembl, Entrez, Uniprot,Bioconductor databasesGeneID, Ensembl gene ID,Uniprot ACCFixed release, UniProt and Nosupported several speciesFixed release, Ensemblsupported speciesCurrent release,Bioconductor databasesFixed release, Ensembl,Entrez, UniprotGO Annotation DatabaseGO terms SSFisher ExactNoHypergeometricHypergeometricIC-based, Graphbased (computedfor visualization)IC-based(computed forvisualization)NoIC-based, Graphbased(computed)Fisher Exact (EASE) No(used gene’sKappa similarity)Enrichment testsummary table, bar plot,upset, MDS plot,clustering (centered GOterms)summary table, scatterplot, interactive map,TreeMap, export R plot(centered GO terms)NoYestree like list of enrichedGO terms, summary tablesummary table, bar plot,dot plot, enrichmentmap, networksummary table, bar plot,Gene-term 2D view,clustering (centeredgenes)NoYesNoSets of GO Visualizationterms SSTable 1 Description of functionalities supported by different tools focused on biological interpretation from GO raphBrionne et al. BioData Mining(2019) 12:16Page 4 of 13
Brionne et al. BioData Mining(2019) 12:16Fig. 2 Illustrated ViSEAGO package. A complete ViSEAGO analysis is presented from annotation of lists offeatures, enrichment tests to organization and viszualisation of GO terms thanks to semantic similarity. Initalic, illustration of ViSEAGO features using case 1 studyLast current GO annotations are extracted at a given time by querying NCBI EntrezGene,Ensembl or Uniprot databases to ensure reliable functional analysis (Fig. 2, Section “GOAnnotation”). To re-use data and reproduce analyses, ViSEAGO allows the use of older versions of some databases.Functional enrichment analysisViSEAGO addresses the problem of functional analysis in the context of complex experimental designs and large lists of genes of interest. Functional enrichment tests arePage 5 of 13
Brionne et al. BioData Mining(2019) 12:16performed for each list of genes of interest compared to the gene background. Nothreshold is applied and results are combined together. The most popular test to perform a functional enrichment analysis is the Fisher’s exact test [5]. P-values measurethe degree of independence between belonging to the GO term and being enriched.They are unadjusted for multiple testing in this exploratory context. ViSEAGO offersall statistical tests and algorithms developed in the Bioconductor topGO R package[16], taking into account the topology of GO graph by using ViSEAGO::create topGOdata method followed by the topGO::runTest method. A table of results that summarizes functional enrichment tests performed for each list of genes is built usingViSEAGO::merge enrich terms method. The number of enriched GO terms is displayedin a barchart plot using ViSEAGO::GOcount. The number of GO terms overlappingbetween lists of interest is also available in the upset plot with ViSEAGO::Upset (Fig. 2,Section “Enrichment Analysis”). Thus, ViSEAGO allows comparison of biologicalfunctions associated with each list of enriched GO terms in the study. Users can interactively sort the table of results by p-values or query by GO term.Semantic similarity between GO terms and sets of GO termsExploring hundreds of statistically significant GO terms in a “flat” table can be challenging in a complex study with multiple conditions. To catch the group structure fromthe GO terms data, the choice of measure of similarity between pairs of GO terms is akey criterion. ViSEAGO offers therefore several methods based on semantic similarity(SS) to group together enriched GO terms according to their annotation and theirtopological position in the GO graph. The ViSEAGO::compute SS distance method isbased on the Bioconductor GOSemSim R package [17] which implements the five common SS methods between GO terms. Four of the SS algorithms use the informationcontent of a GO term (IC), which is computed as the negative log probability of occurrence of the term in a set of GO terms. A rarely used term contains a greater amountof IC. A Graph-based method as the Wang’s method is also available to compute SS between two GO terms based on the topology of GO graph. The Wang’s method methodmaintains topology of the GO graph throughout analyses. GO terms are organized intoclusters to capture functional coherence in the study before analyzing their enrichmentp-values.The ViSEAGO::compute SS distance method also computes four distance calculations between sets of GO terms [17], including the Best-Match Average (BMA) methodwhich appears to be the best combination approach [18]. BMA calculates the averageof all maximum similarities over all pairs of GO terms between two GO term sets,averaged with its reciprocal to obtain a symmetric similarity [18, 19].Visualization of clusters of GO termsViSEAGO helps users to organize GO terms using SS in order to interpret functions involved in the study using multidimensional statistical methods. Multi-DimensionalScaling (MDS) and clustering heatmap plots are used to compare functional profiles asa whole rather than a set of unrelated GO terms (Fig. 2, Section “Visualization and Semantic similarity”). The level of similarity between enriched GO terms defined by SS isexplored using a MDS plot generated with ViSEAGO::MDSplot method. To go further,Page 6 of 13
Brionne et al. BioData Mining(2019) 12:16a hierarchical clustering creates clusters of enriched GO terms respecting the GO graphstructure with ViSEAGO::GOterms heatmap method. An appropriate dissimilarity between enriched GO terms based on SS and an aggregation criterion for the clusteringare chosen to reflect the functional coherence of the analysis. Clusters of enriched GOterms are produced by cutting the dendrogram in a static or dynamic mode developedin dynamicTreeCut R package [20]. In addition to the dendrogram of GO terms withtheir description, a heatmap plot is produced with -log10(p-value) from functionalenrichment test(s) and IC value. The organization of enriched GO terms into clustersrespecting the GO graph topology is entirely supported by the dendrogram andenriched by the results of the functional enrichment tests of the study and completedby the value of IC. This clever combination ensures functional coherence and facilitatesbiological interpretation. In this way, GO terms within the same cluster share similarbiological functions.To gain further insights, relationships between sets of GO terms can be exploredusing a similar approach. Similarities between sets of GO terms defined by SS are explored using a MDS plot generated with ViSEAGO::MDSplot method. Then, sets of GOterms are organized in a colored dendrogram and grouped into clusters usingViSEAGO::GOclusters heatmap method. In addition to the dendrogram, the sets of GOterms are renamed by their first common GO term ancestor and a heatmap of thenumber of GO terms in each set is produced.Reporting and interactivityTraceability is ensured by recording major used parameters and results at each step ofthe analysis. ViSEAGO provides interesting functionalities to explore the table of resultsaccording to p-values from enrichment tests and semantic similarity through GOclusters. Moreover, interactive functionalities implemented thanks to plotly R package[21] allow a visualization of biological themes at different scales.ResultsViSEAGO package has been applied to three biological cases to illustrate its functionalities. All functions and specific parameters used for the three cases are specified inadditional file 1.Case 1: role of alveolar luminal cells in the mouse mammary gland duringpregnancyTo illustrate how ViSEAGO assesses and compares biological themes, we analyzed thepublicly available expression dataset (Gene Expression Omnibus with accession numberGSE60450) of luminal cells in the mouse mammary gland [22], using a generalizedlinear model and quasi-likelihood tests [23], as proposed in edgeR vignette. Among the15,804 expressed genes, we obtained 7699 DE genes for the comparison pregnant versus lactate, 9583 for the comparison virgin versus lactate and 7302 for the comparisonvirgin versus pregnant. For each comparison of the study, enrichment of GO BP termsare tested using a Fisher’s exact test with the elim algorithm [16] (from topGO Package)and mouse GO annotation from EntrezGene database (through Bioconductor org.Mm.eg.db database). In the mouse GO annotation version Bioconductor 2018-Apr4, 23,Page 7 of 13
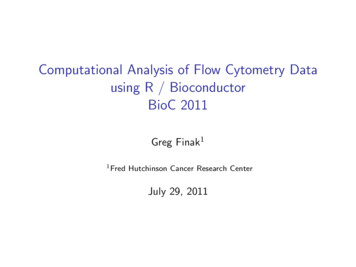
Brionne et al. BioData Mining(2019) 12:16843 genes are annotated with at least one BP GO term. Enrichment tests revealed respectively 198, 151, and 232 BP enriched GO terms for the three comparisons (p-value 0.01). A clustering heatmap plot (Fig. 3) using SS distance based on Wang’s methodbetween enriched GO terms and ward.D2 aggregation criterion allows to data mineGO terms and capture biological meaning. Enriched GO terms are organized in thedendrogram and branches are colored depending on their cluster assignation. Extracting biological insights from this plot highlights three major pathways: signaling pathways, metabolism, and epithelial cell proliferation and morphogenesis. Those pathwaysare already discussed in the original publication [8], but ViSEAGO highlighted other interesting groups revealing biological pathways to further investigate. It also pinpoints,using interactive cluster-heatmap zooming capabilities, cholesterol biosynthetic process(GO:0006695) as the most significantly enriched GO term (p-value 2.6 10 06 and genefrequency 34/37).Case 2: functional genomics of the digestive tract in broilersThe aim of the study [24] was to gather knowledge on genes involved in digestivefunctions in the context of the adaptive capacity of the broilers to changing and evenunfavorable dietary conditions. The transcriptome was performed on four digestivetract segments representing the digestive efficiency process (Bioproject accessionnumber PRJNA418230). Differentially expressed genes were identified between the fourdigestive tract segments by fitting a generalized linear model with edgeR package [23].Then, DE genes were organized in seven gene clusters to focus on co-regulated genesthroughout the digestive tract and their functions. Enrichment tests were performedwith ViSEAGO package independently for each gene cluster containing at least 300 DEFig. 3 Visualization of ViSEAGO’s functional analysis from mouse RNA-seq with three different transcriptomicdatasets. Clustering heatmap plot that combines a dendrogram based on Wang’s semantic similarity distance andward.D2 aggregation criterion, a heatmap of -log10(p-value) from functional enrichment tests and informationcontent (IC). Focus is made on cholesterol biosynthetic process, a major pathway involved in the studyPage 8 of 13
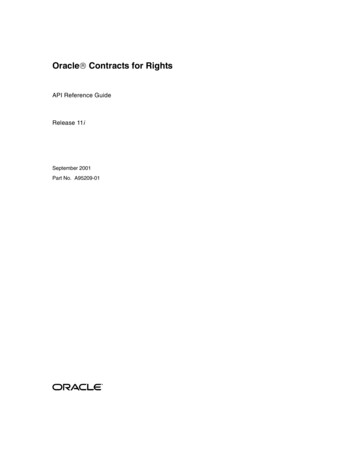
Brionne et al. BioData Mining(2019) 12:16Page 9 of 13genes up to more than 3000. Annotation by GO for BP was used and Fisher’s exact testwith the elim algorithm was performed [16]. This algorithm improves the enrichmentanalysis by taking into account local dependencies between GO terms in GO graph,especially in the case of large data sets. Among the 12,656 expressed genes, 7159possessed at least one functional GO term in the Ensembl version 94 database (56%).Although functional annotation of the chicken genome remains poor in comparison tomodel species such as the mouse, functional analysis is still relevant using orthologousrelationships with well-annotated species. A total of 456 GO terms were enriched(p-value 0.01) in at least one gene cluster and, among them, 445 were unique(Fig. 4a). This shows that gene clusters are driven by specific functions. The number of enriched GO terms for each gene cluster ranged from 15 to 181, which ismentioned in the output from ViSEAGO::merge enrich terms method, ensuringtraceability of enrichment tests. Results reported in a summary table can be easilyand interactively investigated by term (like cholesterol, transport, immune system.)and sorted by p-values. Exploring hundreds of statistically significant GO terms ina “flat” table can be challenging in a complex study with multiple conditions.Hence, ViSEAGO provides an interactive graphic support to facilitate biological interpretation. Semantic similarity between GO enriched terms are computed usingWang’s SS method to connect together related GO terms by their annotation andposition in the GO graph. Enriched GO terms are organized in a dendrogram builtfrom a hierarchical clustering using ViSEAGO::GOterms heatmap based on SS distance between enriched GO terms and ward.D2 aggregation criterion (Fig. 4b).This interactive visualization allows the user to discover at a glance the generalBAFig. 4 Visualization of ViSEAGO’s functional analysis from chicken RNA-seq with seven different transcriptomicdatasets. a Upset plot representing overlaps between lists of enriched GO terms, b Clustering heatmap plotcombining a dendrogram based on Wang’s semantic similarity distance and ward.D2 aggregation criterion, aheatmap of -log10(p-value) from functional enrichment test(s) of the seven lists of genes and informationcontent (IC)
Brionne et al. BioData Mining(2019) 12:16data structure of GO terms and to find out best functions that will explain the digestive efficiency process. For instance, clear groups of organized GO terms relatedto fatty-acid metabolism are found in the intestine (Fig. 4b). Those functions areessential in the intestine and must work properly for effective digestion.Case 3: Hypomethylation in bull sperm targets specific genomic functionsWe re-used and re-analyzed Methylated DNA immunoprecipitation (MeDIP) datasetprovided by [25] to explore ViSEAGO’s functionalities and focus on relationships between sets of GO terms (Gene Expression Omnibus database accession numberGSE102960). One aim of the study was to identify hypomethylated CpGs genomic regions and their associated functions from MeDIP datasets in bull sperm in comparisonto bovine somatic cells (fibroblasts and liver cells).Among the 1632 and 3109 hypomethylated regions identified in bull sperm in comparison to fibroblast (FvsS comparison) and liver (LvsS comparison) cells respectively,732 and 1229 unique genes with a match in regulatory elements (promoter: -1 kb to 0.1 kb along TSS; downstream: 1 kb along TES) have been identified using GenomeFeatures R package eatures).Using Fisher’s exact test, we performed enrichment tests of GO terms associated withBP category and retrieved GO annotation from Ensembl version 81 (version used bythe authors). We identified 91 enriched GO terms for FvsS comparison and 53 for LvsScomparison (p-value 0.01). Thirty of the enriched GO terms are shared by the twolists. Several GO terms were already found in the original paper ([25], Fig. 4) and linkedto mRNA processing and spermatogenesis (Fig. 5a). For instance, piRNA metabolicprocess (GO:0034587) was found with an enrichment p-value of 0.026 and is also identified in our study with a p-value of 0.0018 (Fig. 5a, cluster cl3). This enrichment issupported by 4 genes (ASZ1, PLD6, PIWIL2, MAEL) including two out of three alreadyidentified (PLD6, MAEL), and reported in the results table (not shown). In complement, we highlighted several GO terms that were not previously found in the study(Fig. 5a) to allow a deeper analysis of the datasets. For instance, the GO term “cellularprocess involved in reproduction in multicellular organism” (GO:0022412) is the mostsignificant term in both comparisons (1.07 10 07 and 6.76 10 06 for FvsS and LvsSrespectively).A hierarchical clustering using Wang’s SS method and ward.D2 aggregation criterionthat was dynamically cut led to the identification of 21 functional groups of GO terms(Fig. 5a). To easily interpret the biological functions carried out by the 21 groups, SSbetween the 21 sets of GO terms were computed using BMA distance. Proximities ofthese functional groups were shown in a MDS plot (Fig. 5b) and a heatmap plot (Fig. 5c).We highlighted three major biological pathways: RNA processing (22 GO terms);spermatogenesis, fertilization, and sexual reproduction (25 GO terms); and cellular andother processes (67 GO terms) notably associated to cellular division (chromosomeorganization, meiosis and mitosis), signal transduction, RNA transport, and meiosis/spermatogenesis. Part of those GO terms were already found in the original paper butlinks between them were based on enrichment p-values instead of semantic similarity.Using ViSEAGO, sets of GO terms are clearly organized to facilitate functional interpretation taking into account similarities between GO terms and set of GO terms. Thanks toPage 10 of 13
Brionne et al. BioData MiningA(2019) 12:16Page 11 of 13BCFig. 5 Visualization of ViSEAGO’s functional analysis from cattle with three MeDiP datasets. a Clusteringheatmap plot combining a dendrogram based on Wang’s semantic similarity distance and ward.D2aggregation criterion, a heatmap of -log10(p-value) from functional enrichment tests, and informationcontent (IC). b MDS plot based on BMA distance representing the proximities of groups obtained bycutting dendrogram in (a). Dot size depends on the number of GO terms within each cluster. c Heatmapplot of functional sets of GO terms combining a description of the first common GO ancestor of each set ofGO terms, a heatmap with the number of GO terms in each set, a dendrogram based on BMA semanticsimilarity distance and ward.D2 aggregation criterionViSEAGO, we revealed three major functions involved in the study without losinginformation at the GO term level.ConclusionsFunctional enrichment analysis remains a major challenge especially on large datasetsand complex experimental designs. ViSEAGO R package is a generic tool for functionalanalysis based on Gene Ontology that meets this challenge. The novelty of ViSEAGO isproviding by the association of the semantic similarity and visualization to focus onbiological interpretation with respect for GO graph. ViSEAGO’s functionalities areextended compared to most functional analysis tools in three major aspects: (1)emphasize functional coherence by aggregating closely related biological themes basedon the GO graph topology; (2) reliability of the functional interpretation using the lastcurrent GO annotations; (3) interactive visualization both synthetic and detailed tofacilitate biological interpretation. At the end, ViSEAGO helps users to perform a reproducible functional analysis and to prioritize genes to investigate.AbbreviationsBMA: Best-match average; BP: Biological process; CC: Cellular component; DE: Differentially expressed; GO: Geneontology; IC: Information content; MDS: Multi-Dimensional Scaling; MeDIP: Methylated DNA ImmunoPrecipitation;MF: Molecular function; RNA: RiboNucleic Acid; SS: Semantic similarity; TES: Transcription end site; TSS: Transcriptionstart site
Brionne et al. BioData Mining(2019) 12:16AcknowledgmentsWe would like to thank biologists who facilitated re-use of their data by describing metadata and providing useful details on analyses. Authors appreciated feedback and support from members of UMR BOA at INRA.Authors’ contributionsAB, AJ and CHA conceived the project. AB conceived the R package. AB, AJ and CHA refined the proposed package.AB, AJ and CHA analyzed data and interpreted results. CHA wrote the first draft of the manuscript. AB and AJ madechanges and additions to the manuscript. All authors read and approved the final manuscript.FundingThe authors received no specific funding for this work.Availability of data and materialsUpon publication, ViSEAGO R package will be freely available on
Description of functionalities supported by different tools focused on biological interpretation from GO annotation Tool Interface,GO Annotation Database Input identifiers for GO Langage annotation Enrichment test GO terms SS Sets of GO terms SS Visualization Multiple lists Graph interactivity David https://david.ncifcrf. gov/ [11, 12]