Transcription
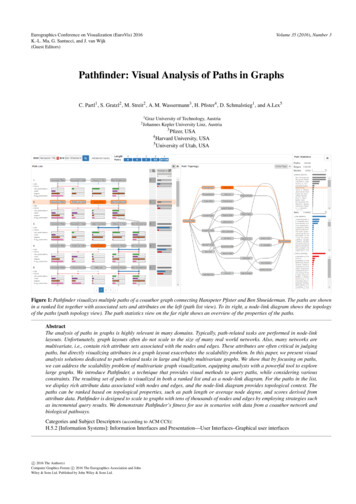
Volume 35 (2016), Number 3Eurographics Conference on Visualization (EuroVis) 2016K.-L. Ma, G. Santucci, and J. van Wijk(Guest Editors)Pathfinder: Visual Analysis of Paths in GraphsC. Partl1 , S. Gratzl2 , M. Streit2 , A. M. Wassermann3 , H. Pfister4 , D. Schmalstieg1 , and A.Lex51 GrazUniversity of Technology, AustriaKepler University Linz, Austria2 Johannes3Pfizer, USAHarvard University, USA5University of Utah, USA4Figure 1: Pathfinder visualizes multiple paths of a coauthor graph connecting Hanspeter Pfister and Ben Shneiderman. The paths are shownin a ranked list together with associated sets and attributes on the left (path list view). To its right, a node-link diagram shows the topologyof the paths (path topology view). The path statistics view on the far right shows an overview of the properties of the paths.AbstractThe analysis of paths in graphs is highly relevant in many domains. Typically, path-related tasks are performed in node-linklayouts. Unfortunately, graph layouts often do not scale to the size of many real world networks. Also, many networks aremultivariate, i.e., contain rich attribute sets associated with the nodes and edges. These attributes are often critical in judgingpaths, but directly visualizing attributes in a graph layout exacerbates the scalability problem. In this paper, we present visualanalysis solutions dedicated to path-related tasks in large and highly multivariate graphs. We show that by focusing on paths,we can address the scalability problem of multivariate graph visualization, equipping analysts with a powerful tool to explorelarge graphs. We introduce Pathfinder, a technique that provides visual methods to query paths, while considering variousconstraints. The resulting set of paths is visualized in both a ranked list and as a node-link diagram. For the paths in the list,we display rich attribute data associated with nodes and edges, and the node-link diagram provides topological context. Thepaths can be ranked based on topological properties, such as path length or average node degree, and scores derived fromattribute data. Pathfinder is designed to scale to graphs with tens of thousands of nodes and edges by employing strategies suchas incremental query results. We demonstrate Pathfinder’s fitness for use in scenarios with data from a coauthor network andbiological pathways.Categories and Subject Descriptors (according to ACM CCS):H.5.2 [Information Systems]: Information Interfaces and Presentation—User Interfaces–Graphical user interfacesc 2016 The Author(s)Computer Graphics Forum c 2016 The Eurographics Association and JohnWiley & Sons Ltd. Published by John Wiley & Sons Ltd.
C. Partl et al. / Pathfinder: Visual Analysis of Paths in Graphs1. Introduction2. Tasks and RequirementsGraphs capture relationships between items, for example, friendships between people in social networks, interactions of genes inbiological networks, or researchers coauthoring scientific papers incollaboration networks. Graph analysis and visualization have always been important for scientific discovery and decision-making,but their role and ubiquity have increased in the last decade. It isnow common to encounter networks that cannot be sensibly drawndue to both computational and perceptual constraints. The analysisof graphs of nontrivial size depends on a combination of algorithmic, statistical, and visual approaches [vLKS 11]. Also, interaction, for example, through queries, plays a critical role in tacklingscalability problems.We introduce a set of requirements for a query-based path visualization technique. In our requirement analysis, we focus on staticnetworks that are highly multivariate, i.e., the nodes are associatedwith rich attributes and additional sets. Our assumptions on datasetsare described in detail in Section 4. We use these requirementsto evaluate the related work, to analyze our Pathfinder technique,and to identify areas of future work. Our choice of requirements isbased on discussions with potential end-users, our analysis of theliterature on path visualization, and the task taxonomy for generalgraph visualization by Lee et al. [LPP 06b]. Lee at al. distinguishtopology-based tasks and attribute-based task, as well as browsing and overview tasks. The browsing tasks are related to topology(follow path and revisit) and the overview task is concerned withanalyzing general properties of the graph, such as estimating theoverall size. For our requirements, we assume an underlying fundamental task of exploring paths. Some of the tasks introduced byLee et al., especially regarding connectivity (identifying clusters,connected components, bridges, and articulation points), cannot beaddressed with a pure path-based approach. Hence, we envisionPathfinder to be part of a larger graph-visualization system to address those tasks in the future.Graphs are also increasingly associated with rich node and edgeattributes. In many cases, only the combined analysis of attributesand topology can lead to meaningful insights. However, the visualization and analysis of these rich attributes present additional challenges [KPW14], as there is a trade-off between optimizing a layout for conveying topology and attributes. As more data is collectedand the graphs become bigger, scalable methods to extract knowledge and reason about them become more important. Many taskson such large graphs cannot be addressed by showing all nodes andlinks, even if a layout could be drawn.An important class of tasks for graph analysis is concerned withpaths. Learning about how two suspects are connected in a criminal case or understanding why two genes are co-regulated are examples of important domain tasks that can be abstracted to pathanalysis tasks. For small networks, these path analysis tasks can besolved by visually finding paths, for example, in a node-link layout.In larger networks, however, queries are essential to enable thesetasks. In this paper, we introduce methods to comprehensively address path analysis tasks.Our primary contribution is Pathfinder, a technique for the visualanalysis of paths queried from large and multivariate networks. Weintroduce methods to (a) interactively query for paths and dynamically refine queries, (b) visualize the resulting paths and their relationships, (c) investigate the attributes associated with the paths,and (d) rank and compare paths. We also have developed a list ofrequirements for path analysis that we use to justify and evaluateour design and analyze related techniques.We realize and test our technique in a prototypical implementation. We pay particular attention to scalability, so that we canhandle tens of thousands of nodes and edges interactively. We employ strategies to deliver fast and progressive results [FPDs12], i.e.,paths are added to the visualization as soon as they are found. Theseimmediate results can be used to evaluate and refine queries, evenbefore a complete and comprehensive answer is available. A demoversion of Pathfinder is available at http://demo.caleydo.org/pathfinder/.We show in a use case that our methods and the Pathfinder toolcan help answer important questions about gene regulatory networks, when analyzing the networks in the context of rich experimental measurements.R I: Query for paths. Users should be able to easily query forpaths that adhere to some criteria. A simple query searches for thepaths connecting two nodes. Other criteria, such as querying basedon sets (find short paths that connect node A with any node in set S)or topological restrictions (find short paths from A to C that do notgo through B), must also be supported. It should be easy to refinean existing query, as analysts often can identify restrictions oncethey see results matching their initial query.R II: Visualize attributes. Many networks contain rich and heterogeneous attributes for nodes and edges. Understanding these attributes is often critical for judging paths. In a gene regulatory network, for example, low values for associated experimental data cantell analysts that the path is inactive for the given samples.R III: Visualize group structures in paths. Groupstructures,such as set relationships and clusters, provide additional information about relationships between nodes. For example, they areimportant when judging the relevance of an edge in a path. If twoconnected genes occur in many pathways, for example, it is likelythat their relationship is important.R IV: Rank paths. A common goal of users querying for pathsis to find “good” paths, according to some criteria. These criteriasometimes are as simple as finding the shortest path, but can alsoinvolve a more intricate combination of topological features andattributes. A path visualization technique should allow its users todynamically define these criteria and rank paths according to them.R V: Visualize topology context. The relevance of a path for ananalysis can be influenced by its surrounding topology properties.For example, in a gene-regulatory network, feedback cycles arecommon, and it is important to know whether a path is involvedin one of these cycles.R VI: Compare paths. Comparing paths is important to evaluatesimilarity or dissimilarity between paths. As for path ranking, comparison can be based on many criteria, such as shared nodes, common set relationships, or similar attribute values. These similaritiesc 2016 The Author(s)Computer Graphics Forum c 2016 The Eurographics Association and John Wiley & Sons Ltd.
C. Partl et al. / Pathfinder: Visual Analysis of Paths in Graphsand differences are often not easy to spot, so a path visualizationtechnique should make this comparison easier.R VII: Group paths. It is common that many paths match a specific query, but multiple paths will be only slight variations of eachother. Ideally, a system should convey which groups of paths aresimilar and provide an overview of the main path classes, as thiscan reveal important paths that do not rank at the very top based onother criteria.In addition to these specific requirements, a path visualizationsystem must be scalable, as the costs of using and learning a sophisticated path visualization technique mainly pay off for large graphs.Finally, the system also should follow best practices of conventional graph visualization, such as overview (e.g., graph statistics)and details on demand (e.g., full information about sets or nodes).3. Related WorkThe two principal ways to visualize graphs are node-link diagramsand matrices. Node-link diagrams are generally regarded to be advantageous for topology-based tasks, whereas matrix diagrams areconsidered to be beneficial for tasks on the edge sets, e.g., whenvisualizing dense networks with edge weights.Visualizing all nodes and edges, in either node-link or matrixlayouts, does not scale to large graphs. There are two strategiesto address scale: top-down and bottom-up approaches. Top-downapproaches start by showing an overview using aggregation andsampling methods, and support drilling down into regions of interest. Luger et al. [LSG 15], for example, employ hierarchical andmotif-based aggregation in data provenance graphs. In bottom-upapproaches, the exploration starts with a small subset of a graph thatcan then be expanded. For example, in Treeplus [LPP 06a] a graphcan be continuously expanded in a flexible tree layout, starting froma seed node. Ham and Perer [vHP09], Abello et al. [AHSS13], andLuger et al. [LSG 15] use more sophisticated methods to select andexpand graph subsets based on degree of interest functions.Our approach belongs to the bottom-up approaches. We startby querying a large network for paths and visualize the result set,which can then be either further expanded or filtered. Most graphlibraries and databases support path-queries. The GUESS languageby Adar [Ada06], Orion by Heer and Perer [HP14], or the Neo4jdatabase are prominent examples of systems that support suchqueries. Here, however, we focus on the visual analysis of paths.Figure 2 shows four ways of visualizing paths in networks, where(a)-(c) are variations of a node-link diagram, and (d) makes use ofthe matrix layout.Path highlighting in node-link diagrams, as shown in Figure 2 (a), is supported by many graph visualization frameworks andtheir plugins. Typically, these tools support highlighting a shortestpath between two nodes. Examples are the two popular graph visualization tools Cytoscape [SOR 11] and Gephi [BHJ09]. Severaltools also show multiple short paths in a node-link diagram, suchas TimeArcTrees [GBD09], which presents the shortest paths foreach view in a small multiples arrangement of networks, or enRoute [PLS 13], which highlights all paths between two nodeswith bubble sets on top of a network.c 2016 The Author(s)Computer Graphics Forum c 2016 The Eurographics Association and John Wiley & Sons Ltd.GFCBADE(a)ABCAED(c)DCBHAED(b)ABCDEFGHA B C D E F GH11232(d)Figure 2: Four ways of visualizing paths in a graph, connectingthe nodes A and D: (a) highlighting in a node-link diagram, (b)drawing only the subset of the graph connecting node A and D, (c)drawing a path list, (d) enumerating edges in a matrix.These approaches are very limited in terms of scalability, butthey support topology-based tasks (R V, R VI) for smaller networks. They typically do not support rich queries (R I), but ratherrely on manually selecting two nodes, for which the path is calculated. General purpose node-link diagrams are also not ideal forvisualizing rich attributes [PLS 13] (R II) and have limited scalability with respect to visualizing group structures [VBW15] (R III).Rendering paths as node-link diagrams, as shown in Figure 2 (b), is similar to the approach described above, with the critical difference that only nodes and edges of the paths are rendered.As a consequence, this approach scales to much larger networks,yet makes judging the topology context (R V) harder.Most examples given in this and the next section are for semanticweb networks, which capture relationships between many types ofentities. A typical example is to search for relationships betweenpeople, e.g., to visualize how Albert Einstein and Kurt Gödel areconnected. These networks are highly heterogeneous, containing amultitude of node and edge types. For such networks, attribute andset relationships are of only limited interest, and consequently, fewof the techniques support them (R II, R III).RelFinder [HHL 09] is an example of such a technique for semantic web networks. It supports both queries and dynamic queryrefinement (R I). RelFinder, however, has no means to rank paths(R IV) and does not provide dedicated methods to compare paths(R VI). Tekusova and Kohlhammer [TK08] show paths connectingtwo nodes (companies in that case), but in contrast to many otherapproaches, they also show important nodes that are not part of thepaths (R V).Path lists (Figure 2 (c)) are also mostly based on queries, but instead of visualizing each node only once in a node-link diagram,each path is visualized in a separate row as part of a list. Nodesthat occur in multiple paths are duplicated. Two examples thatuse this list-based approach to visualize semantic web data andalso support rankings of paths (R IV) are the work by Alemanet al. [AMHWA 05] and SemRank [AMS05]. The former rankspath as a combination of static attributes, such as path length andtrust, whereas the latter computes a semantic score. Neither of those
C. Partl et al. / Pathfinder: Visual Analysis of Paths in Graphsrankings is interactive, and neither of the tools supports requirements beyond ranking and querying. Two semantic web tools support aggregation of paths into classes (R VII). Explass [CZQ14]aggregates on a single level, whereas RelClus [ZCQ13] uses hierarchical aggregation. Both tools also support the refinement ofqueries (R I) based on facets, but do not address other requirements.enRoute [PLS 13] uses a hybrid path list/path highlighting approach. In addition to visualizing the path in the node-link layout,users can select a single path, which is shown in a linear layout ina separate view for the purpose of multivariate data visualization(R II). Entourage [LPK 13], an extension of enRoute, also showsbasic set relationships. enRoute does not support advanced queries(R I) and is limited to the analysis of single paths. However, weadopt its approach to attribute visualization and extend it to thegeneral case of multiple paths.Matrices without extensions are considered ill-suited fortopology-based tasks and, consequently, are rarely used to visualize paths. There is, however, an extension by Henry and Fekete,Matlink [HF07], that supplements a matrix with explicit linksbetween the rows and columns, respectively. MatLink also automatically calculates the shortest paths between two selected nodes.The paper compares path finding tasks in MatLink with a node-linkdiagram and a matrix that uses highlighting for shortest paths asshown in Figure 2 (d). The authors found that users performed beston shortest path tasks with MatLink. Shen and Ma introduce anaugmentation for matrices that visualizes multiple paths as linkson top of a matrix [SM07], with the goal of combining the benefitsof matrix layouts with good path-finding performance. However,their approach works well for only a limited number of paths.The specific examples discussed here do not support complexqueries (R I), but matrices could be used in combination withqueries, just as node-link diagrams. However, they are ill-suited fora larger number of attribute rich paths (R II).4. Dataset Characteristics and ExamplesWe consider static graphs where both nodes and edges can be associated with attributes. These attributes can be sets, categories, ornumerical data. There can be different types of nodes and edges.For example, a network can contain nodes of types “places” and“people”. These types commonly define what attributes are associated with them. In this example, all “places” could be associatedwith coordinates, whereas all “people” have an age.Node and edge attributes can be very rich. In many biologicalnetworks, nodes of a particular type can be associated with rowsor columns of large matrices, containing, for example, gene expression data. These matrices typically contain samples taken frompatients or cell lines. The samples can be grouped to compare, forexample, different types of cell lines.Sets can be defined on the level of both nodes or edges, butthey are more commonly associated with nodes. We distinguishsets from categories, because they explicitly define additional relationships within a network.A path through a graph connects two nodes by a sequence ofedges and nodes. The length of a path is defined by the numberof hops between its start and end nodes. Many applications requireidentifying short (or cheap) paths between two nodes. The shortestpaths connecting two nodes can be computed with, for example,breadth-first search (BFS) or, when considering edge weights, withDijkstra’s algorithm. In practice, however, the shortest path mightnot be the “best” path, as other factors such as node or edge attributes or contextual knowledge play a role in identifying an important path. In many cases, defining a cost-function to find thecheapest path is not straightforward and requires human judgment.Thus, exploring a number of “candidate” short paths is important.Such paths can be computed with k-shortest path algorithms.In this paper, we use two networks to illustrate Pathfinder. Thefirst is a coauthor network that we created from extracting all ACMCHI and IEEE TVCG papers from the DBLP computer science library (http://dblp.uni-trier.de/). We treat authors asnodes and add an edge if two authors have coauthored a publication. We also consider individual papers as sets, i.e., a paper is a setthat contains all its authors. As attributes in this network, we provide node degrees, paper counts for each venue, and the number ofcitations to the visualization papers, which we extracted from theVisualization Publication Dataset [IHK 15]. This network containsabout 34k nodes, 45k edges, and 13k sets.The second network is extracted from the KEGG pathwaydatabase. Nodes in KEGG are primarily of two types: genes (proteins) and metabolites (intermediate chemical compounds). Edgesdescribe various kinds of interactions. Genes, for example, canwork in signaling cascades that influence each other based on activation levels (gene expression), which in turn can trigger a process,such as cell death. The most important nodes and edges associatedwith a specific function or disease are summarized in pathways. Wetreat these pathways as sets of nodes. We supplement this networkdata with gene expression and copy number data from the CCLEdataset [Bc12]. This dataset contains values for both gene expression and copy numbers for most genes (nodes) for 479 cell linestaken from 23 cancer tissues (originating, e.g., from lung, stomach,thyroid). Gene expression measures how active a gene is, whereascopy number measures how many copies of a gene a specific sample has. Typically, a healthy sample has two copies of each gene,but deletions (0 or 1 copies) or amplifications are possible. In total, this network contains about 11k nodes, 71k edges, and 300 sets(pathways).5. MethodOur goal was to develop a method for path analysis that is very scalable and addresses the requirements introduced in Section 2. Thekey to achieve scalability is path queries: we introduce a rich queryinterface that can cover a wide range of questions relevant to pathanalysis (R I). The visual representation of the graph is manifestedin the path list view, the path topology view, and the path statistics view. These views are part of a multiple coordinated view setupthat supports linking and brushing of paths and their elements. Thepath list is ideally suited to visualize attributes and sets (R II, R III)due to the linear layout of the individual paths, which allows usto juxtapose the nodes and edges with plots of the attributes. It isalso a perfect match to dynamically rank paths and explore thosec 2016 The Author(s)Computer Graphics Forum c 2016 The Eurographics Association and John Wiley & Sons Ltd.
C. Partl et al. / Pathfinder: Visual Analysis of Paths in GraphsFigure 3: The advanced interface showing a query where the startnode is either Hanspeter Pfister or Jarke van Wijk, the paths mustnot contain Jean-Daniel Fekete, and the last node is Ben Shneiderman or an author of the NodeTrix paper.rankings [GLG 13] (R IV). Additionally, the path list can be usedto compare paths (R VI), especially with respect to attributes andsets. The shortcomings of the path list are addressed by the pathtopology view, which provides the topological context (R V) andcovers the aspects of comparison with respect to topology (R VI).Also, the topology view is beneficial for an overview and for initial orientation. In the following sections, we introduce the variouscomponents of Pathfinder in detail.5.1. Path QueriesAs queries are at the heart of our technique, we introduce a sophisticated graphical interface for querying, paired with choices ofalgorithms, technologies, and concepts that make the analysis andquerying process efficient. The simplest queries are for individualnodes and their neighbors, or for the paths connecting two nodes. Infact, our collaborators mainly used queries of this simple type. Tomake this simple use case as smooth as possible our default queryinterface consists of two fields only: one for the start, and one forthe end node.Once such a query is triggered, we run a k-shortest path algorithm based on breadth-first search (BFS) to retrieve the shortestpaths between two nodes. While BFS cannot consider edge weightswhich, for example, Dijkstra’s algorithm can, BFS is faster in practice and response time is critical for interactive analysis systems.BFS has a runtime complexity of O( N E ), whereas Dijkstra’salgorithm has a complexity of O( N log( N ) E ), where N denotes the number of nodes and E the number of edges. Also, wecan consider weights later in the analysis process through interactive rankings on the resulting set of paths.which can be useful, for example, to find out how an author is connected to the authors of a paper of interest. In addition to the simplequery interface, Pathfinder also provides an advanced interface forspecifying more complex queries that consider topological restrictions, logical combinations of nodes, and node and edge properties.Topological restrictions can be used to consider, for example, onlypaths that go through a certain node, or contain a sequence of certain nodes. Logical restrictions can combine nodes and sets throughBoolean operations (AND, OR, NOT ). Also, Pathfinder can treat setrelationships as edges, if desired. Figure 3 shows a complex queryexample for a coauthor network, with an OR combination at boththe start and the end node and a topological restriction to excludeall paths that go through the node between them.Queries can be expressed either in the query interface or by interacting with elements in any of the views. For example, a user canexclude all paths through a certain node via its context menu in thepath list view, which simplifies query refinement (R I).Any change to the query acts as an immediate filter for the current set of paths, which guarantees rapid feedback. This is often sufficient for queries that restrict the result set, but queries that expandor change the result set have to be run against the whole network toproduce reliable results.5.2. Path List ViewPathfinder’s main view displays all paths that match a query in aranked and paginated list of paths (see Figure 1). Each path is displayed as a sequence of nodes and edges. For example, Figure 4shows the path from Jean-Daniel Fekete to Ben Shneiderman inthe coauthor network. A key benefit of this linear layout is that itallows us to easily show attributes associated with the nodes andedges (R II) and sets connecting the nodes below the path (R III).Compared to nonlinear layouts, this arrangements allows us to display multiple plots for each node. Attributes and sets can be hiddenon demand, which allows analysts to focus on the paths exclusively.Set-memberships of a node are indicated by a circle below thenode. If two successive nodes are within the same set, the circlesare connected by a line. As shown in red in Figure 4, tracing setExpanded SetsAggregated SetsAnother method to improve scalability is incremental results. Incremental and approximate results have been shown to accelerateand open up the query process [FPDs12]. Consequently, we visualize each path and all its attributes, as soon as it becomes available,even if the search process is still ongoing.We retrieve new paths until we reach a fixed threshold of k paths.Once we have passed this number, we continue to fetch all pathsthat are of equal length l to the last path fetched. Using this approach, we can guarantee that we consider all paths of length l inthe subsequent analysis. However, in rare cases, the resulting number of paths can be very large. To avoid excessive computation, wealso define a maximum threshold on the number of paths, which issignificantly larger than k. The fields to the right of the query interface (see Figure 1 top) give an overview of how many paths ofwhich length are in the current result set.We also support queries between sets of start and end nodes,c 2016 The Author(s)Computer Graphics Forum c 2016 The Eurographics Association and John Wiley & Sons Ltd.Node AttributesFigure 4: A path from the coauthor network connecting JeanDaniel Fekete and Ben Shneiderman. The coauthored papers aretreated as sets and visualized below the path. The CHI papers areaggregated—only the strength of the connection can be estimated.We see that Catherine Plaisant is highly connected with Ben Shneiderman. The TVCG papers show details: We can see who has coauthored which papers. Below the sets, numerical attributes, such asthe number of publications in each venue, are shown for each node.
C. Partl et al. / Pathfinder: Visual Analysis of Paths in GraphsReference PathRank-ColumnsFigure 5: Path comparison and ranking. The second path (violet) is the reference path. Icons next to the nodes and sets in all paths indicatewhether they are shared with the reference path. For example, the third path shares two CHI papers, one TVCG paper, and four authors. Therank columns show different scores by which the paths are ranked. Their order indicates score priority: First, paths are ranked by whetherthey contain Krzysztof Z. Gajos, second, by length, and third, by the average node degree.relationships, such as common publications of authors in a coauthornetwork, is easy. To save space, the sets can be aggregated by type.These aggregated relationships are scaled according to the numberof represented sets: Thicker lines and larger circles represent moresets. Figure 4, for example, shows that Enrico Bertini coauthoredonly a few CHI publications (blue) with Catherine Plaisant, butshe coauthored many papers with Ben Shneiderman. By default,we show only sets that connect nodes; however, all available setscan be shown on demand.When visualizing attributes, we can show either bar charts (Figure 4) or box plots (Figure 8), but other representations, dependingon the data type, the number, and the structure of the associateddata, are equally conceivable. Attributes can be aggregated hierarchically. The box plots in Figure 8, for example, summarize hundreds of mRNA and copy number data values.By default, we assign colors to set types and attribute types, inorder to facilitate identification across different views. However,coloring can be disabled on demand.Taken together, the visual encodings that are made possible bythe linear representation allow us to efficiently visualize groupstructures and attributes in graphs, which
we can address the scalability problem of multivariate graph visualization, equipping analysts with a powerful tool to explore large graphs. We introduce Pathfinder, a technique that provides visual methods to query paths, while considering various constraints. The resulting set of paths is visualized in both a ranked list and as a node-link .