Transcription
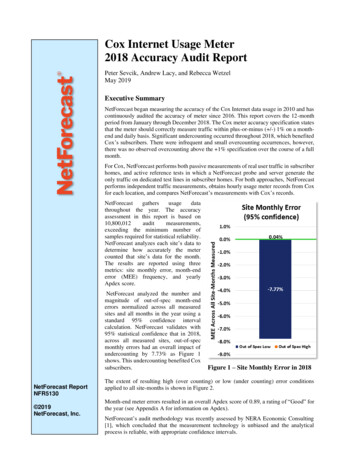
Cox Internet Usage Meter2018 Accuracy Audit ReportPeter Sevcik, Andrew Lacy, and Rebecca WetzelMay 2019Executive SummaryNetForecast began measuring the accuracy of the Cox Internet data usage in 2010 and hascontinuously audited the accuracy of meter since 2016. This report covers the 12-monthperiod from January through December 2018. The Cox meter accuracy specification statesthat the meter should correctly measure traffic within plus-or-minus ( /-) 1% on a monthend and daily basis. Significant undercounting occurred throughout 2018, which benefitedCox’s subscribers. There were infrequent and small overcounting occurrences, however,there was no observed overcounting above the 1% specification over the course of a fullmonth.For Cox, NetForecast performs both passive measurements of real user traffic in subscriberhomes, and active reference tests in which a NetForecast probe and server generate theonly traffic on dedicated test lines in subscriber homes. For both approaches, NetForecastperforms independent traffic measurements, obtains hourly usage meter records from Coxfor each location, and compares NetForecast’s measurements with Cox’s records.NetForecastgathersusagedatathroughout the year. The accuracyassessment in this report is based on10,800,012auditmeasurements,exceeding the minimum number ofsamples required for statistical reliability.NetForecast analyzes each site’s data todetermine how accurately the metercounted that site’s data for the month.The results are reported using threemetrics: site monthly error, month-enderror (MEE) frequency, and yearlyApdex score.NetForecast analyzed the number andmagnitude of out-of-spec month-enderrors normalized across all measuredsites and all months in the year using astandard 95% confidence intervalcalculation. NetForecast validates with95% statistical confidence that in 2018,across all measured sites, out-of-specmonthly errors had an overall impact ofundercounting by 7.73% as Figure 1shows. This undercounting benefited Coxsubscribers.NetForecast ReportNFR5130 2019NetForecast, Inc.Figure 1 – Site Monthly Error in 2018The extent of resulting high (over counting) or low (under counting) error conditionsapplied to all site-months is shown in Figure 2.Month-end meter errors resulted in an overall Apdex score of 0.89, a rating of “Good” forthe year (see Appendix A for information on Apdex).NetForecast’s audit methodology was recently assessed by NERA Economic Consulting[1], which concluded that the measurement technology is unbiased and the analyticalprocess is reliable, with appropriate confidence intervals.
NetForecast Meter Accuracy AssessmentHow often and by how much was the meter out-of-spec at month end?NetForecast determined the frequency and magnitude of month-end errors normalizedacross all sites and all months using a standard 95% confidence interval calculation. Themagnitude of over/under-counting is reflected in the monthly error calculations, whichquantify how much the meter would be affected (with 95% confidence) when a site overor under reported. Only out-of-spec site months (those with values greater than 1.0% andless than -1.0%) are used in this metric.During 2018, the Cox meter met the accuracy goal at month end 65% of the time as Figure2 shows. Given the margin of error, the sample size, and the standard deviation, the Coxmeter could be expected to over count 0.2% of the time and under count 34.8% of the timein 2018.Figure 2 – Cox Meter Month-end Error Frequency Distribution in 2018As Figure 1 shows, when a site under counted, the expected underreporting amount was-7.77%, and when a site over counted, the expected overreporting amount was 0.04%.Under counting is most often caused by missed or lost traffic counts. Processing errors orresource limitations in the meter system sometimes result in counts not accumulating inthe meter. Over counting is rare compared to under counting and is generally caused byretransmissions due to packet loss.How well did the meter perform on an annual basis?NetForecast applied the Apdex methodology (see Appendix A) to month-end error resultsto determine the meter’s overall monthly accuracy score and associated accuracy rating,also known as the yearly Apdex score. Think of this process as calculating the numericscore on a test that results in a letter grade. For example, an 88% score on a test results ina grade (rating) of “B.” A high score indicates that more site months were within the 2019, NetForecast, Inc.Report 5129Page 2
specification goal of /-1%. Site month errors above 1% negatively impact the scoresmuch more than errors below -1%.NetForecast measured and documented the month-end error of Cox’s data usage metersystem for every measurement site in every month in 2018. Figure 3 shows the Apdexscore history for all years the Cox meter has been continuously measured with the currentNetForecast methodology. Figure 8 shows the Apdex score history. Values belowExcellent are overwhelmingly due to undercounting (i.e., count errors under -1%).Although exhibiting a downward trend in 2018, the month-end errors resulted in a yearlyApdex score of 0.89, a rating of Good for the year.Figure 3 – 2016 through 2018 Yearly Apdex ScoresMeter Accuracy FactorsCox worked with NetForecast to create a Cox-specific Internet Data Usage Meter AccuracySpecification that defines goals which NetForecast assessed. The following tablesummarizes the goals for the accuracy specification factors, and Cox’s performancerelative to those goals. A comprehensive description of data usage meter specificationfactors is available in NetForecast’s report, General ISP Data Usage Meter Specificationand Best Practices [2]. 2019, NetForecast, Inc.Report 5129Page 3
MeterFactorCox GoalGoalMetNetForecast AssessmentMeter Accuracy FactorsWhat IsCountedCount all subscriber-generated IPtraffic across the subscriber’sInternet access line, including IPprotocol management traffic andEthernet framing.NetForecast validates that themeter counts as specified.YesMeterRecordUpdateRateAggregate, mediate, and store dataas a formal meter record on anhourly basis.NetForecast validates that themeter records are processedand stored on an hourly basis.YesAccuracyMeasure accuracy on a cumulativeTimedaily and month-end basis.PeriodErrorBoundsNetForecast measured accuracyon a cumulative daily andYesmonth-end basis.Meet an accuracy goal of /-1% on a NetForecast validates that thecumulative daily and month-endmeter met the 1% but not thebasis.-1% accuracy goal. 1%Yes-1%NoThe Cox Usage MeterThe Cox Internet data usage meter provides subscribers with information about how muchtraffic has crossed their residential Internet connection. The meter sums traffic to and fromthe Internet and displays a data consumption summary for the current billing period asshown here.Figure 4 – Summary Usage ViewCox’s Internet usage reports are accessible via the Cox customer portal athttp://www.cox.com/. If you are a subscriber, you can view your Internet usage informationby logging in at the sign-in prompt at the top right of the portal menu bar. This opens the“My Account” window. The data usage meter link is in a box labeled “My Internet”. Clickon “View More” within the My Internet box to reveal the data usage meter icon.Scrolling down the usage meter page shows usage over time, with selections for monthly,current daily, and past daily views shown below. All counts are rounded to the nearest GB. 2019, NetForecast, Inc.Report 5129Page 4
Figure 5 – Cumulative Monthly Usage ViewFigure 6 – Current Daily Usage ViewFigure 7 – Past Daily Usage ViewHow the Cox Data Usage Meter WorksCox subscribers connect to the Internet through a cable modem at the subscriber’s location,and from there data traffic travels over a local coaxial and Hybrid Fiber-Coaxial (HFC)cable system to a Cable Modem Termination System (CMTS). The traffic continues fromthere through the Cox network and into the Internet.The CMTS counts downstream and upstream traffic for each subscriber cable modem itserves. Downstream traffic flows from the Internet to the subscriber, and upstream trafficflows from the subscriber to the Internet. The measurement sites were supported by CiscouBR10000 series CMTSs. Each CMTS periodically reports the down and upstream countsin an Internet Protocol Detail Record (IPDR) as shown in Figure 8. 2019, NetForecast, Inc.Report 5129Page 5
Figure 8 - How the Meter Data Is ProcessedFrom the CMTS, IPDRs are sent to the IPDR collector, which collects, processes, andstores IPDR data streamed from CMTSs. IPDR processing involves time normalizationand usage data mediation, and the IPDR Collector cross checks the completeness andcorrectness of IPDR data to detect anomalies that can result in inaccurate Internet usagedata.The IPDR aggregator then gathers data from multiple collectors and converts incrementaltraffic counts into traffic data in a process referred to as ETL (extract, transform, and load).The IPDR aggregator extracts data from the CMTSs, transforms it to fit operational needs,and loads it into the Cox EBI (enterprise business intelligence) warehouse. Within the EBIwarehouse, traffic data is associated with subscriber accounts, and the meter value iscalculated for each day to create a meter record. From here the data is fed to the Cox datausage meter within the subscriber portal, which displays household data usage as shownabove.The requirements for how a cable modem communicates with the CMTS and for howsubscriber traffic is transported are defined in the Data over Cable Service InterfaceSpecification (DOCSIS) developed by CableLabs. The IPDR specification is managed bythe TeleManagement Forum (TM Forum). A DOCSIS Management Information Base(MIB) defines how traffic is stated in the IPDRWhat the Meter ShowsThere are a numbers steps between the time a subscriber’s packet moves through the cablemodem and the counts appear on the Cox subscriber portal. CMTS traffic counts aregenerally reported every 15 minutes. The IPDR processing system aggregates the countsand summarizes them by hour. The usage management platform database receives theupdates and prepares the results to be shown on an hourly basis. The meter on the portalgenerally updates within three hours after traffic passes over the network. 2019, NetForecast, Inc.Report 5129Page 6
NetForecast Meter User Experience AssessmentGoals were also set for the user’s experience of the data usage meter as displayed on theCox subscriber portal. The following table summarizes the goals for the user experiencespecification factors, and Cox’s performance relative to those goals.Meter FactorCox GoalNetForecast AssessmentGoalMetUser Experience FactorsTimelinessUsage occurring in an hour willupdate onto the web portal bynoon the following day.The meter updates by 7AM90% of the time, and alwaysby noon.YesGranularityUsage shown in whole GB(single number).The usage meter displayswhole GB values.YesMathematicalConsistencyThe manually tabulated sumof the daily usage values maydiffer from the monthly valuePortal details add up toshown on the portal becausesummary usage value within /Yesthe daily data is rounded2% of the total value.multiple times. The differenceis, however, within /-2% ofthe total value.AccessibilityUsage meter is no more thantwo clicks after logging intoportal.AvailabilityThis was not assessed;Usage meter is available 99% ofhowever, the portal wasthe time.available when accessed.ClarityComprehensive FAQ pages. 2019, NetForecast, Inc.Report 5129The usage meter is one clickfrom portal login.The FAQ pages containlimited, but notcomprehensive informationabout the meter.YesYesNoPage 7
For a 30-day period, NetForecast recorded the hour during which the portal updated. AsFigure 9 shows, 90 percent of the time the Cox meter values updated by 7AM the followingday, and the meter always updated before noon, thus exceeding the timeliness goal.Timeliness: Update Arrival Hours60%50%40%30%20%10%0%123456789Hour By Which Portal Updated (AM EST)Figure 9 – Meter Update PerformanceNetForecast Internet Usage Meter Accuracy ValidationMethodologyAll measurements were performed using the NetForecast UMapSM service deliveryplatform. The UMap system is enabled by measurement and reporting software embeddedinto customized, fully-featured, wireless home routers supplied and supported byNetForecast. The UMap system operating on the Cox network performs two types ofmeasurements, active and passive, as shown in Figure 10. 2019, NetForecast, Inc.Report 5129Page 8
Figure 10 – The NetForecast MethodologyActive Reference TestingThis description applies to the red dashed line of data flow in Figure 10. For the activereference test locations, NetForecast installs a probe running NetForecast software thatgenerates traffic following defined usage profiles under a variety of conditions.Passive Traffic MeasurementsThis description applies to the green dashed line of data flow in Figure 10. For the passivelocations, the UMap system continuously measures real-user traffic traversing the homeInternet connections of many actual subscribers. Passive measurements are made underreal-world conditions—i.e., passive measurement relies exclusively on the subscriber’shome traffic.Calculating Meter ErrorUMap data is adjusted to ensure that UMap measurements count the same protocoloverhead as the CMTS counts. NetForecast then aligns the hourly usage records from theUMap system with the hourly records from the Cox meter system so the same hours arecompared. Daily sums are generated for each site. NetForecast applies the followingformula to the UMap and Cox usage meter daily traffic measurement records:𝑬𝒓𝒓𝒐𝒓 (𝑪𝒐𝒙 𝑹𝒆𝒄𝒐𝒓𝒅 𝑼𝑴𝒂𝒑 𝑹𝒆𝒄𝒐𝒓𝒅)𝑼𝑴𝒂𝒑 𝑹𝒆𝒄𝒐𝒓𝒅If the error result is positive, the meter is overcounting. If the error is zero, the meter is asaccurate as it can be, and if the error result is negative, the meter is undercounting. Resultsare shown as a percentage. Each site-day error result is an error sample. Daily error samplesare aggregated into cumulative daily error values for each day of the month. The lastcumultive dialy error value is the month-end error (MEE). 2019, NetForecast, Inc.Report 5129Page 9
ConclusionsCox established an accuracy goal for its Internet data usage meter to correctly measuretraffic passing through a subscriber’s cable modem within /-1% over each month. Basedon 10,800,012 audit measurements gathered at end-user premises throughout 2018,NetForecast validates with 95% statistical confidence that the typical site was undercounted by -7.73%.References1.2.Jonathan Falk, NERA, Assessment of NetForecast, Inc. Methodology March 2018.Sevcik, Wetzel, and Lacy, General ISP Data Usage Meter Specification and BestPractices NetForecast Report 5119, May 2015.About the AuthorsPeter Sevcik is the founder and CTO of NetForecast and is a leading authority onInternet traffic and performance. Peter has contributed to the design of more than 100networks, including the Internet, and is the co-inventor of three patents on applicationresponse-time prediction and congestion management. He pioneered Internet usagetracking techniques and invented the Apdex methodology. He can be reached atpeter@netforecast.com.Andrew Lacy is NetForecast’s Director of Analytics and has a 30-year track recorddelivering solutions to complex business and technical requirements. He has extensiveexperience architecting, building, and analyzing data for Enterprise Database systems.He is also a development leader designing, building, and deploying many differentproducts. He has a strong technical background in data communications, gamesoftware, server-based gaming, embedded systems, server software, web, and databasedesign.Rebecca Wetzel is a director at NetForecast and a data communications industryveteran. She helped realize the commercialization of the Internet in its formative yearsand worked to design and market some of the Internet’s first value-added services. Shehas spent over two decades as an Internet industry analyst, consultant, writer, andadvisor to numerous startups.Additional information isavailable at:www.netforecast.comNetForecast and the NetForecastlogo are registered trademarks ofNetForecast, Inc. 2019, NetForecast, Inc.Report 5129Page 10
APPENDIX A – Yearly ApdexAnalyzing and reporting on the error of a system is complex. One could take a simpleapproach of averaging the error of all samples. If the system has a significant bias, thesimple average would show that bias (e.g., most samples are 10% low). However, if asystem is fundamentally accurate, the mean (average) or median will be essentially zero.But that result tells us that half of the samples are higher and half are lower. Many samplesmay be far from the median; therefore, usage meter accuracy assessment should not useaverages.Although under most circumstances subscribers receive accurate meter information, it isnot uncommon for a meter system occasionally to provde inaccurate meter informationaffecting only a few subscribers. These infrequent events are typically called the “long tailof a statistical distribution.” This may seem unimportant, but if the long tail encompassesa large portion of the sample size, the meter cannot be considered accurate.To provide clear insight, NetForecast applies the Application Performance Index(Apdex)—an open standard that defines a method for reporting the meaning of manymeasurement samples from the user’s perspective. Apdex provides a uniform way toanalyze and report on the degree to which measured accuracy meets a specific goal.The methodology is promoted by vendors,enterprises, and professionals who aremembers of the Apdex Alliance. The Allianceuses the rating scale to communicate . See www.apdex.org to learnmore.Apdex converts many values into a simplemeaningful number that properly reflects theuser’s perspective of performance relative to aperformance target. Assuming a /-1%specification month-end error, samples are placed into the following categories eachmonth:In Spec/Compliant: Number of samples within the /-1% meter specification. Thesesamples clearly meet the goal.Minor Under Reporting: Number of samples below -1% but greater than -5%(undercounting). Undercounting is outside the specification; however, somemodest undercounting can be tolerated since the subscriber is not harmed bysome traffic not being counted.Major Under Reporting: Number of samples below -5% (undercounting). Majorundercounting is outside the specification and because it is so far from theactual traffic, even though it benefits the subscriber, it neverthelessundermines the confidence in the accuracy of the meter system.Over Reporting/Incorrect: Number of samples above 1% (overcounting). Anyovercounting above the 1% specification is a serious problem that users willnot tolerate.The Apdex methodology converts many measurements into one number on auniform scale of 0 to 1 (0 completely inaccurate; 1 perfect accuracy). The resultingApdex score is a numerical measure of accuracy. The Apdex formula is the number of inspec results, plus ¾ of the minor under reporting results, plus ½ of the major underreporting results, plus none of the incorrect results, divided by the total number ofsamples.In Spec (MinorLow* 0.75) 2019,NetForecast,Inc. Out of SpecReport5129Apdex[S] (Major Out of SpecLow * 0.5)Page 11Total SamplesNote: Incorrect samples have zero value
NetForecast began measuring the accuracy of the Cox Internet data usage in 2010 and has continuously audited the accuracy of meter since 2016. This report covers the 12-month period from January through December 2018. The Cox meter accuracy specification states that the meter should correctly measure traffic within plus-or-minus ( /-) 1% on a .

