Transcription
SESUG Paper 286-2018Graph Visualization for PROC OPTGRAPHAndrew M. Henshaw, Georgia Tech Research Institute / Kennesaw State University;Lauren Staples, Kennesaw State University;Joe DeMaio, Kennesaw State UniversityABSTRACTPROC OPTGRAPH is an extensive set of tools for graph and network analysis, but the lack of avisualization capability is limiting. We have developed a simple, yet powerful, online visualization that canbe directly accessed using the SAS macro language. Our tool creates and renders various graph layoutsusing a tightly linked external website and the Graphviz programming toolkit.Written in Python, the external web service is easily integrated into an existing capability. A macrowrapper around PROC HTTP pushes the output of the PROC OPTGRAPH procedure to the visualizationweb service. Node and edge-specific attributes (such as edge weight or node color) may be directlymanipulated using added table columns. Whenever new data is pushed, the graph layout and thevisualization are both updated automatically.INTRODUCTIONHeavily used at Kennesaw State University for a graduate-level class in graph theory, PROC OPTGRAPH[SAS2018] provides a number of algorithms for solving many of the problems and topics covered in theclass. Unfortunately, visualization of these solutions is limited to the simple tabular output of the function.To provide students with immediate graphical feedback of the results, an external web service has beendeveloped. Using a SAS macro, the output nodes and links tables are posted to the service and a webclient is automatically updated with a properly formatted graph description language program thatrepresents the structure of this output. The web client then displays both the source code for the programand a visual representation of the graph.POSTING THE PROC OPTGRAPH OUTPUTTwo macro commands (SAS2GRAPH and SAS2DIGRAPH) provide the interface to the web service. Themacro code is listed below:%macro sas2base(key, nodes, links, f, t, keep, mode) /STORE SOURCE;option NONOTES;filename resp TEMP;filename headout TEMP;filename input TEMP;data combined;set &nodes &links (rename (&f from &t to));keep node from to &keep;run;proc export data combinedoutfile inputdbms csvreplace;run;proc http1
url "http:// SASGRAPHSITE/fromsas&mode/&key"in inputout respheaderout headout;run;%put PROC HTTP Response;data null ;infile resp;input;put infile ;run;option NOTES;%mend sas2base;%macro SAS2GRAPH(key, nodes, links, from from, to to, keep ) /STORE SOURCE;%sas2base(&key, &nodes, &links, &from, &to, &keep, )%mend sas2graph;%macro SAS2DIGRAPH(key, nodes, links, from from, to to, keep ) /STORESOURCE;%sas2base(&key, &nodes, &links, &from, &to, &keep, di)%mend sas2digraph;MACRO CODE EXPLANATIONThe required parameters for the macro calls sas2graph and sas2digraph are:1. Key: used as the final node of the path web URL, the key acts as a session identifier linking the SASoutput to a specific web page. In the example, the session key is “k5”.2. Nodes: a table listing node names and, optionally, node attributes.3. Links: a table specifying the links (or edges) between nodes. By default, column names from and todesignate the edge connections. Edge attributes may also be specified with additional columns.The optional parameters for the macro calls are:1. From, To: alternative column names for the for and to columns may be specified with theseparameter.2. Keep: optional columns to pass to the web service. These columns will be attached to nodes oredges as attributes to be used in the rendering of the graph (e.g., fillcolor).Operation of the macros is straightforward. Both macros call sas2base to perform the bulk of theprocessing with parameters that mirror the sas2graph or sas2digraph parameter set. The only additionalparameter is mode, which carries the digraph flag. The mode and key parameters are used in theformation of the HTTP post URL.The node and link tables are merged, and the from and to proxy columns are renamed if required. Inaddition to the columns specified in the keep parameter, the node, links, from, and to columns are keptwhile all other columns are dropped.Next, the combined and processed table is exported in CSV format to a temporary file. Finally, the CSVfile is posted to the web service addressed using the base URL extended by the key and modeparameters.SIMPLE EXAMPLEAs an example, the following code renders a K5 network, as shown in Figure 1:2
data K5;input from to ;datalines;A BA CA DA EB CB DB EC DC ED E;proc optgraphdata links K5out nodes nodesout links links;summary concompout summary;run;%sas2graph(k5, nodes, links);Figure 1. K5 Network Rendered for Visualization3
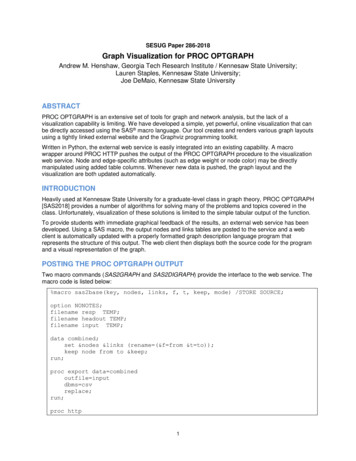
A MATCHING NETWORKAn example of a matching network solution is shown in the in Figure 2. In this example of a digraphnetwork, instructors are assigned to courses based on affinity. PROC OPTGRAPH solves this type ofproblem using the Linear Assignment statement. As shown in the figure, attribute columns control thecolor of the edges (chosen matches highlighted in red) and the node shapes (diamond-shape forunmatched nodes).GwenSTAT 8330HarrySTAT 1107AliceCS 1301BenCat herineMATH 2332DavidSTAT 3010Et hylSTAT 3020FrankMATH 8020Figure 2. Rendered Matching Network with AttributesCode for this example is given below:%let ds math8020.faculty;proc sql;select teacher, course, weight from &ds;quit;data fixed weights;set math8020.faculty;weight -weight;run;proc optgraphgraph direction directeddata links fixed weightsout nodes nodesout links links;data links varfrom teacherto course;linear assignmentout course assignment;run;data links;set links;penwidth (-weight)/100;weight -weight;run;proc sql;CREATE TABLE links AS (SELECT links.teacher, links.course,coalesce(highlight, "#00000020") as color, penwidth, weightFROM linksLEFT JOIN (4
SELECT ca.teacher, ca.course, "red" as highlightFROM course assignment as ca)ON links.teacher ca.teacher and links.course ca.course);quit;proc sql;CREATE TABLE nodes AS (SELECT node,CASEWHEN node IN (SELECT''WHEN node IN (SELECTELSE 'diamond'END AS shape,CASEWHEN node IN (SELECTWHEN node IN (SELECTELSE 2END AS penwidthFROM nodes);quit;teacher FROM course assignment) THENcourse FROM course assignment) THEN ''teacher FROM course assignment) THEN .course FROM course assignment) THEN .%sas2digraph(faculty, nodes, links, from Teacher, to Course,keep color penwidth weight shape);KNIGHT’S TOURThe Knight’s Tour problem is an instance of the Hamiltonian path problem, which PROC OPTGRAPH cansolve using the TSP (Traveling Salesman Problem) statement. The following SAS code specifies all of thevalid moves for a knight on an 8 8 chessboard and then computes a complete path where each square isvisited once and only once:data knights 8 8;input from to @@;datalines;A1 B3 A1 C2 A2 B4 A2 C1 A2A3 C4 A4 B2 A4 B6 A4 C3 A4A5 C6 A6 B4 A6 B8 A6 C5 A6A8 B6 A8 C7 B1 C3 B1 D2 B2B3 C5 B3 D2 B3 D4 B4 C2 B4B5 C7 B5 D4 B5 D6 B6 C4 B6B7 D6 B7 D8 B8 C6 B8 D7 C1C2 E3 C3 D1 C3 D5 C3 E2 C3C4 E5 C5 D3 C5 D7 C5 E4 C5C6 E7 C7 D5 C7 E6 C7 E8 C8D2 E4 D2 F1 D2 F3 D3 E1 D3D4 E6 D4 F3 D4 F5 D5 E3 D5D6 E8 D6 F5 D6 F7 D7 E5 D7E1 F3 E1 G2 E2 F4 E2 G1 E2E3 G4 E4 F2 E4 F6 E4 G3 E4E5 G6 E6 F4 E6 F8 E6 G5 E6E8 F6 E8 G7 F1 G3 F1 H2 F2F3 G5 F3 H2 F3 H4 F4 G2 8G1G3
F5 G7 F5 H4 F5 H6 F6 G4 F6 G8 F6 H5 F6 H7 F7 G5F7 H6 F7 H8 F8 G6 F8 H7 G1 H3 G2 H4 G3 H1 G3 H5G4 H2 G4 H6 G5 H3 G5 H7 G6 H4 G6 H8 G7 H5 G8 H6;proc optgraphdata links knights 8 8out nodes nodesout links links;tspmaxsols 1out knights tour;run;data nodes;set nodes;pos CATS(RANK(SUBSTR(node,1,1))-RANK("@"), ",", SUBSTR(node,2,1),"!");shape "square";run;proc sql;CREATE TABLE links AS(SELECT links.from, links.to, color, penwidthFROM linksLEFT JOIN(SELECT kt.from, kt.to, "red" as color, 3 as penwidthFROM knights tour as kt)ON links.from kt.from AND links.to kt.to);quit;%sas2graph(knights tour, nodes, links, keep pos shape color penwidth);The rendered graph is shown in Figure 3. The thin black lines represent the possible knight moves fromeach square, while the thick red lines show one valid solution. Note that the position of each of the nodesis passed as a column in the nodes table.6
C2D2E2F2G2H2A1B1C1D1E1F1G1H1Figure 3. Knight’s Tour SolutionWEB SERVICEThe web service is written in Python using the Bottle web application framework [Hellkamp2018]. Anyrelational database with Python drivers may be used as the data store. Our implementation uses MySQL.When SAS data in CSV format is posted, the session key and the mode are extracted from the providedURL. The CSV file contained in the request payload is parsed and immediately converted into a programusing the DOT graph-description language, which is understood by a number of tools, including theGraphViz toolkit used in this project’s client application.As provided by the SAS tools, node names may be too free form to be used directly in the DOT code. If anode name can be used as a valid DOT identifier it is; otherwise, the name is replaced with a safeidentifier and the original node name is used as a node label.The DOT code is stored in the database indexed by the session key. A timestamp is also recorded. Theclient application may request either just the current timestamp or the DOT code plus the timestamp. Ifthe timestamp does not match the value that the client is currently holding, then it will know that it needsto request the latest code or that its display needs updating.CLIENT WINDOWThe client window is rendered using a mix of HTML and JavaScript. Two open-source components formthe left and right halves of the display. The source code display (on the left) uses the Ace embeddablecode editor [Ajax.org2018], which provides the capability to both view the DOT source code and to make7
modifications. The graphical display (on the right) is provided by a JavaScript library called Viz.js[Daines2018]. This library is based on the GraphViz toolkit C code that has been transcompiled intoJavaScript.If the Auto option is checked, the client polls the backend web service twice a second for updated DOTcode, which is then pushed into the Ace code editor. Any change to this window, either by the user or byautomatic update from the web service, triggers an event that initiates a new translation and display of theDOT code.Various layout engines are included and accessible through a dropdown menu. The default engine (circo)uses a circular arrangement of nodes, while fdp and neato use a spring-force layout model. The dotengine is commonly used for digraphs.Various presentation formats are available, with scalable-vector graphics (SVG) the generally preferredoption for high-resolution displays. The bitmap format uses Portable Network Graphics (PNG).CONCLUSIONIn providing a simple, fast, and versatile visualization option for PROC OPTGRAPH, this project hasproved beneficial and useful to students in KSU’s graph-theory classes. Use of existing open-source,JavaScript libraries simplified the development of the client application. The web service backendapproach was relatively simple to implement and could be used for similar applications needingcustomized interaction with SAS-based tools and facilities.REFERENCESAjax.org. “ACE, Embeddable Code Editor for the Web.” August 2018. Available at https://ace.c9.io/.Daines, Mike. “Viz.js: Graphviz on the Web.” August 2018. Available at https://github.com/mdaines/viz.js/.Hellkamp, Marcel. “Bottle: Python Web Framework.” August 2018. Available at https://bottlepy.org.SAS , “SAS OPTGRAPH Procedure.” August 2018. Available at T INFORMATIONYour comments and questions are valued and encouraged. Contact the authors at:Andrew HenshawGeorgia Tech Research Institute / Kennesaw State duLauren StaplesKennesaw State Universitylstaple6@students.kennesaw.eduJoe DeMaioKennesaw State Universityjdemaio@kennesaw.edu8
Our tool creates and renders various graph layouts using a tightly linked external website and the Graphviz programming toolkit. Written in Python, the external web service is easily integrated into an existing capability. A macro wrapper around PROC HTTP pushes the output of the PROC OPTGRAPH procedure to the visualization web service.