Transcription
Open Accesset al.Dennis2003Volume4, Issue 9, Article R60SoftwareGlynn Dennis Jr*, Brad T Sherman*, Douglas A Hosack*, Jun Yang*,Wei Gao*, H Clifford Lane† and Richard A Lempicki*Correspondence: Richard A Lempicki. E-mail: rlempicki@niaid.nih.govPublished: 14 August 2003reviewsAddresses: *Science Applications International Corporation - Frederick, Clinical Services Program, Laboratory of Immunopathogenesis andBioinformatics, National Cancer Institute at Frederick, MD 21702, USA. †Laboratory of Immunoregulation, National Institute of Allergy andInfectious Diseases, National Institutes of Health, Bethesda, MD 20892, USA.commentDAVID: Database for Annotation, Visualization, and IntegratedDiscoveryReceived: 4 April 2003Revised: 6 June 2003Accepted: 4 July 2003Genome Biology 2003, 4:R60A previous version of this manuscript was made available before peerreview at http://genomebiology.com/2003/4/5/P3 2003 Dennis et al.; licensee BioMed Central Ltd. This is an Open Access article: verbatim copying and redistribution of this article are permitted in allmedia for any purpose, provided this notice is preserved along with the article's original ummarizedin icthoseto ofRationaleGenome Biology 2003, 4:R60informationA number of public efforts are currently focusing on the annotation and curation of gene-specific functional data, includingLocusLink, Protein Information Resource (PIR), GeneCards,Proteome, Kyoto Encyclopedia of Genes and Genomes(KEGG), Ensembl, and Swiss-Prot to name but a few [2-8].These resources provide exceptional depth and coverage of thefunctional data available for a given gene, but are not designedto effectively explore the biological knowledge associated withhundreds or thousands of genes in parallel. In order to facilitate the functional annotation and analysis of large lists ofgenes we have developed a Database for Annotation, Visualization, and Integrated Discovery (DAVID), which provides aset of data-mining tools that systematically combine functionally descriptive data with intuitive graphical displays [9].DAVID provides exploratory visualization tools that promotediscovery through functional classification, biochemical pathway maps, and conserved protein domain architectures, whilesimultaneously remaining linked to rich sources of biologicalannotation. DAVID expedites the functional annotation andanalysis of any list of genes encoded by human, mouse, rat, orfly genomes. DAVID's functionality is demonstrated using theAffymetrix GeneChip data of Cicala et al. [10].interactionsThe post-genomic era has introduced high-throughput methodologies that generate experimental data at rates that exceedknowledge growth. In particular, high-density biochipsincluding complementary deoxyribonucleic acid (cDNA)microarrays, oligonucleotide microarrays, and rapidly evolving proteomics platforms represent modern tools able tointerrogate biology on a genome-wide scale and generate tensof thousands of data points simultaneously [1]. Whileresearchers are beginning to appreciate the statistical rigorsrequired for the analysis of genome-scale datasets, a rate-limiting step in knowledge growth occurs at the transition fromstatistical significance to biological discovery.refereed researchThe distributed nature of biological knowledge poses a major challenge to the interpretation ofgenome-scale datasets, including those derived from microarray and proteomic studies. This reportdescribes DAVID, a web-accessible program that integrates functional genomic annotations withintuitive graphical summaries. Lists of gene or protein identifiers are rapidly annotated andsummarized according to shared categorical data for Gene Ontology, protein domain, andbiochemical pathway membership. DAVID assists in the interpretation of genome-scale datasets byfacilitating the transition from data collection to biological meaning.deposited researchAbstractreportsThe electronic version of this article is the complete one and can befound online at http://genomebiology.com/2003/4/9/R60
R60.2 Genome Biology 2003,Volume 4, Issue 9, Article R60Dennis et al.Table 1Sources of annotation data integrated into v/entrez/query.fcgi?db OMIM[30]Gene Ontologyhttp://www.geneontology.org/[31]University ge/pub/shared/JMR pub /analysis/index.affx[12]System architecture and maintenanceAn automated procedure written in Microsoft Visual Basic(VB) 6.0 updates DAVID weekly with the followingprocedures: call a series of Perl and Java applications thatdownload public data through anonymous file transfer protocols (FTP) (Table 1); unpack and parse desired annotationdata; create tab-delimited data files ready for databaseimport; and import data into an Oracle 8i relational databasemanagement system (RDBMS) using Oracle's SQL*Loaderapplication. Microsoft's IIE web server and Active ServerPage technology are used to access the database using JavaBeans and the structured query language (SQL). LocusLinknumbers for Affymetrix probe sets are derived from University of Michigan associations [11] or NetAffx [12]. Functionalannotations and database cross-references are derived fromLocusLink, which provides stable, human-curated representations of genes. For more detailed information regarding thedata sources used by DAVID please see the FAQ section at [9].Analysis modulesDAVID is composed of four main modules: Annotation Tool,GoCharts, KeggCharts, and DomainCharts. The AnnotationTool is an automated method for the functional annotation ofgene lists. Any combination of annotation data can be chosenfrom 10 options by selecting the appropriate checkboxes(Table 2). The annotations are added to the submitted genelist by selecting the upload button, which returns an HTMLtable containing the user's original list of identifiers appendedwith the chosen functional annotations. Unannotated genesare included in the output with no appended data for trackingpurposes.The GoCharts module graphically displays the distribution ofdifferentially expressed genes among functional ng the controlled vocabulary of the Gene Ontology Consortium (GO), which provides a structured language that can beapplied to the functions of genes and proteins in all organismseven as knowledge continues to accumulate and change [13].The language is structured in a directed acyclic graph (DAG),wherein term specificity increases and genome coveragedecreases as one moves down the hierarchy. In contrast witha true hierarchy, child terms in a DAG may have more thanone parent term and may have a different class of relationshipwith its different parents. The structure of GO starts withthree main categories, Biological Process, Molecular Function, and Cellular Component. Biological Process includesbroad biological goals, such as mitosis or purine metabolism,that are accomplished by ordered assemblies of molecularfunctions. Molecular Function describes the tasks performedby individual gene products; examples are transcription factor and DNA helicase. The Cellular Component classificationtype involves subcellular structures, locations, and macromolecular complexes; examples include nucleus, telomere, andorigin recognition complex. After choosing a classificationtype, levels that determine list coverage and specificity arechosen by selecting the appropriate radio button. Level 1 provides the highest list coverage with the least amount of termspecificity. With each increasing level coverage decreaseswhile specificity increases so that level 5 provides the leastamount of coverage with the highest term specificity.Classification data is displayed as a bar chart, where thelength of the bar represents the number of gene identifiers ineach category. The user can set visualization parameters forsorting output data and displaying categories that contain atleast a minimum number of genes. Selecting an individual baropens a new HTML table displaying the gene identifier,LocusLink number, gene name, the current classification,and other classifications for each gene in that category. A'Show All' button opens a new HTML table displaying all classification data and a 'Show Chart Data' button opens anHTML table containing the underlying chart data, thus allowing users to recreate customized chart graphics in a spreadsheet program. A new chart can be displayed for any subset ofgenes by selecting the classification type and level using thecheckboxes and radio buttons available within the user's current page that allow for drill-down capabilities. A count of thenumber of genes annotated is included in the output, andunannotated genes are binned into the 'unclassified' category,thus providing users with an automated tracking system forgenes not annotated.KeggCharts graphically display the distribution of differentially expressed genes among KEGG biochemical pathways.Each pathway is linked to the KEGG pathway map, whereindifferentially expressed genes from the original list are highlighted in red. In this view genes are further linked to additional annotations available through KEGG's DBGETretrieval system [6]. As with GoCharts, the user can set visualization parameters for sorting output data and displayingGenome Biology 2003, 4:R60
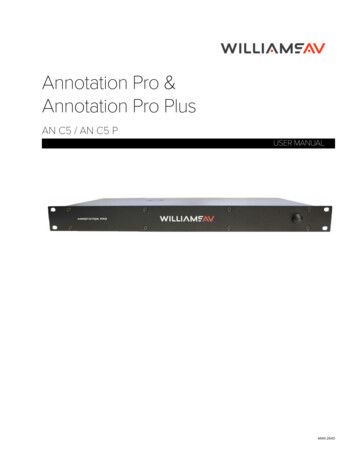
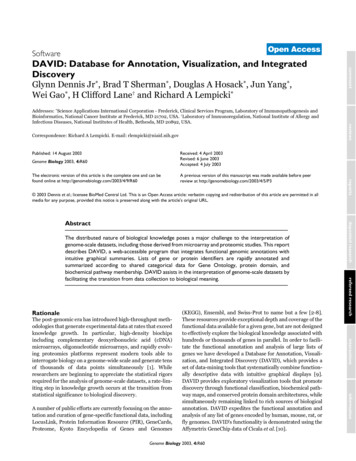
http://genomebiology.com/2003/4/9/R60Genome Biology 2003,Volume 4, Issue 9, Article R60Dennis et al. R60.3Table 2Options provided by the Annotation ToolDescriptionGenBankAccession number corresponding to the nucleotide sequenceUnigeneCluster containing sequences that represent a unique geneUnique and stable identifier for curated genetic lociRefSeqReference sequence standards for mRNAsGene symbolOfficial gene symbol included in the Locus Report provided by NCBIGene nameOfficial gene name included in the Locus Report provided by NCBIOMIMCatalog of human genes and genetic disordersAffymetrix descriptionProbe set description provided by AffymetrixSummaryFunctional summaries included in the Locus Report provided by NCBIGene ontologyControlled vocabulary applied to the functions of genes and proteins. Functional classifications used here arethose included in the Locus Report provided by NCBIGenome Biology 2003, 4:R60informationWhereas 16 genes modulated by HIV-1 gp120 have previouslybeen associated with HIV replication and/or envelopeThe Annotation Tool provides several annotation options andbuilds a tabular view of the users gene list and the availableannotations (Table 2). Choosing the annotation fields GeneSymbol, LocusLink, OMIM, Unigene, Reference Sequence,and Gene Name followed by selecting the 'Upload' buttonproduces an HTML table in the web browser containing allgenes and their available annotations, where gene identifiers,descriptive and classification data are pulled from thedatabase and appended to the gene list (Figure 1). Gene identifiers such as Gene Symbol and LocusLink are hyperlinked toadditional gene-specific data available at their originalsources, thus providing in-depth gene-specific details andannotation pedigrees. Classification data and functional summaries can be used to quickly scan for information relevant tothe researcher's experimental system. The server timerequired for execution of this module correlates linearly withthe size of the gene list and takes less than 45 seconds for listsof up to 1,000 genes (Figure 2, numbers in parenthesesinteractionsTo demonstrate the functionality of DAVID we analyzed a listof genes differentially expressed in human peripheral bloodmononuclear cells (PBMCs) after incubation with HIV-1envelope proteins. Details of the experimental, RNA preparation, and GeneChip hybridization procedures, along withdetails of the chip-to-chip normalizations and statistical analysis of differential gene expression are provided in Cicala etal. [10]. Briefly, primary human PBMCs and monocytederived macrophages were incubated for 16 hours with HIV1 envelope protein (gp120). High-density oligonucleotidemicroarrays (Affymetrix HU-95A GeneChip) were used tomonitor gp120-induced transcriptional events. This analysisresulted in the identification of 402 differentially expressedgenes.refereed researchAnnotation ToolUsing DAVID to mine functional annotationdeposited researchDomainCharts display the distribution of differentiallyexpressed genes among PFAM protein domains [14]. Eachdomain designation is linked to the Conserved DomainDatabase (CDD) of the National Center for BiotechnologyInformation (NCBI), where details regarding domain function, structure and sequence are readily available. As withGoCharts and KeggCharts, the user can set visualizationparameters for sorting output data and displaying categoriesthat contain at least a minimum number of genes and theDomainCharts visualization inherits all of the dynamic features of GoCharts and KeggCharts. For further informationregarding the functionality of DAVID visit the FAQ section at[9].signaling, the remaining genes are of unknown function orhave never been associated with HIV-1 or gp120. Convertingthis list of genes into biological meaning requires the gathering of pertinent information from several data repositories.For many researchers this process consists of iterative browsing through several databases for each gene, manually gathering gene-specific information regarding sequence, function,pathway, and disease association. In contrast, the systematicapproach of DAVID simultaneously adds biologically richinformation derived from several public data sources to listsof genes in parallel. Selecting DAVID's Annotation Tool anduploading the list of 402 differentially expressed genes initiates the functional annotation and analysis of the entire dataset. Once submitted, the gene list is stored for the entireanalysis session, allowing users to switch between moduleswithout having to resubmit data.reportscategories that contain at least a minimum number of genesand the KeggCharts visualization inherits all of the dynamicfeatures of GoCharts.reviewsLocusLinkcommentAnnotation
R60.4 Genome Biology 2003,Volume 4, Issue 9, Article R60Dennis et Other sources of annotationFigureof1 Annotation ToolOuputOuput of Annotation Tool. Shown are appended annotations for the first several Affymetrix probe sets in an HTML table containing all 402 entries.Categorical information about the experimental conditions were submitted along with the Affymetrix probe-set identifiers and included in the output inthe value column. Identifiers such as Symbol, LocusLink, OMIM, RefSeq, and Unigene accessions are hyper-linked to their origin sources for more detailedinformation. Text included in summary fields is derived from descriptive, functional information provided in NCBI's LocusLink reports.represent r2 values). These results demonstrate the power andefficiency of an integrated approach to the functional annotation of large datasets.GoChartsChoosing the GoCharts module opens a new window with avariety options. Users choose between three general types ofclassification (biological process, molecular function, and cellular component) and five levels of annotation that representterm coverage and specificity (see Analysis Modules section).Any combination of classification and coverage level can bespecified. Also included are options to annotate gene listswith all GO terms available or only the most specific terms,which are referred to as terminal nodes. The option to choosedifferent levels of term specificity provides needed flexibilityand thus allows researchers to determine dynamically whichlevel of coverage and specificity best suits their data and stageof analysis. For instance, early-stage analyses may consist ofannotating gene lists with very general terms in order to gaina broad understanding of the data. In this case, selecting biological process and level 1 classifies genes using general termssuch as 'death' and 'cell communication'. Using increasedterm specificity facilitates the extraction of more detailedfunctional information. In this case selecting biologicalprocess and level 5 classifies genes using terms such as 'apoptotic mitochondrial changes' and 'chemosensory perception'.However, increased term specificity comes a cost, in that as itincreases list coverage decreases (Figure 3). In our studies wefind that level 2 typically maintains good coverage while alsoproviding meaningful term specificity. Figure 4a illustrateshow the GoCharts visualization quickly reveals that 35 differentially expressed genes are involved in 'stress responses'.Each GO term can be viewed in the tree or DAG views byhyperlinks to QuickGO [15].Because HIV-1 has a major impact on the function of cells ofthe immune system and their ability to carry out stressresponses, we selected the histogram bar representing thenumber of genes involved in stress response, which opens anHTML table containing the Affymetrix identifier, LocusLinknumber, gene name, the current classification, and otherclassifications for all 35 genes (Figure 4b). Now that we havereduced our gene list to those genes involved in stressresponses, we further characterized this subset by repeatingthe GoCharts procedure available at the top of the stressresponse HTML table. Choosing molecular function, level 3produces a new histogram that quickly reveals that nearly halfGenome Biology 2003, 4:R60
http://genomebiology.com/2003/4/9/R60Genome Biology 2003,35DomainCharts30252015105250500750List size (identifiers)1,000Comparison of DAVID with related programs100Percent coverage706050403020100123GoChart level45Figure 3of gene-list coverage using GoChartsAnalysisAnalysis of gene-list coverage using GoCharts. A list of 402 Affymetrixprobe set identifiers were annotated with the Proteome assignedfunctional classifications provided by LocusLink. Percent coveragerepresents the number of genes out of 402 that were annotated at a termspecificity level within the Biological Process, Molecular Function, andCellular Component classification types. Percent coverage decreases asterm specificity increases.Genome Biology 2003, 4:R60informationFigure 5a depicts the output of KeggCharts with a histogramdisplaying the distribution of differentially expressed genesamong biochemical pathways. The chart shows that a KEGGpathway of apoptosis includes five genes induced by HIV-1gp120. Selecting the pathway name opens the correspondingKEGG biochemical pathway map and highlights in red outlinethe differentially expressed genes functioning in that pathway(Figure 5b). In this view genes are further linked to additionalannotations available through KEGG's DBGET retrieval system [6]. Note that only four genes in the KEGG apoptosispathway are highlighted in red, while the KeggCharts toolmapped five Affymetrix probe sets to the apoptosis pathway.80interactionsKeggChartsBiological ProcessMolecular FunctionCellular Component90refereed research(16/35) of the stress-response genes possess cytokine activity(Figure 4c). Indeed, cytokines have been shown to play animportant part in the HIV-1 life cycle and the results obtainedhere suggest that treatment of PBMCs with HIV-1 envelopeproteins significantly modulates the transcription of numerous cytokine genes. The efficiency with which GoCharts systematically summarized this large dataset with graphicvisualizations, while remaining linked to primary data andexternal resources drastically improved the discoveryprocess.deposited researchFigureTimeanalysis2of Annotation ToolTime analysis of Annotation Tool. Server time required (y axis) tosimultaneously append all 10 annotation options to gene lists ranging insize from 100 to 1,000 (x axis). The average of three trials for gene listscontaining Affymetrix, GenBank, LocusLink, and UniGene identifiers areshown and the numbers in parentheses represent r2 value of thecorrelation between gene-list size and the server time required forannotation.Several other programs have overlapping and related functionality when compared with DAVID, but none combines allof DAVID's features within a single platform. These programsinclude ENSMART [16], FatiGO [17], GeneLynx [18], GoMiner [19], MAPPFinder [20], MatchMiner [21], Resourcerer[22] and Source [23], which collectively fall into two generalcategories: exploratory tools, defined as combining functional annotation with some form of graphical representationreports100reviewsDomainCharts are operationally akin to both KeggCharts andGoCharts, except that the results visually depicting the distribution of genes among PFAM protein domains (Figure 6a).The DomainCharts histogram identifies 16 genes with kinasedomains (pkinase), probably reflecting the effects of HIV-1gp120 on the signal transduction machinery. The chart alsoidentifies six genes with interleukin-8 domains (IL-8), adomain that represents a highly conserved motif amongstress-response cytokines. Selecting the domain name 'IL8'opens the Conserved Domain Database (CDD) page corresponding to that PFAM domain (Figure 6b). This pageprovides detailed sequence, structure, and functional information about the IL-8 domain and the proteins that containit.commentAffymetrix (0.99)GenBank (0.98)LocusLink (0.99)UniGene (0.99)40Server time (seconds)Dennis et al. R60.5This difference is due to the fact that two of the Affymetrixprobesets are targeting the same 'TNF-alpha' gene.450Volume 4, Issue 9, Article R60
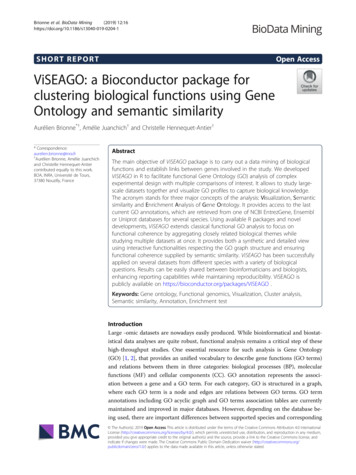
R60.6 Genome Biology 2003,Volume 4, Issue 9, Article R60Dennis et tateDrill-down(c)Figureof4 GoChartsOuputOuput of GoCharts. (a) A bar chart showing the distribution of differentially expressed genes among Gene Ontology (GO) Biological Processes.Parameters were set to GO level 2, a hit threshold of five, and output was sorted by hit count. Blue bars are linked to additional annotation data shown in(b). Selecting the blue bar in (a) corresponding to 'response to stress' opens an HTML table showing the LocusLink, gene name, current classification, andother classification data for the genes in that category. (c) This subset of genes involved in 'stress response' was further characterized by selecting GOMolecular Function, GO level 3, a hit threshold of 2, and sorted by hit count. Selecting the 'Chart Values' button creates a new histogram revealing that 16of the 35 stress-response genes encode proteins possessing cytokine activity.of summarized data; and annotation tools, defined asproviding query-based access to functional annotation andproducing a tabular output. FatiGO, GoMiner, and MAPPFinder are exploratory tools, whereas ENSMART, GeneLynx,MatchMiner, Resourcerer, and Source are strictly annotationtools that produce tabular output. A major advantage ofDAVID is that it combines features of both categories, withGoCharts, KeggCharts, and DomainCharts representingexploratory tools, while DAVID's Annotation Tool produces atabular output of functional annotation. We comparedDAVID and these related programs on the basis of their available implementations and documentation as of May 2003,and the distribution of DAVID's functional features amongthese programs is shown in Table 3.Exploratory toolsFatiGO is a web-accessible application that functions in muchthe same way as DAVID's GoCharts, including the ability tospecify term-specificity level. Unlike DAVID, FatiGO does notallow the setting of a minimum hit threshold for simplifiedviewing of only the most highly represented functional categories. Likewise, FatiGO limits the graphical output to onlyone top-level GO category at a time, whereas DAVID allowsthe combined viewing of biological process, molecular function, and cellular component annotations simultaneously.FatiGO's static barchart output looks very similar to DAVID'sGoChart; an important distinction is that DAVID's GoChartsare dynamic, allowing users to drill-down and traverse theGO hierarchy for any subset of genes, view the underlyingGenome Biology 2003, 4:R60
http://genomebiology.com/2003/4/9/R60(a)Genome Biology 2003,Volume 4, Issue 9, Article R60Dennis et al. R60.7(b)commentreviewsreportsGenome Biology 2003, 4:R60informationThe body of biological knowledge associated with any list ofgenes extends far beyond the structured vocabulary of GO.DAVID provides, in addition to GoCharts, two additionalanalysis modules that utilize PFAM protein domain designations and KEGG biochemical pathways to graphically summarize the distribution of genes among functional domainsand pathways. Moreover, DAVID highlights pathway members within the biochemical pathways provided by KEGG.Whereas GoMiner provides hyperlinks to pathway databasessuch as BioCarta and KEGG for individual genes, lists ofgenes can only be batch processed in the context of GO. IninteractionsGoMiner is a standalone Java application that requires downloading of the program itself along with at least two auxiliaryfiles, one for DAG visualization and another for proteinstructural visualization. The remote database queried byGoMiner is reported to be updated every six months. It hasbeen our experience that, to accurately reflect the currentknowledge associated with a given gene, functional annotation data must be updated far more frequently. If users wishto use GoMiner with a local copy of its annotation database,they must also download and install a local copy of theMySQL database and the required drivers, a process that maybe difficult for inexperienced users of MySQL. In contrast,DAVID is web-accessible and updated weekly. The functionality of GoMiner is most similar to DAVID's GoCharts module. An enhanced feature of GoMiner is that it providesintuitive tree and DAG views of genes embedded within theGO hierarchy. DAVID has the ability to display such viewsthrough hyperlinks of GO terms to QuickGO's tree and DAGviews. A unique function provided by DAVID is the ability todrill-down and traverse the GO hierarchy for any subset ofgenes sharing a common classification, as demonstrated bythe identification of stress response genes with cytokine activity. Neither the tree nor DAG view of GoMiner provides thisfunctionality.refereed researchchart data and associated annotations, and link out to external data repositories including LocusLink and QuickGO. Asshown in Table 3 the majority of accession types accepted andfunctional annotations offered by DAVID are not availablefrom FatiGO.deposited researchFigureof5 KeggChartsOuputOuput of KeggCharts. (a) Visualization chart showing the distribution of 402 genes among KEGG biochemical pathways. The hit threshold was set tothree and the output was sorted by hit count. The large number of unclassified identifiers is due to the fact that KEGG is biochemical-pathway centric andthus provides low coverage of gene lists. Similarly to the output of GoCharts, blue bars represent the number of genes in each pathway. Selecting a bluebar opens an HTML table showing the LocusLink, gene name, current classification, and other classification data for the genes in that pathway (data notshown). (b) The KEGG biochemical pathway that appears following the selection of the pathway name 'apoptosis' in (a) depicts four differentiallyexpressed genes within the apoptosis pathway by highlighting them in light green and red. The fact that the KEGG pathway highlights only four geneswhereas the KeggChart maps five Affymetrix probe sets to the apoptosis pathway is due to the fact that two probe sets target the same 'TNF-alpha' gene.
R60.8 Genome Biology 2003,Volume 4, Issue 9, Article R60Dennis et reof6 DomainChartsOuputOuput of DomainCharts. (a) Visualization chart showing the distribution of 402 genes among protein domains. The parameters were set to a minimum hitthreshold of four and output was sorted by hit count. Similar to the output of GoCharts and KeggCharts, blue bars represent the number of genescontaining that particular domain. Selecting a blue bar opens an HTML table showing the LocusLink, gene name, current classification, and otherclassification data for the genes in that pathway (data not shown). (b) Selecting the domain name 'IL8' in (a), which contains six differentially expressedgenes, brings the user to a new page containing the output from the Conserved Domain Database (CDD) of NCBI, which provides detailed informationabout the IL-8 domain, including structural information, multiple sequence alignments, and descriptive information about the domain and the proteins thatpossess it.addition to providing hyperlinks to external data repositoriesfor each gene, DAVID provides links to primary sequenceinformation available at NCBI and human-curated functionalsummaries parsed from LocusLink. These features are notavailable in GoMiner. DAVID can be used to collect, analyzeand explore functional annotation associated with human,mouse, rat, and Drosophila gene lists, whereas GoMiner isrestricted to analyzing human data. Another restrictive feature of GoMiner is that it only takes HUGO gene symbols asinput. This is problematic in that
annotations and database cross-references are derived from LocusLink, which provides stable, human-curated represen-tations of genes. For more detailed information regarding the data sources used by DAVID please see the FAQ section at [9]. Analysis modules DAVID is composed of four main modules: Annotation Tool, GoCharts, KeggCharts, and .

![No, David! (David Books [Shannon]) E Book](/img/65/no-20david-20david-20books-20shannon-20e-20book.jpg)