Transcription
8th Carinata Biomaterials SummitValerie Reed, Acting Director,Bioenergy Technology Office (BETO)July 20, 20211 Bioenergy Technologies Officeeere.energy.gov
Accelerate the research, development, demonstration, and deploymentof technologies and solutions to equitably transition America to a carbonpollution-free electricity sector by 2035 and a economy by no later than2050, creating good-paying jobs with the free and fair chance to join aunion, and ensuring the clean energy economy benefits all Americans,especially workers and communities impacted by the energy transitionand those historically underserved by the energy system andoverburdened by pollution.EERE MissionKeys to Ensure the Greatest ImpactEnvironmentalJustice and Equity Diversity in STEMU.S. DEPARTMENT OF ENERGYWorkforceDevelopmentOFFICE OF ENERGY EFFICIENCY & RENEWABLE ENERGYEERE Program PrioritiesDOE-EERE Overall Decarbonization StrategyDecarbonizing theelectricity bonizingtransportationacross all modesReduce the carbonfootprint ofbuildingsDecarbonizing theagriculture sector,specifically focusedon the nexusbetween energy andwaterState and LocalPartnerships2
Context For Transportation Decarbonization Largest source of economy -wide CO2 emissions : netzero by 2050 requires dramatic improvement fromtransportation 50% of energy expenditures and a local pollution issue The magnitude of industrial change and directconsumer touch points with transportation requiremarket-pull solutions Must support demand for growth in mobility options 100% clean electricity and dramatic technology costreductions enable deep transportation decarbonization Achieving 2050 goal requires success in the market by2035 which requires direction in 2021 Significant implications for global competitiveness,trade, and domestic jobsU.S. DEPARTMENT OF ENERGYOFFICE OF ENERGY EFFICIENCY & RENEWABLE ENERGYPREDECISIONAL: DO NOT SHARE, CITE, OR DISTRIBUTE3
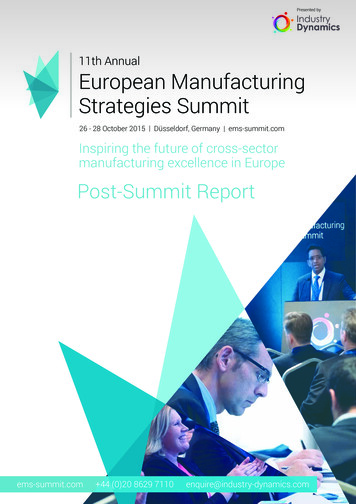
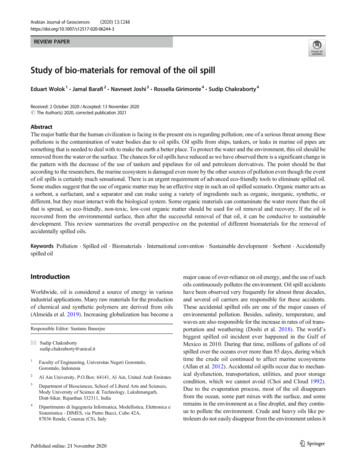
The Real Challenge: Low-Carbon Fuel for Large Vehicles8 Quads)2050 U.S. Transportation Energy Use (24.7 2%Air14%Demand for mobility in the US is projected to grow withpopulation and economy: Light-duty vehicles: 20% by 2050 Trucking: 40% by 2050 Aviation: 70% by 2050Energy use for “hard-to-electrify” heavy vehicles is projectedto reach 70 B gallon in 9% Commercial LightTrucks 1%U.S. DEPARTMENT OF ENERGYPassengerLight Trucks27%Buses 4%OFFICE OF ENERGY EFFICIENCY & RENEWABLE ENERGY Aviation: 36 B GalMaritime/Rail: 11 B GalLong-haul trucks: 21 B GalPREDECISIONAL: DO NOT SHARE, CITE, OR DISTRIBUTE4
Biomass-Derived Chemicals- Broadens opportunity to expand biomass markets.- Allows us to address fuel and products (i.e. economics of the wholebarrel)-Inputs:Cellulosic basedcrops & ag. residueOil based cropsAlgaeBio-solidsMSWWaste gas (CO, C02)U.S. DEPARTMENT OF ENERGYOFFICE OF ENERGY EFFICIENCY & RENEWABLE ENERGYEnd Products:- Fuels- Aviation- Marine & Diesel- Gasoline- Chemical Products:(15% Volume 46%Profit)5
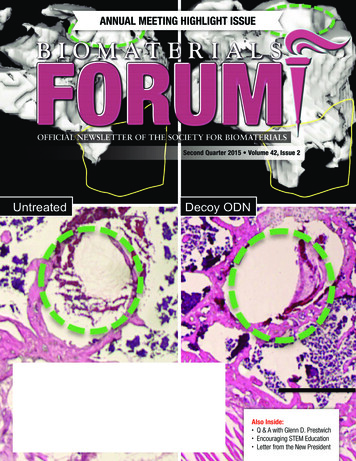
New, Growing Markets for Biomass will be Critical 70% of total 2019 petroleum 000 Current markets for biomass include starchethanol, biodiesel, renewable diesel andsustainable aviation fuels and some chemicals250200150100TrucksJet DieselTRANSPORTATION LIQUID FUELSCONSUMPTION [B GAL]250250RailAirMarineCurrent (2019)(2019)Current50AlgaeMSW & Wet WastesEnergy CropsForestryAgriculturalVegetable OilStarch (EtOH)1 Billion ton ofbiomass, 62 BGGE of biofuels*0OFFICE OF ENERGY EFFICIENCY & RENEWABLE ENERGY Biomass role in decarbonizing the economy: Fully supply future Aviation/ Maritime/Rail(requires 75% of all feedstocks)Potential Supply (2030 )Future (2050)AEO BAU ScenarioRole of cover crops are not well defined in the Billion Ton Study:Carinata, Camelina, and Penny CrestNEEDS: Data on harvest, collection, storage, transport, andpreprocessing Incorporate data into models to develop supply curves,evaluate economic competitiveness and environmentalbenefitsU.S. DEPARTMENT OF ENERGY Focus biomass where it can make the biggestimpact in terms of CO2 reduction createsopportunity for significant new markets forbiomass Only potential renewable liquid carbonsource available to the chemicals industry. Increase CO2 in the soil while helpingfarmers maximize profits on marginal lands,by providing valuable feedstocks forbioenergy productionPREDECISIONAL: DO NOT SHARE, CITE, OR DISTRIBUTE6
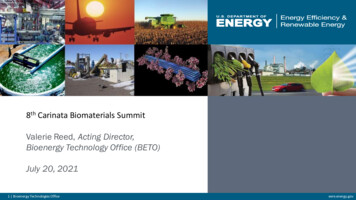
Fuel and Chemical GHG impactsThe billion tons of sustainable biomass available in the US can goto a variety of products with large GHG benefits in all scenariosCurrent and Potential Avoided Annual GHG Emissions(Million tons of CO2e)600528 All scenarios suggest significant GHGbenefits vs. current biomassutilization.Avoided GHG Emissions(Million tons CO2e) Billion Ton Scenarios were“optimized” for differentfuels/products (e.g., ethanol, jet) All scenarios includes a range ofliquid transportation fuels, heat &power, chemicals, wood pellets, etc.5004464464484003603002001161000CurrentBase CaseEthanolFocusedCaseJetFocusedCaseHeat & ChemicalsPowerFocusedFocusedCaseCaseBiofuels, Bioproducts and Biorefining, Volume: 11, Issue: 1, Pages: 110 -128, First published: 21 Nov ember 2016, DOI: (10.1002/bbb.1728)U.S. DEPARTMENT OF ENERGYOFFICE OF ENERGY EFFICIENCY & RENEWABLE ENERGY7
EERE SAF Goals and ImpactGOALS 7.00R&D: Cost Reduction with Maximum CO2 Reduction20222030 6.25 GGE 6.00 3.00/GGE 60% greenhouse gas (GHG) reduction 2.50/GGE 70% GHG reductionMFSP /GGE of Fuel Production(2016 )Demonstration: Increase Commercial Supply of SAF 5.002030Demonstrate as many as 5 feedstock/technologypathways at engineering scale to reduce risk forcommercial build out.Equip traditional biofuels industry to transition to SAFwith GHG reductions of 70%.2040Aggressive industrial build-out resulting in 17Bgal SAF in market.2050Aggressive industrial build-out resulting in 35Bgal SAF in market – 100% projected aviation needs. 3.50 GGE 4.00 3.00 GGE 2.50 GGE 3.00 2.00LONG-TERM IMPACTS 1.000201220182022MFSP minimum fuel selling priceU.S. DEPARTMENT OF ENERGYOFFICE OF ENERGY EFFICIENCY & RENEWABLE ENERGY203060B gal renewable hydrocarbon fuels40B pounds of renewable chemicals 450 million tons CO 2 reduced annually1 million direct jobsPREDECISIONAL: DO NOT SHARE, CITE, OR DISTRIBUTE8
Billion Tons of Sustainable Biomass For SAFEx ConversionProcessesFeedstockSeed OilsFAME/HEFACorn grainFermentation toEtOH/Alcohol to JetFats, oils, greasesHEFAForestry resources &woody wastesFeedstock Inputmillion dry tons/yrGasification withFischer TropschsynthesisWoody energy cropsMSW14871335055Agricultural residuesIsobutanol - Alcoholto JetHerbaceous energy cropsAlgaeAlgaeWet WastesCurrently used biomass non-biofuel149190Combined SU.S. DEPARTMENT OF ENERGY9238 1 billion ton biomass (BtB) 60 billion gal of fuel 450 MMT CO2e reduction/yr Sustainability factors – life cycle GHG emissions,fossil energy consumption, land allocation andwater consumption. Land Use change @ 40/dt 5.6 M/230 M acres will shift fromcommodity crops to energy crops and @ 60/dt 30M/230M acres crop land and49M/460M acres pasture will shift Differences made up in increased cropproductivity (2% annually) and managedintensive grazing 10 different technologies will be necessary totransform diverse biomass into SAF. Technologies are at different maturity levels, withsome ready for demo and some with substantialremaining R&D.1,103OFFICE OF ENERGY EFFICIENCY & RENEWABLE ENERGY9
EERE has Developed Multiple SAF PathwaysU.S. DEPARTMENT OF ENERGYOFFICE OF ENERGY EFFICIENCY & RENEWABLE ENERGY10
Demo-Scale Projects Key to De-risk and Accelerate CommercializationR&DPre-PilotTRL 2-3PilotTRL 4-5TRL 6DemonstrationTRL 7CommercialTRL 8-9Adva nci ng Biorefinery TechnologiesRes earch Developmenta nd DemonstrationEngi neering andIntegrationPre-CommercialGa pPre-IPO Ga pBa nksPioneer PlantIndustry/Pri vateInves tors/VCsUni versities/ResearchIns titutesGovernment(Na ti onal La bs)Demonstration PlantGovernment(Na ti onal La bs)Bench ScaleGovernment/Pri va te Pa rtnershipPilot PlantGovernment/Pri va te Pa rtnershipProcess DevelopmentUnit (PDU)Average TotalProject Cost 1– 5 Million 5– 10 Million 25– 50 Million 100– 500 Million 250– 500 MillionAverage BiomassThroughputGrams/DayKilograms/Day 50 Tonnes/Day50–250 Tonnes/Day 250 ns(batch)0.1–1 M GPY(campaign)1–10 M GPY(extended campaigncontinuous)50 M GPY(continuous)GovernmentU.S. DEPARTMENT OF ENERGYProject Recipients and PartnersOFFICE OF ENERGY EFFICIENCY & RENEWABLE ENERGYBanksPREDECISIONAL: DO NOT SHARE, CITE, OR DISTRIBUTE11
M e d iu m F re ig h t Tru c k s 6 % He a v y F re ig h t Tru c k s 1 6 % Air 1 0 % W a te r 5 % Ra il 2 % Au to m o b ile s 2 2 % Pa s s e n g e r Lig h t Tru c k s 2 7 % Bu s e s 4 % Co m m e rc ia l Lig h t Tru c k s 1 % Lig h t-M e d iu m F re ig h t Tru c k s 9 % He a v y F re ig h t Tru c k s 1 6 % Air 1 4 % W a te r 5 % Ra il 2 %