Transcription
ACCELERATEState of DevOps2019Sponsored by
ContentSTABLE OF CON T EN TSEXeCUTIVE SUMMARYKEY FINDINGS3877ACKNOWLEDGEMENTS79AUTHORS80APPENDIX A:Visual presentation ofThe Four Key Metrics81APPENDIX B:Strategies for Scaling DevOps821426HOW DO WE IMPROVe?29SDO & Organizational performance30Productivity55HOw DO WE TRANSFORM: What really works?METHODOLOGY7HOW DO WE COMPARE?HOW To USETHE RESEARCH MODELS765WHO TOOK THE SURVEY?DEMOGRAPHICS & FIRMoGRAPHICSFINAL THOUGHTS69
EXECUTIVE SUMMARYThe Accelerate State of DevOps Reportrepresents six years of research anddata from over 31,000 professionalsworldwide. It is the largest and longestrunning research of its kind, providingan independent view into the practicesand capabilities that drive highperformance. The results let us understandthe practices that lead to excellencein technology delivery and powerfulbusiness outcomes.Our research employs rigorousstatistical methods to presentdata-driven insights about the mosteffective and efficient ways to develop3and deliver technology. Cluster analysisallows teams to benchmark against theindustry, identifying themselves aslow, medium, high, or elite performersat a glance.Teams can then leverage the findingsof our predictive analysis to identifythe specific capabilities they can useto improve their software deliveryperformance and ultimately becomean elite performer.This year, we also investigate the waysin which organizations can supportengineering productivity throughAccelerate: State of DevOps 2019 Executive Summary
initiatives such as supportinginformation search, more usabledeployment toolchains, and reducingtechnical debt through flexiblearchitecture, code maintainability,and viewable systems.We also the identify the capabilitiesthat drive improvement in the Four KeyMetrics, including technical practices,cloud adoption, organizational practices(including change approval processes),and culture.Our research continues to show thatthe industry-standard Four Key Metrics1of software development and deliverydrive organizational performance intechnology transformations. This year’sreport revalidates previous findingsthat it is possible to optimize forstability without sacrificing speed.For organizations seeking guidance onhow to improve, we point to the only real pathforward: Start with foundations, and thenadopt a continuous improvement mindsetby identifying your unique constraint (or setof constraints). Once those constraints nolonger hold you back, repeat the process.We also provide guidance on the mosteffective strategies for enacting these changes.1 -key-metrics4Accelerate: State of DevOps 2019 Executive Summary
KEYFINDINGS512The industry continues to improve,particularly among the elite performers.The proportion of our highest performershas almost tripled, now comprising 20% of allteams. This shows that excellence is possible—those that execute on key capabilities seethe benefits.Delivering software quickly,reliably, and safely is at the heartof technology transformation andorganizational performance.We see continued evidence that softwarespeed, stability, and availability contributeto organizational performance (includingprofitability, productivity, and customersatisfaction). Our highest performers aretwice as likely to meet or exceed theirorganizational performance goals.Accelerate: State of DevOps 2019 Executive Summary
346The best strategies for scalingDevOps in organizations focuson structural solutions thatbuild community.High performers favor strategies thatcreate community structures at bothlow and high levels in the organization,including Communities of Practice andsupported Proofs of Concept, likelymaking them more sustainable andresilient to reorgs and product changes.Cloud continues to be a differentiatorfor elite performers and drives highperformance.The use of cloud—as defined byNIST Special Publication 800-145—is predictive of software deliveryperformance and availability. Thehighest performing teams were 24times more likely than low performersto execute on all five capabilities ofcloud computing.5Productivity can driveimprovements in work/life balanceand reductions in burnout, andorganizations can make smartinvestments to support it.6There’s a right way to handle thechange approval process, and itleads to improvements in speed andstability and reductions in burnout.To support productivity, organizationscan foster a culture of psychologicalsafety and make smart investmentsin tooling, information search,and reducing technical debtthrough flexible, extensible, andviewable systems.Heavyweight change approvalprocesses, such as change approvalboards, negatively impact speed andstability. In contrast, having a clearlyunderstood process for changesdrives speed and stability, as wellas reductions in burnout.Accelerate: State of DevOps 2019 Executive Summary
WHOTOOKTHE SURVEY?DORA’s research provides insight intosoftware development and DevOpspractices applied in industry, backedby scientific studies spanning six yearswith over 31,000 survey responsesfrom working professionals. This year,almost 1,000² individuals from a rangeof industries around the world addedtheir voices to the 2019 Report. Overall,we see similar representation acrosskey demographic and firmographicmeasures when compared to last year,other than a noticeable drop in thereported percentage of women on teams.2W ith almost 1,000 respondents, our analyses have a 3% margin of error assuming 23 millionsoftware professionals worldwide and a 95% confidence interval.
Compared to last year, we see consistentrepresentation of respondents across keydemographic categories that include gender,disability, and underrepresented groups. Whilewe see similar gender makeup among our surveyrespondents overall, the reported percentage ofwomen on teams fell compared to last year.DEMOGRAPHICS& FIRMOGRAPHICSWe also saw consistent representation across keyfirmographic categories including company size,industry, and region. The majority of respondentswork as engineers or managers within the technologyindustry. We continue to have diverse representationacross departments from consultants, coaches, andsales/marketing roles. Additionally, we continue tosee industry representation from highly regulatedorganizations in financial services, government,healthcare, and retail companies.8Accelerate: State of DevOps 2019 Who Took the Survey?
10 82 17LGENDER83%10%Gender breakouts from this year’s survey responses remainconsistent with 83% male in 2019 (vs. 83% last year), 10% female7%(vs 12% last year), and 1% non-binary (vs 1% last year).3Respondents this year stated that only 16% of teamsinclude women (median), representing a dip from25% reported last year.1%6 85 9LDEMOGRAPHICSFemaleMaleNon-BinaryDid not specify85%6%9%NoYesDISABILITYDisability is identified along six dimensions that followguidance from the Washington Group Short Set.This is the second year we have asked about disabilityand it has stayed consistent at 6% in 2018 and 2019.4Did not specify3T his is similar to proportions reported by the Stack Overflow Developer Survey 2019, which includes 90% men and 10% women.They do not include non-binary and “did not specify.” https://insights.stackoverflow.com/survey/20194 This is consistent with proportions seen elsewhere in industry; e.g., the Stack Overflow Developer Survey 2019,which reports 6% of total respondents identify as having a disability. elerate: State of DevOps 2019 Who Took the Survey?
14 75 11LUNDERREPRESENTED GROUPS76%Identifying as a member of an underrepresented groupcan refer to race, gender, or another characteristic. This isthe third year we have captured this data and it has stayedrelatively consistent from 13% in 2018 to 14% in 2019.*14%11%NoYesDid not specifyDEMOGRAPHICS* 100% due to rounding1048%3%0-29%3-5Similar to last year, a large portion of respondents have16% 20%6-1011-15YEARS OF EXPERIENCE4%Morethan 16more than 16 years of experience (50% last year), followedby 11-15 years of experience (also 20% last year).Prefer notto respondOverall demographic breakouts in 2019 remain consistent with2018, with slight percentage variances year to year that fallwithin the margin of error.Accelerate: State of DevOps 2019 Who Took the Survey?
DEPARTMENTSParticipants who work in DevOps teams have increasedDevelopment or EngineeringDevOps or SREsince we began our study, reporting 16% in 2014, 19%in 2015, 22% in 2016, and holding steady around 27%for the past three years. (Note this is within the margin of error.)4%C-level Executive4%3%NA2%2%Other2%FIRMOGRAPHICSPrefer Not to ceOtherProfessional Services1%Quality Engineering or Assurance1%Information Security1%Release Engineering1%INDUSTRYSimilar to last year, most respondents work within theHealthcare & Pharmaceuticals5%technology industry, followed by financial services, retail,Government5%and ndustrials & fit115%Consultant, Coach, or TrainerProduct ManagementFinancial Services16%ManagerIT Operations or Infrastructure30%26%1%Accelerate: State of DevOps 2019 Who Took the Survey?
50%29%1%1%FIRMOGRAPHICS1%9%1%2%4%REGIONConsistent with last year, North America accounts forroughly half of all respondents , followed by EU/ UKat 29%. We see a drop in responses from Asia, fallingfrom 18% last year to 9% this year.12Accelerate: State of DevOps 2019 Who Took the Survey?
EMPLOYEES1-45-9One out of four respondents work at very large companies10-19(10,000 ) employees, accounting for 26% of all responses, and2,000-4,999employees working in companies with 500-1,999 employees5,000-9,99910,000 (down 12% vs 2018) and more responses from people workingI don’t know/NAin company sizes of 100-499 employees (up 7% vs 2018).FIRMOGRAPHICS56%52%22%25%Other Windows36%43%Linux Debian/Ubuntu variantsLinux Enterprise variants (RHEL, Oracle, CentOS)Linux FedoraSUSE Linux Enterprise ServerLinux OpenSUSELinux Arch5%4%8%5%4%4%2%2%Other LinuxOther UNIXFreeBSD/NetBSD/OpenBSD4%3%3%SolarisOS Other5%21%15%8%7%2%26%OPERATING SYSTEMS33%Windows 2012/2012R2AIX1312%26%13%500-1,999to the 2018 Report, though there was a drop in responses fromWindows 2008/2008R23%100-499between 20-1,999 employees. These distributions are similar6%1%20-99another two out of four respondents work at companies rangingWindows 2003/2003R23%The distribution of operating systemswas fairly consistent compared tolast year as : State of DevOps 2019 Who Took the Survey?
HOW DO WECOMPARE?This section functions as your DevOpsbenchmark assessment. We use rigorousstatistical methods to examine how teamsare developing, delivering, and operatingsoftware systems. Benchmarks for elite,high, medium, and low performers showwhere you are in the context of multipleimportant analyses throughout the report.We also identify trends year over year.
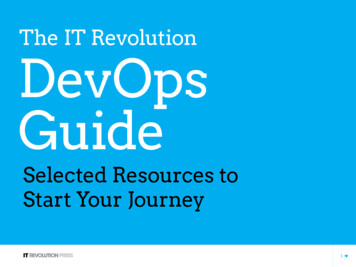
Organizations increasingly rely on their ability to deliverand operate software systems to achieve their goals.To compare performance on this key outcome metric,the industry needs a way to measure the effectivenessof their development and delivery practices. Over thelast six years we have developed and validated fourSOFTWAREDELIVERY ANDOPERATIONALPERFORMANCEmetrics that provide a high-level systems view ofsoftware delivery and performance and predict anorganization’s ability to achieve its goals. Last year,we added an additional metric focused on operationalcapabilities, and found that this measure helpsorganizations deliver superior outcomes. We callthese five measures software delivery andoperational (SDO) performance, which focuson system-level outcomes. This helps avoid thecommon pitfalls of software metrics, which often pitdifferent functions against each other and result inlocal optimizations at the cost of overall outcomes.15Accelerate: State of DevOps 2019 How Do We Compare?
The first four metrics that capture theto release along with deployment frequency.effectiveness of the development andStability is measured using time to restore—delivery process can be summarized in termsthe time it takes from detecting a user-of throughput and stability. We measure theimpacting incident to having it remediated—throughput of the software delivery processand change fail rate, a measure of the qualityusing lead time of code changes from check-inof the release process.PERF O RMA N CE MET RICSSOFTWARE DEVELOPMENTSOFTWARE DEPLOYMENTSERVICE OPERATIONChange FailAvailabilityLead TimeDeployment FrequencyTime to RestoreFOUR KEY METRICS16Accelerate: State of DevOps 2019 How Do We Compare?
Many professionals approach these metrics asIn addition to speed and stability, availabilityrepresenting a set of trade-offs, believing thatis important for operational performance.increasing throughput will negatively impactAt a high level, availability represents anthe reliability of the software delivery processability for technology teams and organizationsand the availability of services. For six years into keep promises and assertions abouta row, however, our research has consistentlythe software they are operating. Notably,shown that speed and stability are outcomesavailability is about ensuring a product orthat enable each other. Cluster analysis of theservice is available to and can be accessedfour software delivery measures in the 2019by your end users.6data reveals four distinct performance profiles,with statistically significant differences inthroughput and stability measures amongthem. As in previous years, our highest5performers do significantly better on all fourmeasures, and low performers do significantlyworse in all areas.Availability reflects how well teams definetheir availability targets, track their currentavailability, and learn from any outages,making sure their feedback loops arecomplete. The items used to measureavailability form a valid and reliablemeasurement construct.5A vailability is not included in our cluster analysis because availability measures do not apply the same way for software solutions that are not providedin the form of services, such as packaged software or firmware.6 Teams can define their availability goals using Service Level Agreements (SLAs) and Service Level Objectives (SLOs) and measure their performance usingService Level Indicators (SLIs). For more information on developing SLAs, SLOs, and SLIs, you can check out Site Reliability Engineering: How GoogleRuns Production Systems (2016) by Beyer et al.17Accelerate: State of DevOps 2019 How Do We Compare?
Aspect of Software Delivery Performance*EliteHighMediumLowDeployment frequencyFor the primary application or service you work on, howoften does your organization deploy code to productionor release it to end users?On-demand(multipledeploys per day)Between onceper day andonce per weekBetween onceper week andonce per monthBetween onceper month andonce every sixmonthsLead time for changesFor the primary application or service you work on, what is yourlead time for changes (i.e., how long does it take to go from codecommitted to code successfully running in production)?Less thanone dayBetween oneday andone weekBetween oneweek andone monthBetween onemonth andsix monthsLess thanone hourLess thanone dayaLess thanone dayaBetween oneweek andone month0-15%b,c0-15%b,d0-15%c,d46-60%Time to restore serviceFor the primary application or service you work on, how longdoes it generally take to restore service when a service incidentor a defect that impacts users occurs (e.g., unplanned outage orservice impairment)?Change failure rateFor the primary application or service you work on, what percentageof changes to production or released to users result in degradedservice (e.g., lead to service impairment or service outage) andsubsequently require remediation (e.g., require a hotfix, rollback,fix forward, patch)?Medians reported because distributions are not normal.All differences are significantly different based on Tukey’s post hoc analysis except where otherwise noted.a,b,c Means are significantly different based on Tukey’s post hoc analysis; medians do not exhibit differences because of underlying distributions.d Means are not significantly different based on Tukey’s post hoc analysis.*For a visual presentation of the Four Metrics, please see Appendix A.18Accelerate: State of DevOps 2019 How Do We Compare?
We also confirmed last year’s finding that bettersoftware delivery goes hand-in-hand with higheravailability. Analysis shows that availabilitymeasures are significantly correlated with softwaredelivery performance profiles, and elite and highperformers consistently reported superioravailability, with elite performers being 1.7 timesmore likely to have strong availability practices.7Industry velocity is increasingMany analysts are reporting the industry has“crossed the chasm” with regards to DevOps andtechnology transformation, and our analysis thisyear confirms these observations. Industry velocityis increasing and speed and stability are bothpossible, with shifts to cloud technologies fuelingthis acceleration. This reaffirms the importanceof technology that enables organization to delivervalue to their stakeholders.INDUSTRY ANDORGANIZATION IMPACTSON SDO PERFORMANCEWe ran additional analyses (e.g., using control variables)to see if industry and organization size had a significanteffect on SDO performance. We found no evidence thatindustry has an impact with the exception of retail,suggesting that organizations of all types and sizes,including highly regulated industries such as financialservices and government, can achieve high levels ofperformance. Our results for the retail industry suggestthat those in retail see some benefits in speed and stability.We found evidence that enterprise organizations(those with more than 5,000 employees) are lowerperformers when compared to those with fewer than5,000 employees. This is likely due to several factorsseen in large organizations, most notably heavyweightprocess and controls as well as tightly coupledarchitectures that introduce delay and associatedinstability. We urge enterprises not to take thesefindings as an excuse to suffer poor performance,but recognize that excellence is possible, embark on aprogram of continuous improvement, and look to otherenterprise organizations that have achieved eliteperformance for inspiration and guidance.7 It should also be noted that none of these practices apply solely to the cloud.19Accelerate: State of DevOps 2019 How Do We Compare?
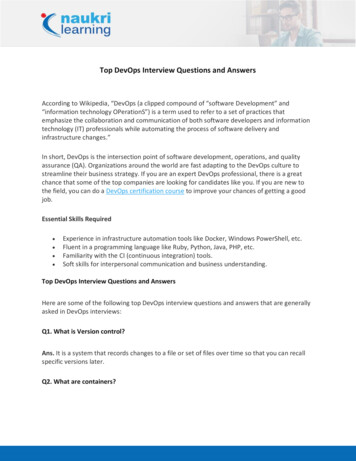
We compared the proportions of eachperformance cluster in 2018 and 2019:20182019*PERFORMANCE CLUSTERSWe identified elite performers in last year’s report20%7%ELITEELITEPERFORMERS48%HIGH PERFORMERSfor the first time, but this group was a subset ofour high performers. This year, we see four distinctgroups in our analysis. We use the same namebecause the elite performers exhibit the same23%HIGH PERFORMERSspeed and stability characteristics this year as lastyear, showing that these two groups are similar.37%MEDIUM PERFORMERS15%This comparison shows us that:44%MEDIUM PERFORMERSLOW PERFORMERS12%LOWPERFORMERS The proportion of our elite performers has almost tripled,showing that excellence is possible—it just requires execution. The proportion of low performers is down. This reflectsa continued shift in the industry, as organizations continueto transform their technology. The proportion of medium performers is up. Some are likelyimproved low performers, while others may be high performerswho dropped as they struggled with increased complexity.* 100% due to rounding20Accelerate: State of DevOps 2019 How Do We Compare?
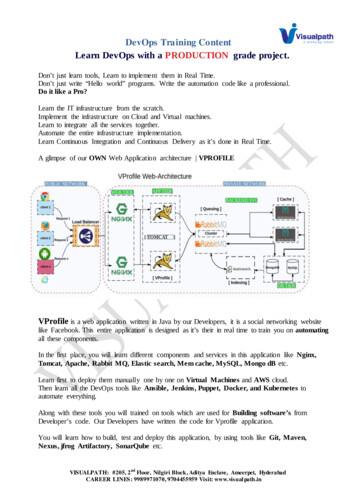
ELITE PERFORMERSComparing the elite group against the lowperformers, we find that elite performers have 208106TIMES MORETIMES FASTERfrequent code deploymentslead time fromcommit to deploy2,6047TIMES FASTERTIMES LOWERtime to recover from incidentschange failure rate(changes are 1/7 as likely to fail)Throughput21StabilityAccelerate: State of DevOps 2019 How Do We Compare?
THROUGHPUTDeployment frequencyThe elite group reported that it routinely deploys on-demand andperforms multiple deployments per day, consistent with the lastseveral years. By comparison, low performers reported deployingbetween once per month (12 per year) and once per six months(two per year), which is a decrease in performance from last year.The normalized annual deployment numbers range from 1,460deploys per year (calculated as four deploys per day x 365 days) forthe highest performers to seven deploys per year for low performers(average of 12 deploys and two deploys). Extending this analysisshows that elite performers deploy code 208 times more frequentlythan low performers. It's worth noting that four deploys per dayis a conservative estimate when comparing against companiessuch as CapitalOne that report deploying up to 50 times per dayfor a product,8 or companies such as Amazon, Google, and Netflixthat deploy thousands of times per day (aggregated over thehundreds of services that comprise their production environments).8 In 2017: -devops-at-its-core/d/d-id/133051522Accelerate: State of DevOps 2019 How Do We Compare?
Change lead timeSimilarly, elite performers report changelead times of less than one day, with changelead time measured as the time from codecommitted to having that code successfullydeployed in production. This is a smalldecrease in performance from last year, whenour highest performers reported change leadtimes of less than one hour. In contrast to ourelite performers, low performers required leadtimes between one month and six months.With lead times of 24 hours for elite performers(a conservative estimate at the high end of“less than one day”) and 2,555 hours for lowperformers (the mean of 730 hours per monthand 4,380 hours over six months), the elitegroup has 106 times faster change lead timesthan low performers.23Accelerate: State of DevOps 2019 How Do We Compare?
STABILITYTime to restore serviceThe elite group reported time to restore service of less than one hour,while low performers reported between one week and one month.For this calculation, we chose conservative time ranges: one hour for highperformers and the mean of one week (168 hours) and one month (5,040hours) for low performers. Based on these numbers, elites have 2,604 timesfaster time to restore service than low performers. As previously noted,time to restore service performance stayed the same for both elite andlow performers when compared to the previous year.Change failure rateElite performers reported a change failure rate between zero and 15%,while low performers reported change failure rates of 46% to 60%.The mean between these two ranges shows a 7.5% change failure ratefor elite performers and 53% for low performers. This represents changefailure rates for elite performers that are seven times better than lowperformers. As noted earlier, change failure rates stayed the samefor both elite and low performers when compared to the previous year.24Accelerate: State of DevOps 2019 How Do We Compare?
All of the measures shown are relative; thatis, they compare the highest and the lowestperformers each year. From 2018 to 2019, theSOFTWARE DELIVERYPERFORMANCEComparing highest to lowest performers.gap for all performance metrics betweenthe lowest and highest performers increasedor stayed the same, with the exception of leadtime for changes. The increased gap in deployfrequency indicates a decrease in performanceamong low performers, which may be due7xLower ChangeFail Rate2019to growing complexity in environments and208xMore FrequentDeploy Frequencytherefore difficulty in delivering software.106xFasterLead TIme2604xFaster Time toRestore ServiceThe reduced ratio of the lowest to the highestperformers in lead time represents a reductionin the performance of the highest performinggroup, which is seeing lead times increasefrom less than an hour to between an hourand a day. This may reflect the trend in moreheavyweight code review and approvalprocesses that have become popular7xLower ChangeFail Rate201846xMore FrequentDeploy Frequency2555xFasterLead TIme2604xFaster Time toRestore Servicein recent years.25Accelerate: State of DevOps 2019 How Do We Compare?
HOW TOUSE THERESEARCH MODELSThis year’s Report is designed to help driveimprovement in both performance andproductivity using two research models. Youmay wonder, why are there two research models?How are they different? How are they similar?And most importantly, how can I use them tohelp me make decisions and guide my own work?Start by identifying your goal.SDO & ORGANIZATIONALPERFORMANCESTARTPRODUCTIVITYCULTURE OF PSYCHOLOGICAL SAFETYCHANGE MANAGEMENTCLOUDUSEFUL, EASY-TO-USE TOOLSINTERNAL SEARCHTECHNICAL PRACTICESEXTERNAL SEARCHDISASTER RECOVERY TESTING26TECHNICAL DEBTAccelerate: State of DevOps 2019 How to Use the Research Models
If you want to improve SDO performance or organizational There are other important outcomes from this work.performance, look at the model with those constructs,Benefits from pursuing improvements in SDO andand head to that section of the report for guidance on whichorganizational performance include reducing burnoutcapabilities you should focus on.and deployment pain (which we researched inIf you want to improve productivity, look at the model withproductivity as a construct, and head to that section of thereport for guidance on which capabilities you should focus on.How to use the modelsto guide your transformation Identify the capabilities that will improve your goal (that2016 and 2017), and improving security outcomes(which we researched in 2017 and 2018), and culture(researched in years 2014 through 2019). Additionalbenefits from improving productivity include improvingwork/life balance and reducing burnout.How to read the research modelsis, those with arrows that point to the construct you wantWe use a structural equation model (SEM), which is a predictiveto improve). As we’ve identified in this report, these aremodel used to test relationships. Each box representsyour candidate capabilities for improvement. (For SDOa construct we measured in our research, and each arrowand organizational performance, we have also identifiedrepresents relationships between the constructs. A largeradditional capabilities in our previous five years of research.)9box that contains boxes (constructs) is a second-orderRemember to accelerate your transformation by startingwith a solid foundation and then focusing on thecapabilities that are constraints: What capabilities causethe biggest delays? What are the biggest headaches?Where are the biggest problems? Pick three to five anddedicate resources to solving these first. Don’t worryif you still have problems; by focusing on the biggestconstruct. A light blue box with a dotted line to another constructindicates a control variable. (See pages 31 and 57 for full models.)Constructs in bold represent those that we investigate for thefirst time this year. Constructs with a dark bold outline arecommon team and organizational goals: SDO performanceand organizational performance or productivity. Keep thesein mind as you identify your goals and read the models.problems now, you remove bottlenecks, discoversynergies, and avoid unnecessary work.279 You can find all of our State of DevOps Reports at cloud.google.com/devopsAccelerate: State of DevOps 2019 How to Use the Research Models
To interpret the models, all lines with arrows can be readusing the words “predicts,” “affects,” “drives,” or “impacts.”For example, the second-order construct SDO performance iscomprised of the constructs software delivery performanceWhat the overlap in the two researchmodels tells us Making smart investments in the pursuit of SDOand availability, and these together drive organizationalperformance can reduce burnout, and better productivityperformance. The construct disaster recovery testing drivescan lead to reductions in burnout as well. This shouldavailability. We indicate that disaster recovery testing is abe encouraging to organizations and technologistsnewly investigated construct this year by marking it in bold.alike, as the demands of work continue to grow.An arrowed line with a (-) next to it indicates a negative impactWe note that having a good work/life balance isbetween two constructs; for example, technical debt negativelykey to reducing burnout.impacts (or reduces) productivity. A culture of psychological safety contributes toSDO performance, organizational performance,and productivity, showing that growing and fosteringYou may notice there’s some overlapin the two research models.This is because the goals—SDO performance and productivity—are related in many ways. The outcomes are about makingand delivering technology in superior ways, and in waysthat deliver value to organizations and to individuals.It makes sense that some of the things we do to supportthe work of software delivery will also benefit the productivitya healthy culture reaps benefits for organizationsand individuals. Investments in code maintainability, loosely coupledarchitecture, and monitoring help support SDOperformance (via continuous delivery) and productivity(via reductions in technical debt), highlighting theimportance of good tooling and systems.of those who develop and deliver software. Yet while theyare similar, they still measure different outcomes and so weconduct our analysis separately. Thus, they are in two differentresearch models.28Accelerate: State of DevOps 2019 How to Use the Research Models
HOW DO WEI M PROVE S D O &O R G A N I Z AT I O N A LPERFORMANCE?A key
3 Accelerate: State of DevOps 2019 Executive Summary EXECUTIVE SUMMARY The Accelerate State of DevOps Report represents six years of research and data from over 31,000 professionals worldwide. It is the largest and longest-running research of its kind, providing an independent view into th