Transcription
Creating EnterpriseLeadersCEB HR Leadership Council
CEB HR Leadership Council Content Publishing SolutionsExecutive DirectorsMike GriffinAaron KisselBrian KroppPrint DesignerTiffany ToddManaging DirectorLeah JohnsonEditorAmanda BeddingfieldPractice ManagersAdam BrinegarSari WildeProject ManagerJessie KnightConsultantCaroline RothSenior Research AnalystsChristopher CattieLaura-Katherine KleinResearch AnalystsDerek BekebredeBethany HorstmannHRFR3701715SYNConfidentiality and Intellectual PropertyLegal CaveatThese materials have been prepared by The Corporate ExecutiveBoard Company (CEB) and its affiliates for the exclusive andindividual use of our member companies. These materials containvaluable confidential and proprietary information belonging toCEB, and they may not be shared with any third party (includingindependent contractors and consultants) without the priorapproval of CEB. CEB retains any and all intellectual property rightsin these materials and requires retention of the copyright mark onall pages reproduced.CEB is not able to guarantee the accuracy of the information oranalysis contained in these materials. Furthermore, CEB is notengaged in rendering legal, accounting, or any other professionalservices. CEB specifically disclaims liability for any damages, claims,or losses that may arise from a) any errors or omissions in thesematerials, whether caused by CEB or its sources, or b) reliance uponany recommendation made by CEB.
TABLE OF CONTENTSADVISORS TO OUR WORK ivINTRODUCTION: CREATING ENTERPRISE LEADERS 1CHAPTER I: SHIFT MIND-SETS TO ADAPT TO LACK OF CONTROL 27 Experienced Leaders Challenge 32Change leader mind-sets about their responsibilities by challenging assumptions about their roles.CHAPTER II: INCREASE TRANSPARENCY TO ADDRESS INSUFFICIENT INFORMATION 43 Leadership Capability Clouds 50Optimize capabilities across leadership teams, rather than trying to perfect individual capability. Portfolio Reviews 59Equip teams to self-identify Enterprise Contribution opportunities, rather than just cascading them down.CHAPTER III: REDESIGN EVALUATIONS TO REDUCE REWARDS RISK 72 Network Performance Points 77Quantify Enterprise Leadership to make outcomes tangible. Horizontal Goal Cascade 78Personalize objectives to connect contributions with business goals. Span of Influence Mapping 79Clarify the connection between leader contributions and pay. Cross-Divisional Partnership Review 80Asses leaders’ ability to work on shared outcomes with peers and teams.APPENDIX 93HRFR3701715SYN
ADVISORS TO OUR WORKAIB GroupAirservices AustraliaAlberta Public ServiceAlly Financial, Inc.Armstrong World IndustriesAsciano GroupAssurant, Inc.AurizonAvande, Inc.Avery Dennison CorporationAvnet, Inc.Bayer AGBG Group plcBlack Hills CorporationBombardier Inc.Carpenter Technology CorporationChemtura CorporationCIENA CorporationCisco SystemsCitigroup Inc.The Clorox CompanyCoats plcCoeur Mining, Inc.Coles Group LimitedCompass Minerals International, Inc.Cofra Holding AGCoty, Inc.Crombie Real Estate Investment TrustDaymon Worldwide, Inc.DBS BankDepartment of the TreasuryDeutsche Post DHLHRFR3701715SYNThe Dow Chemical CompanyEmirates GroupEndress Hauser Holding AGEthos InternationalEuropean Broadcasting UnionExelon CorporationGeneral Electric CompanyGeneral Mills, Inc.GlaxoSmithKline plcGoodman Manufacturing Company, L.P.Gordon Food Service, Inc.HCL TechnologiesThe Hershey CompanyHoneywell International Inc.Huntington Bancshares, Inc.IDEOInternational Flavors & Fragrances, Inc.Intuit, Inc.Jebsen & Co Ltd.John Swire & Sons LimitedG.N. Johnston Equipment Co. LtdKiewit CorporationLafarge S.A.Learning Development CentreLego System A/SLeidos, Inc.Lenovo Group LimitedLion Pty Ltd.Macy’s, Inc.Manulife Financial CorporationMcCarthy Holdings, Inc.Metro, Inc.MphasisMubadala Development CompanyNational Bank of KuwaitNeuroLeadership InstituteThe Nielsen CompanyNorsk Hydro ASANorthern PowergridNufarm LimitedOGE Energy Corp.OmnicareOntario Teachers PensionOppenheimerFunds, Inc.Pariveda Solutions Inc.Parsons CorporationRBC Financial GroupSchibsted ASASENWES LtdSerco Group PlcStatoilSteelcase Inc.TIAA-CREFTime Inc.The Travelers Companies, Inc.Trina Solar LimitedUniversity of CaliforniaWestfield CorporationWestinghouse Electric CompanyWorthington Industries, Inc.iv
CreatingEnterprise Leaders 2015 CEB. All rights reserved. HRFR3701715SYN1
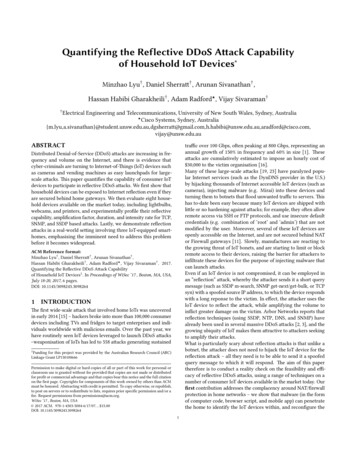
LEADERSHIP IN TRANSITIONOrganizations Do Not Have the Right Leadersfor the FutureHR Leaders Would Replace Members of TheirSenior Leadership Team If Given the OpportunityPercentage of Business Units with Leaders Who AreEquipped to Handle the Organization’s Future Needs,According to ManagersPercentage of HR Leaders 20PercentagePoint Increase40%These anticipated gaps arenot simply due to perceivedunderperformance today; rather,they stem from the belief thatcurrent leader performance isnot what will be required in thefuture.27%of Business UnitsPercentage of HR LeadersFew organizations have theleaders they will need. In fact,less than 30% of business unitshave leaders equipped to meetthe organization’s future needs.In addition, the percentageof HR leaders who wouldreplace members of their seniorleadership team if given theopportunity has increased tonearly 33%.32%20%12%0%n 203 business units.Source: CEB 2013 Succession Management Survey.20032013(n 144HR leaders.)(n 329HR leaders.)Source: CEB 2013 Succession Management Survey.“The world is faster, more interconnected; I’m worriedour leaders don’t know how to lead in that environment.”Head of HRManufacturing Organization 2015 CEB. All rights reserved. HRFR3701715SYNIntroduction: Creating Enterprise Leaders2
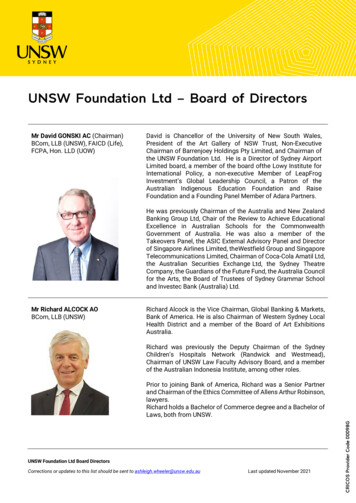
The gap between currentleadership and future needsexists not because of insufficientleader capabilities, but ratherbecause the environment in whichthey must perform is shifting.Leaders’ average effectivenessat key competencies such asproblem solving, agility, andcollaboration has remainedrelatively unchanged over thepast three years. However, as thequotations on this page indicate,leaders today face greatercomplexity in their roles as well astheir relationships with peers andteams.LEADERS’ ABILITIES HAVE NOT CHANGED,BUT THE LEADERSHIP ENVIRONMENT HASLeaders Equally Effective at Competencies TodayChanges in Leadership EnvironmentLeaders’ Effectiveness at Key Competencies, 2007–201370%67%61%“Work is 24/7 now.”Vice PresidentPharmaceutical Organization35%“I don’t know how to use halfof the technology my staff uses.”General ManagerConstruction Organization0%20072013n 1,618 (2007); 333 (2013).Source: CEB 2007 Talent Management Effectiveness Survey;CEB 2013 Leadership Development Survey.“Every day I have to influencesomeone I’ve never met before.”100%81%Senior DirectorTechnology bInioatvno“The new opportunities for growth inour organization can’t really be foundwithin one unit.you have to look atthe intersection of your work with thatof other leaders across the company.”Associate Vice PresidentFinancial Services OrganizationSource: CEB analysis.n 333.Source: CEB 2013 Leadership Development Survey. 2015 CEB. All rights reserved. HRFR3701715SYNIntroduction: Creating Enterprise Leaders3
A few changes in the workenvironment are expandingcomplexity in leaders’interactions with peers: First, an increase in the numberof stakeholders leaders mustconsult creates new potentialbarriers to decision making.THE NEW LEADERSHIP ENVIRONMENT INCREASESTHE COMPLEXITY OF PEER INTERACTIONSMore Stakeholders to ConsultShifting Job RequirementsPercentage of Leaders Who Agree That the Numberof Individuals They Must Consult or Obtain Approvalfrom to Make a Decision Has IncreasedPercentage of Leaders Who AgreeIncreasing numbers anddiversity of job responsibilitiesforce leaders to rely more onthe expertise of others to gettheir jobs done.In addition, increasing businessportfolio complexity throughglobal M&A deals meansleaders are increasinglycollaborating with new andunfamiliar peers.100%85%80%50%61%Agree0%Increase inDiversity of JobResponsibilitiesIncrease inNumber of JobResponsibilitiesn 908.n 3,409.Source: CEB 2014 Enterprise Leadership Survey.Source: CEB 2013 Succession Management Survey.Implication: More Potential Barriers to Decision MakingLeaders need to consult and build consensus with moreof their peers to make decisions.Implication: Leaders Must Increasingly Rely on theExpertise of OthersLeaders’ scope of responsibility is too large for them to beexperts in all requirements, forcing them to rely more onothers for expertise.Greater Business Portfolio ComplexityGlobal M&A Deal Size, USD Billion 3,000Jan.–JuneJuly–Dec. 1,500 0 1,024 1,00520122013 1,5712014Source: Mergermarket, “Mergermarket H1 2014 Trend Report,” July ables.pdf.Implication: Leaders Must Collaborate with Unfamiliar PeersLeaders must work with new colleagues throughout anincreasingly complex organization. 2015 CEB. All rights reserved. HRFR3701715SYNIntroduction: Creating Enterprise Leaders4
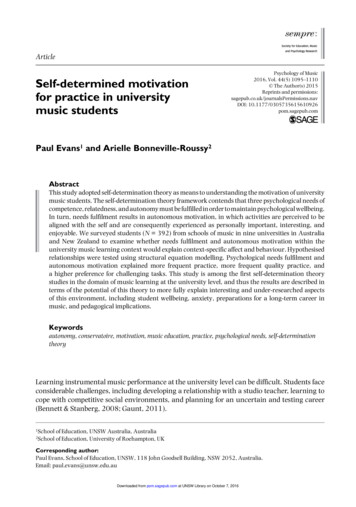
Leaders also face increasingcomplexity in their teaminteractions: Geographic dispersion reducesleaders’ visibility into theirteams’ day-to-day work.Widening spans of controlrequire teams to be moreautonomous and perform withless direct leader input.Finally, less time spent withleaders means that teamsmust have a stronger networkof support beyond theirdirect leader to perform mosteffectively.THE NEW LEADERSHIP ENVIRONMENT COMPLICATESLEADER–TEAM DYNAMICSGeographic Dispersion of TeamsWidening Spans of ControlPercentage of Leaders Who Report an Increase inTime Spent Working with Direct Reports in DifferentLocations in the Past Three YearsMedian Number of Direct Reports per Leader658%Agree64Leaders have50% moredirect reportstoday thansix years ago.3020082014n 10,516 (2008); 908 (2014).Source: CEB 2008 Talent Management Effectiveness Survey;CEB 2014 Enterprise Leadership Survey.n 908.Source: CEB 2014 Enterprise Leadership Survey.Implication: Leaders Lack Visibility into Teams’Day-to-Day WorkLeaders must find new ways to stay informed aboutemployees’ work as it becomes less visible to them.Implication: Teams Must Be More AutonomousAs spans of control widen and leaders have less time todevote to members of their teams, teams must execute ontheir objectives without constant leader input.Less Time with TeamNumber of Hours per Week Employees Spend withTheir Direct Leader66Leaders spend half the time with directreports today than they did two years ago.33020122014n 23,339 (2012); 908 (2014).Source: C EB 2012 Enterprise Contribution Survey;CEB 2014 Enterprise Leadership Survey.Implication: Management Is More Social NowLeaders must focus on building a team culture that enablesstaff to seek guidance, support, and development from eachother, rather than their leader. 2015 CEB. All rights reserved. HRFR3701715SYNIntroduction: Creating Enterprise Leaders5
Amidst increasing complexity,leaders struggle to influenceenterprise outcomes. In fact, only13% of HR heads believe leadersare effective at supporting peers’performance. Even fewer headsof HR believe leaders effectivelysupport cross-team collaboration.LEADERS STRUGGLE TO SUPPORT BROADERENTERPRISE OUTCOMESLeaders Unsupportive of Peer PerformanceMost Leaders Lack Organization-WidePerspective13%Underpinning these challengesis a lack of organization-wideperspective. In fact, only 38% ofheads of HR believe that leadersconsider organization-wide needswhen making key decisions.38%of heads of HR rate theirleaders as effective atsupporting the performanceof other leaders.of heads of HR believe leadersconsider organization-wideneeds when making decisions.n 197.n 197.Source: CEB 2014 Enterprise Leadership Head of HR Survey.Source: CEB 2014 Enterprise Leadership Head of HR Survey.Leaders Fail to Drive Cross-Team Collaboration10%of heads of HR rate theirleaders as effective at creatingconditions that facilitate crossteam collaboration.n 197.“Right now our leaders aren’t willing to thinkoutside their own business units and it’shurting our performance. We have to getleaders thinking about how to have an impacton the broader organization.”DirectorGlobal Leadership DevelopmentLogistics OrganizationSource: CEB 2014 Enterprise Leadership Head of HR Survey. 2015 CEB. All rights reserved. HRFR3701715SYNIntroduction: Creating Enterprise Leaders6
A JOURNEY TO A NEW MODEL OF LEADERSHIPCEB CorporateLeadership CouncilThe Global LeaderA Sample of Leadership Literature from the Past 100 YearsLeadership Questions Today What model of leadership improves enterprise outcomes in the newleadership environment?How do we create more leaders that fit this model?Prevalence of the Word “Leadership” in English Language BooksZaccaro, Foti, & KennySelf-Monitoring andTrait-Based Variancein LeadershipStogdillLeadership, Membershipand OrganizationOrganizations needto identify andarticulatea long-term strategicvision for leadership.Top leaders are morelikely to change theirstyle depending on theirtasks.FiedlerEngineer the Jobto Fit the ManagerHerseyThe Situational LeaderDifferent situationscall for differentleadership styles.Leaders are mostsuccessful when theycan reduce friction andencourage cooperation.BassLeadership andPerformance BeyondExpectationsUlrich, Smalwood,& SweetmanThe Leadership CodeOrganizations needto create a sustainableprocess for buildingleaders.Rath & ConchieStrengths BasedLeadershipTransformational leadershipnot only is innate, but alsocan be developed.19341944Classical Leadership Leadership through process design and controlEffectiveness determined by innate traitsKey Intervention: Select leaders with critical innate traits.1954196419741984 Leadership through motivating the performance of peopleEffectiveness determined by transaction management andsituational contextKey Intervention: Develop leaders to manage transactionalrelationships with employees and adapt to different situations.The most effectiveleaders invest in theiremployees’ strengths,maximize their team,and understand theirfollower’s needs.199420042014Transformational LeadershipHumanistic Leadership Leadership pipelinesare critical for definingleader expectations atall levels.Leaders fail to applytheir skills effectivelydue to organizationaland situationalbarriers.MunsonThe Managementof Men1924Charan, Drotter,& NoelThe LeadershipPipelineCEB CorporateLeadership CouncilManaging LeadershipPerformance RisksTeam performancedepends on leader styleand business situation.Leaders use influence toenable groups to achievetheir goals.1914Great global leadersaspire to higherleadership positions,have strong influenceskills, and areenabled by marketand organizationalinformation.CEB CorporateLeadership Council The LeadershipImperative Enterprise LeadershipLeadership through managing complex systemsEffectiveness determined by individual ability to drive changeKey Intervention: Develop leaders to role model critical behaviors,inspire performance, and drive change.Source: J ean-Baptiste Michel, Yuan Kui Shen, Aviva Presser Aiden, Adrian Veres, Matthew K. Gray, William Brockman, The Google Books Team, Joseph P. Pickett, Dale Hoiberg, Dan Clancy, Peter Norvig, Jon Orwant, StevenPinker, Martin A. Nowak, and Erez Lieberman Aiden, “Quantitative Analysis of Culture Using Millions of Digitized Books,” Science 331 (2011): 176–182. 2015 CEB All Rights Reserved. HRFR3701715SYN 11x17Introduction: Creating Enterprise Leaders 7
We interviewed and surveyedmore than 4,000 employeesand leaders and nearly 200heads of HR at over 300organizations worldwide.A GLOBAL STUDYPartial List of Participating Organizations 2015 CEB. All rights reserved. HRFR3701715SYNIntroduction: Creating Enterprise Leaders8
We conducted threedistinct surveys: an 180-degreeleader performance assessment,a leader network analysis, and ahead of HR assessment coveringleadership challenges andinitiatives.LEADERSHIP SURVEY METHODOLOGYSurvey ParticipantsCategories Assessed 908Leaders 180-DegreeAssessment 551Frontline Manager NetworkAnalysis362Direct Reportsof LeadersLeaderConnections 197Heads of HR IndividualIndividual ContributorsContributor Role responsibilitiesCareer challengesNetwork interactionsManagement and leadershipof teamLeader performanceDerailing leader behaviorsPerformance of leader’s teamPressures for organizational changeFunctional and organizational strategyLeader performanceTeam performance (self-assessment)Team climateUsing data provided by 423 leaders, we created a network map thatmeasured the connections between the leaders and those they closely workwith. We used the network to measure how average leaders and EnterpriseLeaders interact with and benefit from one another. Head of HRAssessmentWe definea leader as anemployee atSeniorthe directorLeaderlevel or abovewho is amanager ofMid-Level Leadermanagers. 3,243Defining a LeaderManagersof Leaders Team performancePersonality (self-assessment)Barriers to performancePressures for organizational changePast experiencesLeader performanceBusiness environment in which organization operatesLeader success profilesLeader skill gapsBarriers to leader performanceObjectives and impact of leader initiativesLeadership investmentsOrganizational climateSource: CEB analysis. 2015 CEB. All rights reserved. HRFR3701715SYNIntroduction: Creating Enterprise Leaders9
Our survey participantsrepresent a wide variety ofindustries worldwide.The graphs on the left side ofthis page show the geographicand industry breakdowns ofparticipants in the leadershipsurvey, and the graphs onthe right show the samebreakdowns for the head offunction survey.LEADERSHIP SURVEY DEMOGRAPHICSLeadership SurveyHead of Function SurveyParticipants by RegionParticipants by Region23%Australia andNew Zealand15%Australia andNew pe, MiddleEast, and e, MiddleEast, and African 908 leaders; 3,243 direct reports.n 197.Source: CEB 2014 Enterprise Leadership Survey.Source: CEB 2014 Enterprise Leadership Head of Function Survey.Note: Total does not equal 100% due to rounding.Leadership SurveyHead of Function SurveyParticipants by IndustryParticipants by ail5%Real Estate7%Professional Services14%Government/NonprofitPlease see the Appendixfor additional demographicinformation.n 908 leaders; 3,243 direct reports.Source: CEB 2014 Enterprise Leadership nology8%Telecommunications6%Consumer Goods8%Government/Nonprofit5%Health y6%Retail7%Oil and Gas21%ProfessionalServicesn 197.Source: CEB 2014 Enterprise Leadership Head of Function Survey.Note: Total does not equal 100% due to rounding. 2015 CEB. All rights reserved. HRFR3701715SYNIntroduction: Creating Enterprise Leaders10
The predominant leadershipapproach today is individualleadership. Individual leaderssupport the broader enterpriseby singularly focusing on theirindividual goals and businessunits. They provide specificdirection and cascade theresources and information theirteams need to achieve individualgoals.Most leaders are very effectiveat individual leadership. As thedata on the right shows, 82%of their leaders are meeting orexceeding their performanceobjectives.MOST LEADERS CONTRIBUTE TO THE ENTERPRISEBY FOCUSING ON THEIR INDIVIDUAL BUSINESS UNITIndividual Leadership:Individual leaders are highly effective at achieving their ownbusiness unit objectives and helping their teams completetheir individual objectives.Result:Leaders achieve businessunit objectives.“I relentlessly prioritize what’s best for my team. The82%organization is better for that. I don’t get sucked into thewrong things.”Senior DirectorProfessional Services Organizationof leaders aremeeting or exceeding theirperformance objectives,according to heads of HR.“Our leaders are hitting thegoals we’ve been putting infront of them. The problemis that we’re not seeing asmuch of an impact on ourDirection Resources Informationcompany-wide numbers aswe would have expected.”Chief Executive OfficerTelecommunicationsOrganizationSource: CEB analysis.n 197.Source: CEB 2014 Enterprise Leadership Headof Function Survey. 2015 CEB. All rights reserved. HRFR3701715SYNIntroduction: Creating Enterprise Leaders11
However, as the quotes onthe right illustrate, today’scomplex and interconnectedenvironment requires a differentleadership approach to driveorganization-wide success.INDIVIDUAL LEADERSHIP IS NOT ENOUGH IN A MOREINTERCONNECTED ORGANIZATIONLeaders’ Impact on RevenueMean to Maximum Impact of Individual Leadershipon Business Unit Revenue a6%Maximum Impact on Business Unit Financial OutcomesAlthough individual leadershiphas a positive effect onbusiness unit performance,it is not enough to sustainorganizational performancein today’s environment. Thestrongest individual leadersachieve 4% higher business unitrevenue growth and 3% higherbusiness unit profit growth thanaverage individual leaders.The strongest individual leadersachieve 4% higher business unitrevenue growth and 3% higherbusiness unit profit growththan the average individualleader.4%3%3%“ We need our leaders to be thinking about howto drive the organization’s top- and bottomline numbers, not just their own business unit’s.”Head of HRHospitality Organization“ Leaders at all levels need to be thinking aboutthe enterprise now. It’s no longer just the most”senior leaders.Head of HROil and Gas Organization0%Impact onBusiness UnitRevenue GrowthImpact onBusiness UnitProfit Growthn 908.Source: CEB 2014 Enterprise Leadership Survey.“ We used to think of leadership as vertical.It’s more horizontal now.”Head of HRRetail OrganizationNote: Individual leadership is measured by the extent to which a leader achieves hisor her own business unit objectives and the extent to which his or her teamachieves its individual objectives.aThe impact on financial outcomes is calculated by comparing two statisticalestimates: the predicted impact when a leader scores relatively high on a driverand the predicted value when a leader scores the average score on a driver.The effects of all drivers are modeled separately, using a variety of multivariateregressions with controls. 2015 CEB. All rights reserved. HRFR3701715SYNIntroduction: Creating Enterprise Leaders12
The best leaders today areEnterprise Leaders: they leadtheir teams to high performance,and contribute to and leverageother teams’ performance.To test this model of leadership,we evaluated leaders againstindividual leadership and networkleadership. To measure individualleadership, we asked managers toasses leaders’ ability to achievebusiness unit objectives. Wealso asked leaders to assesstheir teams’ abilities to achieveindividual tasks and assignments.To measure network leadership,we asked managers to assessleaders’ abilities to contributeto enterprise-wide objectives.We asked leaders to assess theirteams’ abilities to contribute toand leverage peers throughoutthe organization. Sampleoutcomes assessed include: CEB’S ENTERPRISE LEADERSHIP MODELEnterprise Leadership seLeadershipEnterpriseOutcomesA leader’seffectivenessat meetingindividualobjectives andleading his orher team tohigh individualperformanceA leader’seffectiveness atcontributing toand leveragingthe performanceof other unitsor teams, andleading his or herteam to do thesameA leader’seffectiveness atmeeting his or herindividual objectives,contributing toand leveraging theperformance of otherunits or teams, andleading his or herteam to do the sameRevenue and profitfor his or her businessunit and otherbusiness unitsor teams Source: CEB analysis.Effectively transferring workingmethods, techniques, tools,ideas, skills, and knowledgefrom other parts of theorganization; andImporting ideas from personaland professional networksoutside the organization.Please see the Appendix forthe full list of questions used toassess Enterprise Leadership. 2015 CEB. All rights reserved. HRFR3701715SYNIntroduction: Creating Enterprise Leaders13
Enterprise Leaders improveteam outcomes more thanindividual leaders. This pageillustrates four key areas wherewe found Enterprise Leaders’teams outperforming teams ledby individual leaders. ENTERPRISE LEADERS IMPROVE TEAM OUTCOMESMore Innovative TeamsMore Adaptable TeamsPercentage of Teams Achieving a High Levelof InnovationPercentage of Teams Effective at GeneratingSolutions to New or Unanticipated ProblemsInnovation: Enterprise Leaders’teams are 68% more innovativethan individual leaders’ teams.Adaptability: EnterpriseLeaders’ teams are 21% moreadaptable than individualleaders’ teams.87%57%34%Engagement: Growth inEnterprise Leaders’ teams’engagement increases 35%more each year than that ofindividual leaders’ teams.Customer Satisfaction: Growthin Enterprise Leaders’ teams’customer satisfaction scoresincrease 20% more each yearthan those of individual leaders’teams. 15PercentagePoint Increase 23PercentagePoint Increaseof IndividualLeaders’Teams72%of EnterpriseLeaders’Teamsof IndividualLeaders’Teamsof EnterpriseLeaders’Teamsn 908 leaders; 3,243 direct reports.n 908 leaders; 3,243 direct reports.Source: CEB 2014 Enterprise Leadership Survey.Source: CEB 2014 Enterprise Leadership Survey.Higher Employee Engagement aHigher Customer Satisfaction aLeader’s Maximum Impact on One-Year Changein Team’s Employee EngagementLeader’s Maximum Impact on One-Year Changein Team’s Customer seLeaderIndividualLeaderEnterpriseLeadern 908 leaders; 3,243 direct reports.n 908 leaders; 3,243 direct reports.Source: CEB 2014 Enterprise Leadership Survey.Source: CEB 2014 Enterprise Leadership Survey.aThe impact on employee engagement is calculated by comparing two statisticalestimates: the predicted impact when a leader scores relatively high onEnterprise Leadership and the predicted value when a leader scores relatively lowon Enterprise Leadership. The effect of Enterprise Leadership is modeled using amultivariate regression with controls.aThe impact on customer satisfaction is calculated by comparing two statisticalestimates: the predicted impact when a leader scores relatively high onEnterprise Leadership and the predicted value when a leader scores relatively lowon Enterprise Leadership. The effect of Enterprise Leadership is modeled using amultivariate regression with controls. 2015 CEB. All rights reserved. HRFR3701715SYNIntroduction: Creating Enterprise Leaders14
Impact on Business Unit NetProfit GrowthEnterprise Leaders also improvetheir own business unit netprofit growth by 10% and otherbusiness units’ net profit growthby 4%.Please see the Appendix formore details.ENTERPRISE LEADERS IMPROVE THEIR OWN ANDOTHERS’ BUSINESS UNIT FINANCIAL OUTCOMESMaximum Impact on Business Unit Revenue Growth aEnterprise Leadership Impacton Own Business Unit12%Enterprise Leadership Impacton Other Business Units5%12%Maximum Impact on Business Unit Revenue GrowthAn individual leader can achieve a4% improvement in business unitrevenue growth. The bar on thefar left shows that impact. Themiddle bar shows the additional3% impact an Enterprise Leadercan achieve for his or herindividual business unit throughNetwork Leadership. Finally,an Enterprise Leader can haveup to a 5% spillover effect onthe revenue growth of all otherbusiness units in the organizationby contributing to other leaders.Those other leaders can, inturn, collectively improve thefirst leader’s revenue growth by5% (dotted bar). Overall, eachbusiness unit can achieve up to a12% increase in revenue growth ifall leaders in the organization areEnterprise Leaders.5%Impact fromEnterpriseLeaders inOtherBusinessUnits6%3%5%Implication: An EnterpriseLeader creates a spillovereffect on other businessunits.The benefit to their ownbusiness unit that leadersachieve through adershipSpillover onOther BusinessUnitsn 908 leaders; 362 connections.Source: CEB 2014 Enterprise Leadership Network Analysis.aTo assess the spillover effect of Enterprise Leadership, we created a dataset of leader-to-leader connections. Leaders were asked to indicatethe names of leaders (i.e., a set of peers) with whom they frequently collaborated. An average Enterprise Leadership score was calculatedfor each leader’s set of peers, which was used to assess peers’ effect on the leader’s business unit. 2015 CEB. All rights reserved. HRFR3701715SYNIntroduction: Creating Enterprise Leaders15
What does EnterpriseLeadership really look like dayto day, and how does it differfrom individual leadership?There are three key differencesin the way Enterprise Leaderslead that distinguish them fromindividual leaders:1. They take input from and giveinput to their peers.THREE KEY SHIFTS IN HOW ENTERPRISE LEADERS LEADSHIFT 1Take—and Give—with PeersIndividual leaders use peercontributions to improve theirbusiness unit. Enterprise Leadersuse and provide contributionsto improve the broader enterprise.Enterprise Leaders are1.5x more effectiveat evenly giving and takingthan individual leaders. a2. They push information to andpull value from their teams.3. They facilitate teamperformance, rather thandirecting it.SHIFT 2Push—and Pull—TeamContributionsIndividual leaders delegate workto their team. Enterprise Leadersdelegate work and ensureteam contributions receive theresources and visibility neededfor success.Enterprise Leaders are1.2x more likelyto pull contributions from theirteam than individual leaders.bSHIFT 3Facilitate—Don’t
Source: CEB 2008 Talent Management Effectiveness Survey; CEB 2014 Enterprise Leadership Survey. 2008 2014 0 3 6 6 3 n 908. Source: CEB 2014 Enterprise Leadership Survey. 58% Agree Less Time with Team Number of Hours per Week Employees Spend with Their Direct Leader 2012 2014 Leaders spend half the time with direct reports today than they did .