Transcription
Water Availability and Assessment ReportAppendix C to the 2020 EQB Water Plan09/15/2020
Minnesota Department of Natural Resources500 Lafayette Road St. PaulSt. Paul, MN 55155-4025(651) 296-6157Email: info.dnr@state.mn.uswww.dnr.mn.usAs requested by Minnesota Statute 3.197: This report cost approximately 75,500 to prepare in staff time.
Report ContributorsEditorsPooja Kanwar, Water Policy ConsultantEllen Considine, Hydrologist SupervisorBrian Stenquist, Communications and Planning SupervisorJason Moeckel, Inventory and Monitoring Analysis Section ManagerSubject-matter ExpertsKenny Blumenfeld, Senior ClimatologistIan Chisholm, River Ecology SupervisorJay Frischman, Hydrogeologist SupervisorTom Hovey, Water Regulations SupervisorSean Hunt, Water Use Information AnalystSteve Kloiber, Lake Ecology SupervisorJoy Loughry, Water Monitoring and Surveys SupervisorDan Miller, Water Use ConsultantZachary Moore, HydrologistCarmelita Nelson, Water Conservation ConsultantDan O’Shea, River Ecology ScientistPaul Putzier, Hydrologist SupervisorPaul Radomski, Research ScientistJen Sorenson, Public Waters HydrologistData visualizations and graphicsRosalyn Krog, HydrogeologistAccessibility and designRuth MacDonald, Information OfficerThe Clean Water Fund supported the data collection and analysis efforts described in this report.Water Availability and Assessment Report3
Table of ContentsIntroduction. 5Section I: Assessment and Availability of Minnesota’s Waters . 6Climate Trends and Projections . 6Water Use Trends.10Status of Minnesota’s Streams .12Status of Minnesota’s Lakes .17Status of Minnesota’s Wetlands .18Status of Minnesota’s Groundwater.20Section II: The DNR’s Role in Supporting Water Use . 23Implementation of Minnesota’s water laws.23Engagement with water users .25Water resources science in decision making .26Conclusion . 31References. 32Table of FiguresFigure 1. Plot of annual temperature and precipitation in Minnesota . 7Figure 2. Annual precipitation increase since the 20th century . 8Figure 3. Temperature Change by Region . 9Figure 4. Reported water use by category of use . 10Figure 5. Reported water use by category of use, for non-power generation uses . 11Figure 6. Residential gallons per capital per day of water supply use in 2018 . 11Figure 7. Overall stream flow data compared to historic records. 13Figure 8. Mean annual flow on the Le Sueur River compared to precipitation . 15Figure 9. Mean annual flow on the Mississippi River compared to precipitation . 15Figure 10. Mean annual flow on the Buffalo River compared to precipitation . 16Figure 11. Mean annual streamflow on the Rainy River compared to precipitation . 16Figure 12. Departure from annual median water levels in 570 lakes . 17Figure 13. Wetland gains and losses from 2006 - 2017. 19Figure 14. Water level trends in DNR observation wells, 2000 - 2019 . 21Water Availability and Assessment Report4
IntroductionMinnesota’s water resources are part of the very identity of our state: the land of 10,000 lakes. Our waterresources provide habitat, recreational opportunity, drinking water supply and economic vitality. Theseresources are valued by Minnesotans and are part of our way of life.This report is an exploration of water in relation to Minnesota’s economy, communities, landscapes, andatmosphere. The report will describe how individuals, businesses and communities have been using water.The report will present data and information on the amount of water present and flowing throughMinnesota over the recent past. The report will also present information on the Minnesota Department ofNatural Resources’ (DNR’s) efforts to ensure the sustainable use of water in Minnesota.The data and information on water resources in this report lead us to the following conclusions:1. Climate: Minnesota’s climate is changing. Our rainfall events are heavier and more intense and ourwinters are warmer. This trend fits with climate forecasts, which predict overall warmer and wetterconditions and more extreme weather such as damaging, intense rains. Although we are now in awet cycle, droughts will return, and climate change models predict they will be longer and moresevere than before.2. Water Use: The total volume of water used has decreased over the last ten years, most notably inthe energy sector due to the reduction of water use in power plants.3. Streams: Streamflows have been high around the state, reflecting increased precipitation.4. Lakes: Lake levels have been generally higher around the state, also reflecting increasedprecipitation.5. Wetlands: There has been a slight increase in the acreage of wetlands around the state, and somewetlands are shifting toward wetter types. This is likely due to wetland restoration policies andprograms, and increased precipitation.6. Groundwater: Groundwater levels have been generally high around the state, although some localeswill continue to have limited groundwater availability. Groundwater is limited in some placesbecause the aquifers are poorly producing. In other areas, the aquifers recharge slowly and may notkeep pace with the rate of use.7. Programs: Sustainable water use continues to be supported through DNR programs by engagingwith water users to support their water supply planning and water conservation efforts, collectingand using water resource and ecosystem data, and effectively applying Minnesota’s water laws.Water Availability and Assessment Report5
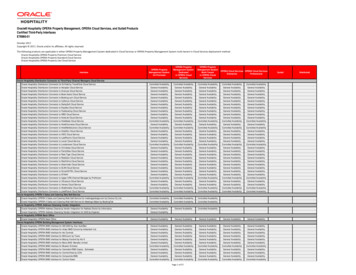
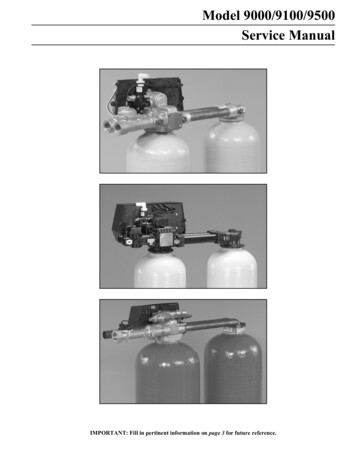
Section I: Assessment and Availability of Minnesota’s WatersWater availability in this report is described in terms of the elements we see on the landscape: climate andprecipitation, streams, lakes, wetlands, and groundwater, and how we use water. Precipitation either soaksinto the ground or runs off into lakes, rivers, and wetlands. Much of the water that soaks into the ground isstored in soil to be taken up by plants. Evaporation from plants and from the land and water surfacesreturns moisture to the atmosphere, which perpetuates the hydrologic cycle. Each of these components isinfluenced to some degree by human actions at or near the land surface. Streamflow, storage in wetlands,and groundwater use can be controlled by human actions; however, natural variability of other componentssuch as drought, flood, and geographic distribution of aquifers cannot be controlled. This variability presentschallenges for the long-term sustainability of both human and ecological water needs. The followingsections describe Minnesota’s water availability from 2015 – 2019 through the trends of our climate, surfacewaters, groundwater systems and water use.Climate Trends and ProjectionsMinnesotans are accustomed to cold and snowy winters, along with warm and humid summers, but alsoknow that any season can be far warmer, colder, wetter or drier than normal. The high variability that weexpect from Minnesota’s climate can make it difficult to notice where, when, and how climatic conditionshave changed in our state. However, over 125 years of consistent climate data make it clear thatwidespread changes, outside the range of normal variations, are already underway in Minnesota.Indeed, Minnesota’s climate is changing rapidly, and more changes are coming. In the past several decades,our state has seen increased rainfall, heavier downpours, and substantial warming, especially during winterand at night. These changes have already affected not just our water resources, but also how we interactwith and use them. An overwhelming base of scientific evidence projects that Minnesota’s climate will seeadditional, significant changes through the end of this century, with even warmer winters and nights, andeven larger rainfalls—along with the likelihood of increased summer heat and the potential for longer dryspells. Planning for the future of Minnesota’s water must include a thorough appraisal of the effects ourchanging climate will have on this vital resource.Wetter and warmer conditionsMinnesota has experienced much wetter and warmer weather in the past several decades. All but two yearssince 1970 have been some combination of wetter and/or warmer than historic averages. Compared to20th century averages, all of the ten wettest and warmest years on record occurred after 1998 (Figure 1).Just last year, 2019, was the wettest year on record in Minnesota.Water Availability and Assessment Report6
Figure 1. Plot of annual temperature and precipitation in MinnesotaAlthough the climate will vary from year to year, with occasional cool or dry years, climate scientists expectthese increases to continue through the 21st century.Unprecedented precipitationMinnesota’s climate swings naturally from relatively dry to relatively wet periods, but the wet conditionshave dominated recent decades. Years with precipitation above historical averages have becomeincreasingly frequent, and departures from those averages have grown as well, leading to sustainedprecipitation surpluses never before documented in the state (Figure 1, Figure 2).Water Availability and Assessment Report7
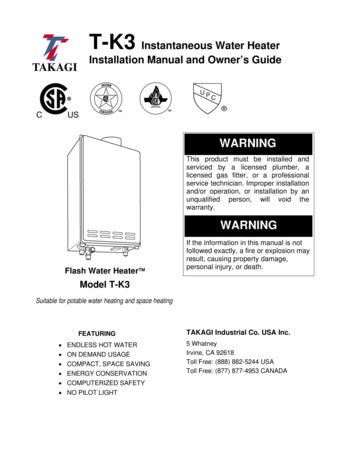
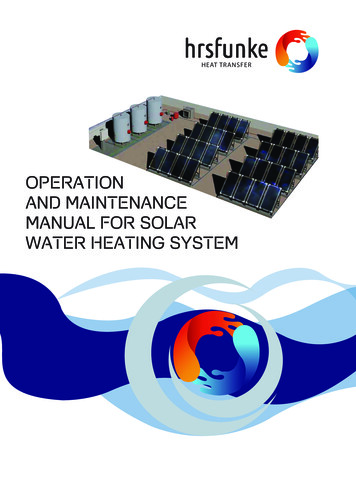
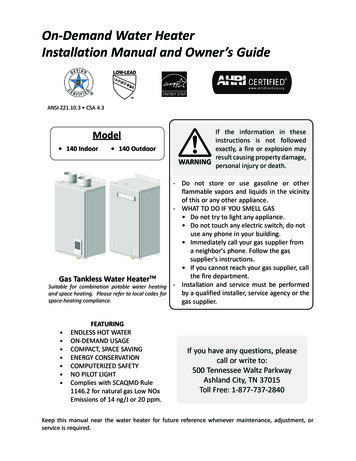
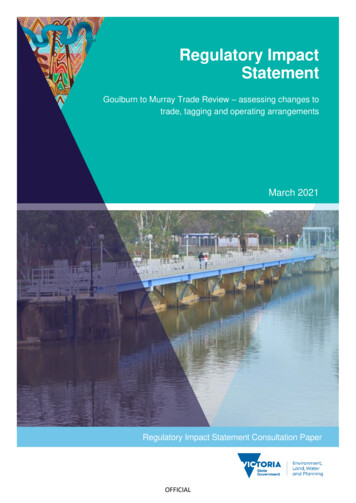
Figure 2. Annual precipitation increase since the 20 th centuryModified map from DNR Watershed Health Assessment Framework.June of 2014 was Minnesota’s wettest month on record, with widespread severe flooding in many areas. In2016, the town of Waseca broke Minnesota’s annual precipitation record, only to have that record brokenby both Harmony and Caledonia in 2018. During 2019, more precipitation fell across the state than anyother year on record back to 1895, and the 2010s finished as Minnesota’s wettest decade, by a wide margin.The precipitation increases have been most pronounced in southern Minnesota (Figure 2).More damaging rainsMinnesota now sees more heavy precipitation than at any other time on record. At climate stations withover 100 years of observation, daily precipitation totals of 1, 2, and 3 inches have increased an average of21%, 31%, and 62%, respectively. Measurements of the annual heaviest rainfall now average 20% greaterthan historical readings across the state. In August 2007, a catastrophic rainfall in southeastern Minnesotaproduced 15.1 inches of rainfall in just 24 hours in the town of Hokah. This is 39% more rainfall than everhad been recorded at any station in the state. Seasonal snowfall has been running near historical high marksalso; in the 2010s, stations all over the state broke records for heavy snowfall.Warmer but not hotter, yetMinnesota is warming quickly but mostly during nights and winter. Annual temperatures have climbed 2.9degrees since 1895, but 80% of that warming has been since 1970. During those five decades, winters havewarmed by 5 F, winter nights have warmed by 6 F, but summers have warmed by just a half a degree F,and summer daytime high temperatures have decreased slightly in southern Minnesota (Figure 3).Water Availability and Assessment Report8
Figure 3. Temperature Change by RegionNOAA, National Center for Environmental InformationWinter cold extremes have become less frequent and less severe, while the state has observed no change inthe frequency or severity of heat extremes. Climate models suggest, however, that summers will eventuallyget warmer, and that Minnesota will see increased heat extremes by the middle of this century, if notsooner.Don’t count drought outWater is a defining resource for Minnesota, central to our economy, communities, and identity; so wealways will be quite sensitive to dry conditions and drought. While Minnesota continues to experienceperiods of drought in specific regions, those periods have not increased in severity or length. Recent surgesin precipitation have meant the state has not seen any increases in drought severity, duration, or arealcoverage over the past few decades. However, the extremely wet period from the 2010s will endeventually. A shift towards a dry regime should be expected, as climate change will not eliminate wet anddry periods in Minnesota. Indeed, although climate projections depict that Minnesota will continue gettingwetter in general, those same projections indicate that future dry spells may start to get longer too,especially once our summer heat intensifies. Even with a generally wetter climate, Minnesota should expectoccasional episodes of severe drought, and these drought events could happen immediately following ormay even occur in specific areas of the state during a wet period.Water Availability and Assessment Report9
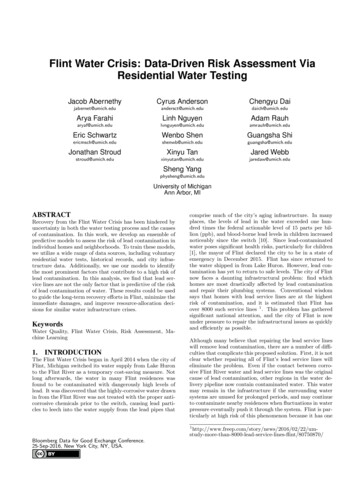
Water Use TrendsWhereas water use in Minnesota generally increased over the last decades of the 20th century, water use inthe 21st century has been declining. In total, Minnesota’s water use has decreased over the past ten yearsfrom about 1400 billion gallons in the first decade of the century to about 1060 billion gallons at the endof the second decade (Figure 4). This translates to approximately a 28% decline in water use while ourpopulation increased by approximately 7%.Figure 4. Reported water use by category of useDecreasing water use for generating electricityThe largest portion of Minnesota’s water use is from surface water for power generation. The majority ofthe decrease in the state’s water use can be attributed to a decrease in water needed for power plantcooling – a use reduction of 33% from 2005 to 2019. This reduction occurred even as the overall demand for electricity remained constant. A number of large power plants converted from coal to natural gas. Natural gas plants require lesscooling water. The share of the state’s electricity produced by coal-fired electric plants declinedfrom 53% to 31% over the period from 2011 to 2019. The amount of electrical power generated from wind and solar power has increased. These sourcesof electricity do not require cooling water. In 2019, the state’s wind farms generated 19% of thestate’s total net electricity generation. Minnesota is a national leader in energy efficiency, andrenewable energy has accounted for 84% of all new generation capacity since 2010.Water use for non-power generation also declined from 2007 through 2019 (Figure 5). This decline isattributable to adopting water saving technologies, increased industrial water reuse, and implementation ofirrigation best management practices. Additionally, recent wet years have likely contributed to the decline,as Minnesotans use less water for lawn and crop irrigation during times of ample precipitation.Water Availability and Assessment Report10
Figure 5. Reported water use by category of use, for non-power generation usesLeadership in per capita water useGallons Per Capita per DayMinnesota has been making important strides in conservation, and individuals, businesses, and communitieshave all contributed to Minnesota’s water conservation excellence. In 2018, 92% of water suppliers achievedthe DNR residential water conservation goal of using less than 75 gallons per capita daily (GPCD). Thestatewide average residential GPCD is 52 (Figure 3035404550Utility CountFigure 6. Residential gallons per capital per day (GPCD) of water supply use in 2018Water Availability and Assessment Report11
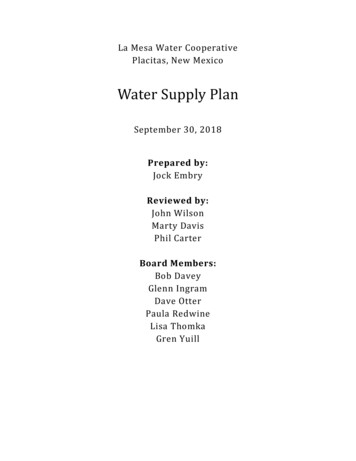
Making waves in water efficiencyMany Minnesota companies lead the way in water and energy efficiency. For example, Chippewa ValleyEthanol Company in Benson has steadily reduced the amount of water used in its production. In 2007, thecompany used 3.7 gallons of water per gallon of ethanol produced. By 2019, that figure dropped to 2.8 gallonsof water per gallon of ethanol, ahead of the industry water use benchmark. In 2019, Chippewa Valleyconstructed a water/wastewater treatment plant to treat and reuse boiler blowdown and cooling towerblowdown water that would otherwise be discharged. This will save 132,500 gal/day and help conserve thearea’s limited groundwater supply. Photo from the Chippewa Valley Ethanol Company.Status of Minnesota’s StreamsThere is a direct correlation between a wetter Minnesota and changes to streamflow across most of thestate. Compared to historical patterns, streams are now flowing higher in the spring, floods arebigger, bankfull flows last longer, and summer baseflow is increasing in some parts of the state. Climatemodels project increasingly intense, frequent floods, which are already manifested in our streams. Thesechanges from climate are compounded by land use changes. The leading land use factors are thoseassociated with a conversion to a primarily corn and soybean cropping system. As a result, drainage andtiling increase streamflows that subsequently cause stream channel erosion and instability, which degradesthe instream habitat. Larger floods increase damage to infrastructure like roads, bridges, and buildings.Streamflow in many watersheds across Minnesota has shifted over the past 20 years. Comparing flow instreams to historic records reveals that our streamflow is higher than it used to be. From water years 2000through 2009, flow in 54% of watersheds ranked as above normal or high compared to historic records.From water year 2010 through water year 2019, flow in 75% of watersheds ranked as above normal or high.Of the 81 watersheds examined from 2010 through 2019, none had below normal or low flows (Figure 7).Water Availability and Assessment Report12
Figure 7. Overall stream flow data compared to historic recordsIn some watersheds, we are seeing both an unprecedented magnitude of annual precipitation and meanannual discharge in the years after 1991 (Figure 8). Coincident with the precipitation pattern is the change inland use land cover. While climate change has resulted in consistent increases in streamflow across the US,it does not reflect the complete change in streamflow measured as mean annual discharge. Primarily in theMidwest, additional increases in streamflow has come from human activities including land practicesassociated with conversion to row crop systems and urbanization. Several studies specific to the Midwesthave examined the combined influence of climate change and land use change on streamflow. These foundthat land use change is responsible for a significant proportion of the increase, ranging from 32% to 40% toroughly equivalent with climate change.These changes are illustrated at four streams where we conducted detailed case studies of streamflowconditions. We chose the case study sites to represent the breadth of Minnesota’s variable geography: theMississippi River (near Royalton), the Le Sueur River (in the Minnesota River watershed), the Buffalo River(in the Red River watershed), and the Rainy River. Five metrics of streamflow were evaluated for eachsite: flow magnitude, seasonality, flood flows, baseflows, and bankfull flow (Appendix A, found on the DNRweb page “River Ecology Unit” under “Research”).Overall, each of the four streams is measurably wetter than in years past. Precipitation and mean annualflow have increased on all of the streams studied.On the Le Sueur River, mean annual flow has increased. This change correlates with higher precipitation.Floods are also bigger and more variable, driven by both increased precipitation and land use changes. FlowsWater Availability and Assessment Report13
are notably higher in the spring (April, May and June) than in previous years (Figure 8). Overall changes inflow on the Le Sueur River are showing impacts of climate change and land use change – specificallyincreased drainage and loss of perennial vegetation.On the Mississippi River, flood flows have increased significantly since 1940, likely a result of increasingprecipitation. Mean annual flow has increased markedly since 1940, which is also a result of increasingprecipitation (Figure 9). August baseflow has increased. The patterns of precipitation and flows by seasonmatch closely, which indicates that changes in precipitation, rather than land use, are driving changes instreamflow on the Mississippi River.On the Buffalo River, August baseflow has been consistently higher since 1990. Floods have also beenslightly larger. Like the Le Sueur River, streamflow in the spring has also increased, which is likely the resultof increased runoff from bare cropland at that time of year. Mean annual flow has increased, although thatchange preceded the increase in precipitation (Figure 10). Because the streamflow change preceded theprecipitation change, land use changes may have affected this watershed prior to climate change impacts.The data suggest that land use changes may be adding to the hydrologic alteration due to climate change.The Rainy River generally shows less change than other watersheds, but even there annual mean flow hasincreased coincident with increasing precipitation (Figure 11).These findings align with climate change models, which project increasingly intense, frequent floods. Landuse changes, including urban development and agriculture, can magnify the effects of climate change.Degraded stream channels caused by flooding make the ecosystems in our streams less diverse and lessresilient. Damage to stream ecosystems can take time to accumulate and become apparent but willeventually effect our recreational use of streams. Our agricultural economy is especially vulnerable to moreintense precipitation and larger floods. For example, climate change is resulting in significant increases inrainfall erosivity, therefore causing potential soil and nutrient loss. Additionally we are seeing an increase infrequency of higher flows responsible for flooding riparian areas potentially impacting crop production bywaterlogging.Water Availability and Assessment Report14
Figure 8. Mean annual flow on the Le Sueur River compared to precipitationFigure 9. Mean annual flow on the Mississippi River compared to precipitationWater Availability and Assessment Report15
Figure 10. Mean annual flow on the Buffalo River compared to precipitationFigure 11. Mean annual streamflow on the Rainy River compared to precipitationWater Availability and Assessment Report16
Status of Minnesota’s LakesLakes hold a special place in Minnesota’s history, culture, and identity. They provide recreationalopportunities, support a thriving tourism industry, help modulate the impacts of high and low precipitation,and enhance real estate values. Lakes are also important ecosystems that support fish and wildlife. They areone of the most visible and valued aspects of Minnesota’s water resources.One of the defining characteristics of lakes is their ability to slow down and store water. We benefit fromlakes storing water, trapping sediment, and slowing runoff. Water levels in lakes are the difference betweenwater coming in (such as precipitation or inflow from streams and groundwater) and water leaving (such asevaporation, human use or outflow to streams and groundwater). Most lakes naturally experience variabilityin water levels, but climate change, land use changes, and structures like weirs and dams can alter thenormal range of water levels in lakes.In 2019, most lakes that DNR monitors had higher-than-normal water levels (Figure 12). Of Minnesota’s570 monitored lakes, 22 had water levels that ranked very high or very low compared to historic levels.Twenty-one of those 22 lakes had water levels more than two feet above the long-term median lake level,and only one lake was two feet below its long-term median. This broad shift toward higher lake levels is theresult of increased precipitation and land use changes.Figure 12. Departure from annual median water levels in 570 lakesHuman development along lakeshores leads to increased public expectations for managing lake levels to avery narrow range. In most cases, water resource managers have limited ability to control lake levels. As ourclimate becomes wetter overall, we will experience more problems due to high lake levels, unless we beginto plan and build for climate extremes. Although we have been in a historic wet period, drought will comeand with it will come low lake levels.Water Availability and Assessment Report17
Extremely high and low lake levels can cause property damage and temporarily impact recreationalactivities. However changing lake levels may be beneficial for lake ecosystems. Many lakes naturally havefluctuating water levels, and their aquatic plants have evolved with large water level fluctuations. Forexample, three-square bulrush protects shoreline from erosion by buffering waves and stabilizingsediments. It also provides important aquatic habitat for fish and wildlife. However, three-square bulrushrequires periodic large water level fluctuations, i.e., long periods of wet and long periods of dry. Similarly,lowering the lake level of an impounded lake can improve water clarity and habitat for fish and migratorybirds.Property damage on Lake SuperiorFollowing a period of low lake levels, Lake Superior has more recently reached near record high levels. Highwater levels are eroding the shoreline, damaging coastal infrastructure and property, flooding marinas,creating navigational hazards, shrinking recreational beaches, and harming coastal habitat.Status of Minnesota’s WetlandsMinnesota’s wetlands are critical our state’s hydrology. Wetlands store water from snowmelt and springrains, thereby preventing water from overwhelming floodways. The water stored in wetlands is a source ofgroundwater recharge as well as necessary wildlife habitat. Wetland plants take up nutrients, whichimproves water quality in downstream lakes and rivers. The plants also store carbon, provide habitat, andforage for wildlife.Minnesota has 12.2 million acres of wetlands, second in total acreage among the 48 states coterminousstates, behind only Florida. However, we have lost about half of our original wetlands. In southern andwestern Minnesota, millions of acres of our historic wetlands were lost to drainage and development,leaving most of those remaining in the north and east. This loss has resulted in a loss of water storagecapacity, groundwater recharge, and other ecological benefits.Water Availability and Assessment Report18
More recently, we have observed small, consistent net gains in wetland area (Figure 13). The DNR’swetland status and trends monitoring program shows that Minnesota had a net gain of 8,460 acres ofwetland from 2006 through 2017. Wetland protection programs reduced wetland losses, including thepassage of the Minnesota Wetland Conservation Act in the early 1990s. In addition, several state and federalprograms are actively restoring wetlands.Figure 13. Wetland gains and losses from 2006 - 2017A deeper look at the data shows that wetlands in Minnesota are changing. In addition to tracking totalwetland acreage, the DNR wetland monitoring program tracks changes by wetland type. Although therehave been small net gains in wetland acreage, the changes in wetland type suggest some potential areas ofconcern. Much of the observed gains were open-water-type wetlands (ponds), which typically have lesswildlife habitat value than many other wetland types. Furthermore, the data also show conversionsWater Availability and Assessment Report19
between wetland types, such as emergent wetlands converted to cultivated wetlands or ponds. Rather thana loss of wetland area, this is a loss of wetland function. Natural wetland vegetation is responsible for manyof the important benefits of wetlands. Wetlands without significant vegetation, such as ponds, or thosewhere the natural vegetation has been removed for growing cultivated crops, do not provide these benefitsat the same level.Historical wetland losses were due primarily to drainage for development, mostly agricultural production.Recent wetland changes are the result of climate, human activities, and grou
Minnesota Department of Natural Resources 500 Lafayette Road St. Paul St. Paul, MN 55155-4025 (651) 296-6157 Email: info.dnr@state.mn.us www.dnr.mn.us