Transcription
Housing Affordability Near Metro’s Light Rail – Expo Line & Gold LinebyMichelle RamirezA Thesis Presented to theFACULTY OF THE USC DORNSIFECOLLEGE OF LETTERS, ARTS AND SCIENCESUniversity of Southern CaliforniaIn Partial Fulfillment ofthe Requirements for the DegreeMaster of Science(Geographic Information Science and Technology)May 2020
Copyright 2020 by Michelle Ramirez
Table of ContentsAcknowledgement .iiiList of Figures and Table .ivList of Abbreviations .vAbstract.viChapter 1 Introduction and Background .11.1. Motivation.31.1.1. Societal Impact .41.1.2. Scientific Knowledge.41.2 Research Questions and Working Hypothesis.51.3 Project Overview .61.4 Background.71.4.1 East Los Angeles Neighborhood.71.4.2 South Los Angeles Neighborhood .9Chapter 2 Literature Review .112.1 Housing and Transit Development.112.2 GIS Approach .142.3 Displacement .16Chapter 3: Methodology.193.1 Data Sources.193.2 Data Description .223.2.1 Assessor Parcels Data - 2006 thru 2019.223.2.2 Block Group Data.23i
3.3 Research Design . .243.4 Analysis Techniques and Tools .263.4.1 Hedonic Regression Model.263.4.2 Network Analysis - Closest Facility Analysis.273.4.3 R Studio .283.5 Map Creation.283.5.1 Demographics Maps.283.5.2 Zoning Maps.28Chapter 4 Results.304.1 Hedonic Regression Model .304.1.1 South Los Angeles.324.1.2 East Los Angeles .334.2 Demographics in South and East Los Angeles.354.2.1 Ethnicity.354.2.2 Median Income.394.3 Zoning of South and East Los Angeles .41Chapter 5 Conclusion and Recommendations.445.1 Resources Limitation.455.2 Future Work.46References . .47Appendix A .51Appendix B .52ii
AcknowledgementsTo professors, friends, coworkers, and family members that have helped me through this processthank you!iii
List of Figures and TablesFigure 1 Study area the County of Los Angeles and Metro Lines (Gold & Expo) . 3Table 1 Characteristics of East Los Angeles from 2003 to 2017 . .8Table 2 Characteristics of South Los Angeles from 2003 to 2017 . 9Table 3 Table of the needed data to conduct the study. 21Figure 2 Flowchart of the need process to conduct the analysis and outcomes. 25Figure 3 Housing value near the Gold line in 2009 . 31Figure 4 Housing value near the Expo line in 2009 . 31Table 4 Model 1 of South Los Angeles housing and Expo line proximity . .32Table 5 Model 2 of East Los Angeles housing and Gold line proximity . .34Figure 5 Demographic changes of South Los Angeles from 2009 to 2017. 36Figure 6 Demographic changes of East Los Angeles from 2010 to 2017. 38Figure 7 Income changes of South and East Los Angeles from 2009 to 2017.40Figure 8 Zone types from 2009 depicts the number of non-single family homes within proximityto the Expo (South Los Angeles) and Gold Lines (East Los Angeles) .42Figure 9 Zone types from 2017 depicts the number of non-single family homes within proximityto the Expo (South Los Angeles) and Gold Lines (East Los Angeles) .43iv
List of AbbreviationsACS – American Community SurveyGIS – Geographic Information SystemsHRM – Hedonic Regression ModelMetro – Los Angeles County Metropolitan Transportation AuthorityOLS – Ordinary least squaresTOD – Transit-Oriented DevelopmentSFR – Single Family Residencev
AbstractThe Los Angeles County Metropolitan Transportation Authority is the third largest publictransportation agency in the country — established in 1993 due to a merger between SouthernCalifornia Rapid Transit District and the Los Angeles County Transportation Commission. Themission of the company is to enhance the “quality of life for all who live, work and play withinLA County” (Metro’s website). In order to achieve this mission Metro has created services andhas invested in bikes, buses, light rails, and rideshare programs. The most impactful investmentwas into the light rail systems. This rail system includes two rapid subways, four light rails, andninety-three stations, which spans 105 miles throughout the county. This thesis examined howMetro’s light rail system has influenced the value of single-family residential homes in theneighborhoods surrounding the Expo (South Los Angeles) and Gold (East Los Angeles) lines.This study examined how Metro has transformed the zoned area near these two Metro light rails.In order to analyze the impact, the Hedonic Regression Model was utilized to determine thecorrelation between these light rails and housing values. A series of maps were created to depictthe demographic and physical change over a ten year period. The result of the study showed thatthe impact that Metro’s light rails was minimal and did not show significant change in the social,economic, and structural landscapes of these communities.vi
Chapter 1 Introduction and BackgroundOne of the biggest challenges that the City of Los Angeles has and is currently facing is ahousing crisis, which has created ramifications in communities throughout Los Angeles. Likeany major city of the United States the current landscape of housing prices, demographics ofcommunities, and zoning of land can be traced back to the formal and informal practices ofpublic and private institutions. Practices like redlining, discriminatory mortgage loans, andracially restrictive housing covenants were strategies used by the government and financialorganizations to keep certain economic and ethnic groups restricted to live in specific areas ofLos Angeles. Areas of the city such as South Central and the East Los Angeles were created byredlining which created neighborhoods that are historically associated with specificdemographics (race and income). These restrictions practices also kept these communities fromreceiving financial services from banks and the government that would have provided themassistance to buy homes. The policies enacted in the past have had financial implications for theneighborhoods and community members, causing many of these individuals to become long timerenters or have devalued housing prices.In order to reverse some of these practices from the past, new strategies and programswere created to help economically disenfranchised communities. The city played an importantrole in creating new programs to help with the housing crisis – opportunity zone and first-timehomebuyer programs. Another program that is currently having an enormous impact on thesocial, and physical layout of Los Angeles is the reinvestment of major projects like Metro’slight rail system. Los Angeles Metro has received nearly two billion dollars from federal andstate grants to finance this project. This funding has provided Metro the ability to expand andcreate new rail system on top of the 105 miles throughout the County, four rails, two subways,1
and ninety-three stations. Los Angeles Metro has also acquired land such as parking structuresand parking lots further expanding their economic influence on communities.In order to determine whether Los Angeles Metro has had an impact on these communities thisthesis examined South Central and East Los Angeles neighborhoods. These two communitieswere examined to determine the change in the past ten years and the type of changes that haveoccurred since these light rails opened to the public. The South Central and East Side areas ofLos Angeles are historically minority communities and, to some extent, low-incomecommunities as well. However, due to new city projects like the Metro’s light rail reinvestmentinto these areas has grown. This change can be seen by stations in Boyle Heights and Crenshawneighborhoods. This reinvestment into these areas can be seen through conversations, articles,and studies over the last couple of years have talked about gentrification, displacement, andredevelopment in these communities.The scale of this project is enormous, and it will have economic and social ramificationsfor these communities. The financing, policy, and outreach needs to be holistically understood byall in order to be an inclusive project. These practices need to be examined in order to determineall the impacts it will have on people, so policy can be enacted to protect the most vulnerablecommunity members. While also giving those communities the agency, they need to determinethe best course for them financially. This thesis examined how Metro’s light rails havetransformed these areas regarding housing value, demographics (income and race), and thephysical structures of single residential housing to other forms of housing (apartments &condominiums). Theorizing that these indicators have changed over the past ten years due to thedevelopment of the light rails at .5-mile proximity to single family residence housing.2
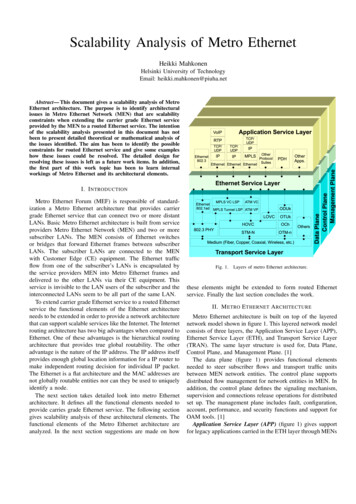
1.1 MotivationThe motivation for this study examined whether Metro’s light rails have increased ordecreased the value of housing prices in the South Central and East Los Angeles communities.To understand the implications of what occurred (with regards to changing demographics and thephysical zoning of the areas by the Metro’s light rails). There needed to be an in-depth analysisbetween housing prices and the light rails to determine if there was a correlation between thesetwo entities. By understanding if there was some type of correlation, then it becomes be easier tounderstand the changes that are occurring to the neighborhood’s demographics and physicallayout.Figure 1: The study area the County of Los Angeles and Metro Lines (Gold & Expo).3
1.1.1 Societal ImpactThis study attempts to inform the general public, public leaders, planners, and cityofficials about the negative affect that there could be, so they can have a more holisticunderstanding of the implications about these light rails. This spatial phenomenon has hadfinancial impacts on the homeowners and renters of these areas, by informing these individuals itbetter suits them to prepare financially. It also gives community members, that do not haveproperty, the agency as stakeholders to have a voice in the process of planning, and policies thatwill affect their communities. It is important to involve the homeowners and renters in thisprocess, because it is their community that will face the most displacement.Like these stakeholders the government also plays a role as well and they too arestakeholders. By knowing the ramification of these lines, they can implement policies that canhelp these vulnerable communities from being displaced. As housing prices and rent continue tobe unaffordable throughout the county, displacement will continue to increase. With a city thathas increasing housing values, more and more people are spending more than 30% of income onrent. City of Los Angeles and Metro need to have a better understanding of their stakeholdersneeds by involving them in this process in order to avoid displacement. Even as these light raillines were established and are currently being developed, conversations and policies can becreated to stop the potential displacement.1.1.2 Scientific KnowledgeGeographic information science is a very useful and powerful field that merges the socialand scientific fields. There is an enormous amount of literature regarding GIS, transportation,and housing values that contribute to the conversation of GIS’s role in studying social andscientific phenomenon. While past studies conducted focus heavily on statistical outputs (such as4
regressions to determine their outcome), this study heavily focused on presenting a story througha regression model and cartographic maps. By presenting the data in this manner, it allowed themaps to depict the structural and social changes of a city with the statistical evidence to reinforcethe story that the maps attempted to tell. The research conducted tested the working hypothesiswith a regression model and depict the geographic data that was used to study this spatialphenomenon – demographics and structural changes of these neighborhoods.1.2 Research Questions and Working Hypothesis Is there a correlation between these light rails and housing values? Has Metro’s light rails made these areas unaffordable which has led to displacement? How have these lines changed the demographics and physical layout of these areas?The working hypothesis was that Metro’s investment into the Gold and Expo lines mighthave an influence on the value of housing which could attract new interest into these South andEast Los Angeles areas. Potentially leading to the displacement of community members that arehistorically tied to those areas. In order to test this hypothesis and to answer these questions, thisstudy is broken down into two parts: first part studies the single-family housing within a .5-mileproximity to these two Metro light rails from the years of 2008 to 2018. A regression model wasconducted to determine if there was a correlation between these lines and the increase housingvalues. This regression model excludes mixed housing developments, condominiums, andplazas, due to the limitations of technical resources. The second part of this study focuses heavilyon maps that illustrate the differences in the demographics and structural layout of these twoneighborhoods.5
1.3 Project OverviewThe project consisted of two aspects that illustrated the correlation between Metro’s lightrails and housing value in these neighborhoods. The first component was the Hedonic regressionmodel that utilized parcel data, which consisted of data of each single-family housing from 2008to 2018 of these two communities. This regression illustrated the influence that these lines couldhave on housing value. The dependent variable was the total value of housing with theindependent variables being the distance to the metro light rail, size, and other external outputs.The second aspect of this study was the creation of a series of maps that illustrated the differencein demographics and physical layout of housing near these lines within 2008 and 2018. In thisseries of maps two indicators (income and race) were utilized to illustrate the change in theseneighborhoods. Depending on the outcome, the regressions either reflect what the mapsillustrate, or not.To establish the research effectively defining displacement, affordable housing, and racewere important to create the foundation of this study. It is crucial that these words areunderstood, because these words are subjective and can change depending on who used it.Displacement and affordable housing were defined based on other research articles related to thistopic. Income and race were used to determine if displacement occurs and whether theunaffordability of these areas influenced by housing price which will led to this displacement.Race was defined because the manner in which that data is collected by the AmericanCommunity Survey. The difficulty with race was based on ethnicity and race with the Latinopopulation: Hispanic and Non-Hispanic. Race was defined and determined based on how theCensus Bureau defined this word and how they categorized this data.6
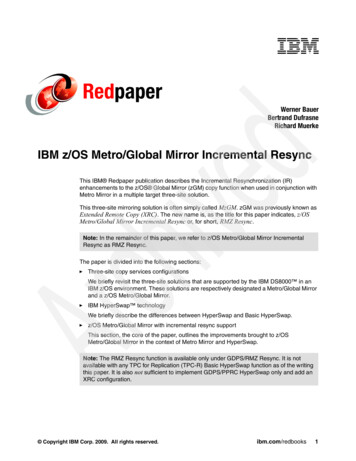
Currently, Los Angeles is going through a revitalizing transformation that is affectingevery single Los Angelino. There was an influx of new investments from the public and privatesectors that have sprung new projects throughout the city. New projects such as the expansion ofthe Metro light rails, housing complexes, and sport stadiums just to name a few projects aretransforming the city. The main purpose of this research was to give an in-depth analysis to cityplanners, and government officials, so they can create policies to prevent displacement ofcommunity members that are historically associated with those neighborhoods. Housingaffordability affects everyone in the city and if there is no policy implemented this problem willonly continue to worsen.1.4 Background1.4.1 East Los Angeles NeighborhoodIn 2003 East Los Angeles area was a very hegemonic community with the majority ofthe population having similar social, economic, and demographic characteristics. The totalpopulation was 124,283 with 96% of the population being Hispanic or Latino descent. Themedian income for a household was 28,544 annually with 30% of families living belowpoverty. 43% of the people living in this area had a 9th grade education, 23% had no high schooldiplomas, and 17% of the population had a high school diploma (ACS). In 2003 the Gold linewas introduced to the public for ridership in an attempt to connect the city. During this time themajority of individuals that commuted to work utilized a car as a means of transportation.Since the opening of the Gold line the community still remains very hegemonic with 96%of the residents of the community being Hispanic or Latino descent. However, changes in otherdemographics and social characteristics have changed. The median income has grown to 45,000annually and the poverty levels dropping to 25%. Education levels have also increased with 32%7
of the residents have 9th grade education, 16% of residents do not have a high school diploma,and 24% of residents that have higher than a high school diploma. Another change can be seen inthe community which is public transportation as of 2017 public transportation has increased.Overall, education levels and income levels in these neighborhoods have risen.Table 1: Characteristics of East Los Angeles from 2009 to 2017.Characteristics200920132017Total %97.6%96.4%Black/African American0.2%0.8%0.2%White1.1%2.4%1.8%Income 37,128 37,982 42,544High School Education22.9%23.3%23.8%8
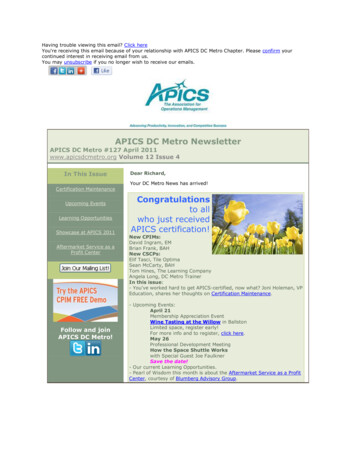
1.4.2 South Los Angeles NeighborhoodIn 2009 the Expo line was introduced to several neighborhoods in South Los Angelesincluding -- Baldwin Hills/ Crenshaw, West Adams, Leimert Park, Jefferson Park, andExposition Park. The total population in 2000 was 117,861 with 96% of the population beingblack or African American descent. The median income for a household was 30,000 annuallywith 27% of families living below poverty. 46.3% of the people living in this area had a 9thgrade education, 26% no high school diploma, and 18% of the population had a higher than ahigh school diploma. In 2009 the Expo line was introduced into to the public for ridership.During this time most individuals that commuted to work utilized a car as a means oftransportation.Since the opening of the Expo Line in 2009 the social and demographic indicators ofthese neighbors have changed. According to the ACS the education levels have risen from 74%of the population have a high school diploma to 77% with 28% of the population received abachelor’s degree. The median income has also risen to 46,000 annually and the amount offamilies living below the poverty line has dropped to 19%.Table 2: Characteristics of South Los Angeles from 2009 to 2017.Characteristics200920132017Total %NA50%Black/African American35%NA30%White15%NA20%Income 32,965 49,138 36,884High School Education66%73.7%76.4%9
Overall, these neighborhoods in South and East Los Angeles social characteristics haveimproved. Levels of education have increased, and poverty levels have dropped. As these areassee an increase in education and income these areas remain some of the poorest communities.The ACS reported the County of Los Angeles median income in 2017 was around 70,000which in comparison to South Los Angeles and East Los Angeles the median income was around 42,000. Conveying that these communities still are considered low income and poorerneighborhoods. These areas also remain very hedonic with one ethnicity live in these areas at ahigher rate than any other ethnic group.10
Chapter 2 Literature ReviewThis literature review examined that various amounts of work on research on housing patterns,displacement, the light rail transit, and transit-oriented development. This amount of informationestablished a foundation to determine what approaches and limitations that should be considered.These literature reviews synthesized the connections (negative or positive) that these two entitieshave one each other. The second part of this thesis examined what methods were the bestapproach to determine what type of correlation could occur. Lastly, this section sought tounderstand the social ramifications behind the public transportation and what potential problemscould occur.2.1 Housing and Transit DevelopmentTransit development in the County of Los Angeles was a practice that were used bycompanies like the Pacific Electric Railway Company to increase the value of land surroundingthe rail lines. Till this day this practice such as transit oriented development, and zone policiesare used to create ridership and increased land value. The condominium market in San Diegowas used to analyze how affect transit-oriented development increased housing prices, howproximity to rail stations in Texas have influenced single family residence (SFR), and howdifferent land types value fluctuates in proximity to a rail station.In San Diego the transit-oriented development near condominiums has increased theprice value of these homes. Michael Duncan researchers attempted to understand what variableswere the factors that increased the value of these condominiums (Duncan 2010, 3). In the studythe hedonic price model was utilized to estimate the statistical significance of transit-orienteddevelopment. According to the results a “condo in a good pedestrian environment and near astation (i.e. TOD) has a significantly higher value than a condo in a similar neighborhood not11
near a station. Conversely, a condo in a less walkable residential neighborhood near a park-andride station (i.e. TAD) can have values that actually fell below” (Duncan 2010, 121). There was astrong connection between the dependent and independent variables illustrates that amenitiesadded by transit orient development (TOD) increased the price of a condominium. By taking intoconsideration the walkability as variable the author argued that TOD did have the ability to alterto prices of housing. Suggesting that the further away the condominiums are from the station andlimited walkable areas the lower the prices of the unit. The hedonic model was utilized in thisstudy to show what factors influenced the price of housing. The next study takes a differentapproach and used single family residence (SFR) and not condominiums as this study did.The METRORail in Texas is the 12 largest public light rail system and this studyexamined the influence it had on single-family residential home value. Multiple linear regression(MLR) and ordinary least squares (OLS) models were used to determine which statistical toolwould be able to show to most statistical significance. Both regressions illustrated differentresults arguing that residential homes near stations have higher value than those further away.The conclusion states that “the OLS estimation reveals that the light rail line has positivelysignificant effects on properties located between one-mile and three-mile distance from rail stopswhile the MLR model only shows insignificant effects of light rail on those properties” (Diao2019, 166-167). There was a statistically significant reaffirming the prediction that a station nearresidential property was one major contributing factor to increasing resident house value. Thecorrelation between distance and the property value of the single family residence (SFR)provided further evidence that proximity to a rail or station equals greater price value. Twodifferent methods were used to analyze the correlation to understand the patterns that can occur12
with spatial distribution. The study showed that OLS was more effective than MLR to determinewhich independent variables, in this case distance, to show the influence on housing values.The next study examined the value of condominium by applying a different approach andexamined the sale of properties utilizing parcel data. According to the findings of the study“among land uses, the largest share of condominium sales was within a half-mile of a transit stop– 16.9 percent; for other land uses, the shares of sales near rail stations or BRT stops were:commercial – 12.6 percent; multi-family housing – 12 percent; and single-family homes – 5.7percent” (Cervero et al. 2002, 11). Robert Cervero utilized the hedonic model to analyze theparcel data and the different types of land use – commercial, single-family housing, multi-familyhousing, and condominium. This analysis showed that land types are different overall within theproximity to the light rails the values goes up almost 20 percent and the lowest land value 6percent. The authors took into account different types of zoned land which showed that differenttype of housing has various values – a condominium closer to a station did have increased landvalues than single family residence. The analysis showed that the land zoned as condominiumsdid have more value than SFR suggesting that type of housing was as important asproximity. The type of housing can be an important indicator as much as a light rail, suggestingthat there are many external factors other than that light rail that need to be considered.These studies have shown that depending on the independent variable with a proximity tothe light rail could play a greater role than other variables such as square feet or numbers ofbedrooms. In the three studies above whether the HRM, OLS, or MLR are used it suggest thatproximity between 1 to 3 miles to a rail station gave the greatest value to housing. The differentregression show
social, and physical layout of Los Angeles is the reinvestment of major projects like Metro's light rail system. Los Angeles Metro has received nearly two billion dollars from federal and state grants to finance this project. This funding has provided Metro the ability to expand and