Transcription
(2022) 21:105Li et al. Cardiovascular 1-5Cardiovascular DiabetologyOpen AccessRESEARCHTriglyceride‑glucose index variabilityand incident cardiovascular disease:a prospective cohort studyHaibin Li1,2†, Yingting Zuo3,4,5†, Frank Qian6, Shuohua Chen7, Xue Tian3,4,5, Penglian Wang3,4, Xia Li8,Xiuhua Guo5, Shouling Wu7* and Anxin Wang3,4*AbstractBackground: Recent studies have suggested that triglyceride-glucose (TyG) index is an independent predictor ofcardiovascular disease (CVD). However, the impact of long-term visit-to-visit variability in TyG index on the risk of CVDis not known. We aimed to investigate the longitudinal association between baseline and mean TyG index as well asTyG index variability and incident CVD in a Chinese population.Methods: We included 49,579 participants without previous history of CVD in the Kailuan study who underwentthree health examinations (2006, 2008, and 2010) and were followed up for clinical events until 2019. TyG index wascalculated as Ln [fasting triglyceride (mg/dL) fasting glucose (mg/dL)/2]. We measured TyG index variability asthe SD of the residuals obtained from a linear regression on the three TyG index measurements for each individual.Multivariate-adjusted Cox models were used to estimate the adjusted hazard ratio (aHR) and 95% confidence interval(CI) with incident CVD.Results: During a median follow-up time of 9.0 years, 2404 developed CVD. The highest tertile (T3) of baseline andmean TyG index were each associated with higher CVD incidence as compared with the lowest tertile (T1): aHR, 1.25;95% CI 1.11–1.42; and aHR 1.40; 95% CI 1.24–1.58, respectively. Tertile 3 of TyG index variability was associated withincreased CVD incidence compared to T1 group (aHR, 1.12; 95% CI 1.01–1.24). Similar findings were observed in aseries of sensitivity analyses.Conclusion: Higher TyG index level and greater TyGindex variability were each independently associated with ahigher incidence of CVD.Keywords: Triglyceride-glucose index, Cardiovascular disease, Variability, Cohort study†Haibin Li and Yingting Zuo contributed equally to this work*Correspondence: drwusl@163.com; wanganxin@bjtth.org3Department of Neurology, Beijing Tiantan Hospital, Capital MedicalUniversity, Beijing, China7Department of Cardiology, Kailuan Hospital, North China Universityof Science and Technology, Tangshan, ChinaFull list of author information is available at the end of the articleBackgroundInsulin resistance has been identified as an importantrisk factor for the development of cardiovascular disease (CVD) [1], which is a leading cause of morbidityand mortality in China and worldwide [2, 3]. A metaanalysis of cohort studies or nested case–control studies have shown a positive prospective relationshipbetween insulin resistance and risk of CVD in non-diabetic adults [4]. Furthermore, a Mendelian randomization analysis suggested a causal relationship between The Author(s) 2022. Open Access This article is licensed under a Creative Commons Attribution 4.0 International License, whichpermits use, sharing, adaptation, distribution and reproduction in any medium or format, as long as you give appropriate credit to theoriginal author(s) and the source, provide a link to the Creative Commons licence, and indicate if changes were made. The images orother third party material in this article are included in the article’s Creative Commons licence, unless indicated otherwise in a credit lineto the material. If material is not included in the article’s Creative Commons licence and your intended use is not permitted by statutoryregulation or exceeds the permitted use, you will need to obtain permission directly from the copyright holder. To view a copy of thislicence, visit http:// creat iveco mmons. org/ licen ses/ by/4. 0/. The Creative Commons Public Domain Dedication waiver (http:// creat iveco mmons. org/ publi cdoma in/ zero/1. 0/) applies to the data made available in this article, unless otherwise stated in a credit line to the data.
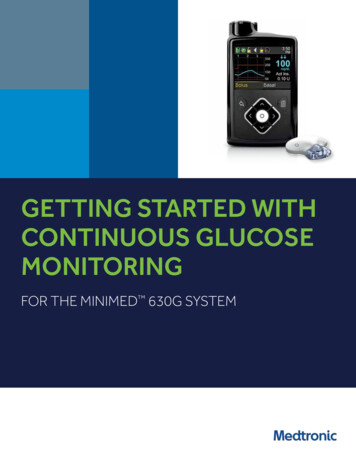
Li et al. Cardiovascular Diabetology(2022) 21:105the insulin resistance and CVD [5]. Therefore, the earlyidentification of individuals with insulin resistance willbe essential to reduce the disease burden of CVD.In the clinical setting, measurement of insulin resistance can be challenging as there are limitations to thehomeostasis model assessment for insulin resistance(HOMA-IR) and the gold standard of the euglycemicclamp is time-consuming and burdensome [6]. Thetriglyceride-glucose (TyG) index, which is the logarithmized product of fasting triglyceride and glucose, hasbeen shown to be a simple measure of insulin resistance[7]. Previous studies have shown that TyG index is significantly related to an increased risk of cardiovascular events [8–16]. Additionally, a recent meta-analysisof cohort studies that included 5,731,294 participantswithout CVD at baseline showed that highest TyG indexcategory was associated with 1.61-fold increased risk ofCVD [17]. However, most of prior studies were based ona single baseline TyG index measurement [8–12], whichmay not reflect long-term exposure. Few studies haveexamined repeated TyG measurements to evaluate theimpact of longitudinal TyG index on the risk of CVD. Toour knowledge, only one study examined the associationbetween change in TyG index at two time points and incident CVD [14]. Additionally, three studies have reportedon the association between time updated average TyGindex and the number of visits with a high TyG indexand CVD events [8, 9, 13]. Furthermore, although TyGindex may change over time, to our knowledge, no studyhas examined the association between long-term TyGindex visit-to-visit variability and CVD development.Visit-to-visit variability in cardiovascular risk factorshas been shown to predict the risk of adverse long-termcardiovascular outcomes and mortality, independent ofbaseline or average risk factors levels over [18]. Recently,the association between visit-to-visit variability in variousbiological measures (e.g., blood pressure, cholesterol, andglucose) and incident CVD have been examined [19–21].Our previous study has also shown that high long-termglycemic variability, measured as intraindividual variability in fasting glucose over time was associated withcardiovascular outcomes, independently of mean glucoselevels [22]. Additionally, some studies found associationsbetween greater variability in lipid measurements withcardiovascular outcomes [19–21, 23, 24]. Although TyGindex is derived from fasting triglyceride and glucose,variability in TyG index is not uncommon. Whether visitto-visit variability in TyG levels affect future cardiovascular outcomes in the general population is not known.Moreover, such studies can provide further evidence forfuture interventional trials that focus on reducing insulinresistance variability in addition to average insulin resistance levels.Page 2 of 12Therefore, we conducted a large population-basedstudy involving more than 49,000 Chinese adults whohad repeated measurements in TyG index to investigatethe longitudinal association between baseline TyG level,visit-to-visit variability in TyG index, and CVD incidenceduring a median 9.0-year follow-up in a general population. We hypothesized that higher TyG level as well asgreater variability are both associated with increased riskof CVD.Study populationDetails of the Kailuan study cohort design, methods, anddata collection have been published previously [8, 9, 14,19]. In brief, the Kailuan study recruited 101,510 community-dwelling adults aged 18 years and over between June2006 and October 2007 in the Kailuan community, Tangshan City, China. A standardized interview and healthexaminations were conducted at baseline and follow-up.This study was approved by the Ethics Committee of Kailuan General Hospital and Beijing Tiantan Hospital, Capital Medical University, and it was conducted accordingto the principles of the Declaration of Helsinki. All participants provided written informed consent.In this analysis, we included participants who underwent 3 health examinations between June 2006 andDecember 2010 (baseline and index year). Of 56,833participants, we excluded those who had missing dataon fasting blood glucose or triglycerides (n 1034),those who had a previous diagnosis of stroke or myocardial infarction (n 2874), and those who were on eitherlipid-lowering or antidiabetic drugs (n 3346) duringthe 4-year exposure assessment period. Therefore, 49,579eligible participants were included in the current study(Fig. 1). The study design was displayed in the Additionalfile 1: Fig. S1.Data collection and definitionsInformation on demographics, lifestyles, medical histories, anthropometric measurements, and laboratorytests were collected at baseline and follow-up surveys,as detailed elsewhere [8, 9, 14, 19]. In brief, informationon age, sex, education level, average monthly income,smoking status, alcohol intake, physical activity, and pastself-reported medical history (e.g., hypertension and diabetes) and medication use (e.g., hypoglycemic agents,antihypertensive agents, and lipid-lowering agents) wascollected via a face-to-face validated questionnaire. Education level was categorized into two groups: low (illiteracy or primary school, or middle school), and high (highschool or college/university). The low-income level wasdefined as participants’ average monthly income 1000yuan. Participants who currently smoked were definedas current smokers, and those who currently drank were
Li et al. Cardiovascular Diabetology(2022) 21:105Page 3 of 12Fig. 1 Flowchart of participants selectiondefined as current drinkers. Physical activity was assessedby questionnaire according to lifestyle behaviors thatcombined occupational and discretionary physical activities and divided into “physically inactive” and “physicallyactive”. Trained physicians or nurses measured participants’ height, weight, systolic blood pressure (SBP), anddiastolic blood pressure (DBP). Body mass index (BMI)was calculated as weight (kg)/height (m)2. Fasting bloodsamples were collected and were measured using theHitachi 747 auto-analyzer (Hitachi, Tokyo, Japan). Serumtotal cholesterol (TC), triglycerides (TG), high-densitylipoprotein cholesterol (HDL-C), low-density lipoproteincholesterol (LDL-C), fasting blood glucose (FBG), creatinine, and high-sensitivity C-reactive protein (hs-CRP)were measured via a standardized protocol. Hypertensionwas defined as a self-reported history of hypertension,use of antihypertensive medications, SBP 140 mmHg,or DBP 90 mmHg. Diabetes was defined as selfreported history of diabetes or FBG 7.0 mmol/L.Hypercholesterolemia was defined as self-reported history of dyslipidemia, or TC 5.17 mmol/L. Estimatedglomerular filtration rate (eGFR) was calculated usingthe Chronic Kidney Disease Epidemiology Collaboration creatinine equation [25]. Chronic kidney disease wasdefined as an eGFR 60 mL/min/1.73 m2. High hs-CRPwas defined as a hs-CRP 3 mg/dL [26].Definition of baseline, mean and variability of TyG indexAccording to previous studies [8, 14], the TyG index wascalculated as Ln[TG (mg/dL) FBG (mg/dL)/2]. Thebaseline TyG index was calculated by using serum TGand FBG measured in 2010. Mean TyG index was definedas the average of TyG index measured in 2006, 2008, and2010. The TyG index variability was defined as intraindividual variability in TyG levels measured on these threehealth examinations. As previously described [27, 28], weused residual SD, defined as visit-to-visit TyG index variability calculated as the root-mean-square error (RMSE)of the residuals (i.e., differences between observed TyGand predicted TyG) obtained from a simple linear regression analysis of the three TyG measurements of eachparticipant.
Li et al. Cardiovascular Diabetology(2022) 21:105Study outcome and follow‑upThe study outcome was newly diagnosed CVD, whichwas defined as a composite of myocardial infarction andstroke. As previously described [14, 29], all participantswere linked to the Municipal Social Insurance Institution and the Hospital Discharge Register for incidenceof CVD, which cover all the Kailuan study participants.To further identify potential CVD cases, we reviewed thedischarge lists from the 11 hospitals during 2006–2019and asked for a history of CVD via a questionnaire during the biennial interview. For all suspected CVD events,three experienced physician adjudicators who wereblinded to the study design reviewed the medical records.Myocardial infarction was defined as the recording ofICD-10 codes I21. Stroke was defined as the recordingof ICD-10 codes I63, or I60 to I61. The vital status wasobtained from Hebei Provincial Vital Statistics Offices ordirectly contacting the participants’ family members andreviewed by physicians.Statistical analysisBaseline characteristics of Kailuan study participantswere described across TyG index variability tertiles.Continuous variables were summarized as mean SDor median (interquartile range) depending on variabledistribution, and categorical variables as count (proportion). Continuous variables were compared using oneway ANOVA or the Kruskal–Wallis test, and categoricalvariables were compared using the χ2 test across tertilesof TyG index variability. Covariate balances were alsoexamined using standardized mean differences (SMDs).We considered a SMDs 0.1 as indicative of imbalance.We analyzed risk of CVD according to the tertiles ofbaseline, mean, and variability of TyG index, and thecombination of baseline TyG index tertiles and TyGindex variability tertiles. Person-years of follow-up foreach participant were calculated as the amount of timefrom the index date to the first of the following events:incident CVD, death, or December 31st, 2019. Incidencerate of CVD per 1000 person-years was calculated. Timeto first CVD event was examined using Kaplan–Meiersurvival curves and compared using log-rank test. Multivariable-adjusted Cox proportional hazards regressionmodels were used to estimate the adjusted hazard ratios(aHR) and 95% confidence intervals (CI). The proportional hazards assumption was verified by inspectingthe negative log–log survival plots and no violation wasobserved. Model 1 was adjusted for age and sex. Model2 was adjusted for age, sex, education, income, currentsmoking status, current drinking status, physical activity, BMI, diabetes, hypertension, chronic kidney disease, and hs-CRP. Model 3 was additionally adjusted forhypercholesterolemia, HDL-C, and LDL-C. Model 4 wasPage 4 of 12additionally adjusted for baseline TyG index for analysesof TyG index variability. In the trend test, the categoricalvariable (i.e., TyG index variability tertile) was statisticallyexamined as an ordinal variable (continuous variable) inCox regression model.The linearity of baseline TyG index, mean TyG index,and TyG index variability for CVD risk was assessedusing a restricted cubic spline Cox model. The association between TyG index variability and risk of CVD werefurther examined when stratified by the baseline levelof TyG index. Interactions between baseline TgG indexand TyG index variabllity in relation to CVD risk wereassessed by likelihood ratio test. In addition, optimal cutoff points for baseline TyG index, mean TyG index, andTyG index variability associated with incident CVD weredetermined using an outcome-oriented method to maximize log-rank statistics [30]. Harrell’s C statistics and netreclassification improvement (NRI) for survival data wereused to estimate the improvement in discrimination andreclassification after adding the baseline and TyG indexvariability to the clinical model [31]. 95% CI for continuous NRI were estimated with 500 bootstrap replications.To estimate the population impact of TyG index measures on CVD risk, we estimated the absolute risk difference between baseline, mean, and variability of TyGindex and incident CVD. Predicted cumulative incidenceand absolute risk differences were presented as per 1000population over 10 years and were estimated using flexible parametric survival models on the cumulative hazardscale [32], similar to what has been done previously [33].We also plotted the adjusted cumulative incidence curvesfor CVD by extrapolating to 10 years using stpm2 andstandsurv command in Stata, which were standardized tothe baseline covariates.Several sensitivity analyses were conducted as follows: (1) we also categorized TyG index variability intofive groups: 0.15, 0.15 to 0.30, 0.30 to 0.45, 0.45 to 0.60, and 0.6, which was based on visual inspectionof histograms showing the population distributions ofTyG index variability (Additional file 1: Fig. S2); (2)to better capture the long-term direction of variationin TyG index, we also calculated the annual increaserate for TyG index over time [the slope of the simplelinear regression model in which TyG index in 2006,2008, and 2010 was the response variable and followup duration (years) was the independent variable].We categorized the slope into decreasing ( 0.2/year), stable ( 0.2 to 0.2/year), and increasing ( 0.2/year) groups based on visual inspection of histograms(Additional file 1: Fig. S3); (3) we excluded participantswith FBG 7.0 mmol/L or TG 1.7 mmol/L at baseline; (4) Fine-Gray competing risk regression was used,which treated deaths as competing risk events [34]; (5)
Li et al. Cardiovascular Diabetology(2022) 21:105Page 5 of 122-y lag analysis was conducted, which excluded CVDevents that occurred within 2 years of follow-up; (6)other variability measures including SD, coefficient ofvariation (CV), and independent of the mean (VIM)were calculated [19]; and (7) to assess the influence ofunmeasured confounding, E-value, which is defined asthe minimum strength of association, was calculatedbased on the estimated HR and 95% CI for CVD [35].Statistical analyses were conducted using STATAMP, version 16.0 (StataCorp) and R software, version4.1.3. All P-values were 2-sided and a P 0.05 wasconsidered statistically significant, unless otherwisestated.ResultsAmong the 49,579 participants, the mean age was52.5 11.8 years at baseline and 37,977 (76.6%) weremale. The mean baseline TyG index level of the totalstudy population was 8.7 0.7, and the median TyGindex variability was 0.2 (interquartile range 0.1–0.4).Table 1 shows the baseline characteristics of the studyparticipants according to tertiles of TyG index variability.Participants in the highest tertile of TyG index variability were slightly younger, more frequently male, currentsmokers and alcohol drinker, and had lower rates of regular exercise, and lower education and income. They alsohad higher prevalence of hypertension, diabetes, andhypercholesterolemia, and had higher mean BMI, SBP,DBP, FBG, and TG.Table 1 Baseline characteristics of study participants according to the TyG variability tertilesTotal (n 49,579)TyG index variabilityP valueSMDTertile 1 (n 16,527)Tertile 2 (n 16,526)Tertile 3 (n 16,526)52.5 11.853.3 12.152.7 11.851.6 11.5 0.001 0.113507 (21.2) 0.001 0.11Male sex37,977 (76.6)12,413 (75.1)12,579 (76.1)12,985 (78.6) 0.001 0.07Education ( high school)13,766 (27.9)4633 (28.1)4671 (28.4)4462 (27.1)0.028 0.03Income ( 1000 RMB/month)22,510 (46.5)7323 (45.3)7521 (46.6)7666 (47.7) 0.001 0.03Current smoker16,901 (34.2)5397 (32.8)5552 (33.7)5952 (36.2) 0.001 0.06Alcohol drinker17,589 (35.6)5626 (34.2)5704 (34.6)6259 (38.0) 0.001 0.08Physical activity6857 (13.9)2448 (14.9)2251 (13.7)2158 (13.1) 0.001 0.03Hypertension22,298 (45.0)7403 (44.8)7333 (44.4)7562 (45.8)Diabetes3154 (6.4)919 (5.6)932 (5.6)1303 (7.9)Hypercholesterolaemia19,289 (38.9)6435 (38.9)6326 (38.3)6528 (39.5)0.074 0.02Chronic kidney disease3040 (6.1)1075 (6.5)1027 (6.2)938 (5.7)0.006 0.03Antihypertensive agents4548 (9.3)1591 (9.7)1509 (9.2)1448 (8.9)0.026 0.02Body mass index, kg/m225.0 3.425.0 3.425.0 3.425.1 3.30.001 0.048462 (51.2)0.036 0.02130.1 19.0130.1 19.3129.9 18.9130.3 18.70.113 0.025.5 1.55.4 1.25.4 1.15.6 2.0 0.001 0.095.0 1.40.108 0.021.5 0.5 0.001 0.07Age, yearsAge 60 yearsBody mass index 25 kg/m2Systolic blood pressure, mm HgDiastolic blood pressure, mm HgFasting glucose, mmol/LEstimated glomerular filtration rateTotal cholesterol, mmol/LLDL-C, mmol/LHDL-C, mmol/LTriglycerides, mmol/L12,093 (24.4)24,984 (50.4)84.2 10.890.7 19.95.0 1.32.6 0.91.6 0.58276 (50.1)83.9 10.890.0 19.75.0 1.22.6 0.91.6 0.58246 (49.9)84.0 10.890.8 20.25.0 1.12.6 0.81.6 0.684.6 10.7 0.001 0.0691.2 19.9 0.001 0.042.6 1.20.021 0.021.4 (0.9, 2.2) 0.001 0.211.0 (0.5, 2.4)1.0 (0.5, 2.4)1.0 (0.5, 2.5)0.391 0.01Hs-CRP 3 mg/dL9662 (19.7)3216 (19.7)3162 (19.3)3284 (20.2)Baseline TyG index8.7 0.78.6 0.68.6 0.68.8 0.7 0.001 0.220.2 (0.1, 0.4)0.1 (0.0, 0.1)0.2 (0.2, 0.3)0.5 (0.4, 0.7) 0.001 2.248.6 0.68.6 0.5Values are presented as number (%), mean SD, or median (interquartile range)1.2 (0.9, 1.8)0.030 0.02 0.001 0.091.0 (0.5, 2.4)Variability of TyG index1.2 (0.9, 1.8)4135 (25.0)Hs-CRP, mg/dLMean TyG index1.3 (0.9, 1.9)4451 (26.9)8.6 0.58.7 0.60.143 0.02 0.001 0.27TyG index triglyceride-glucose index, LDL-C low-density lipoprotein cholesterol, HDL-C high-density lipoprotein cholesterol, Hs-CRP high-sensitivity C-reactive protein,SMD standardized mean difference
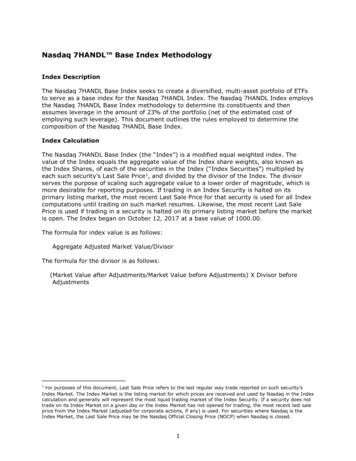
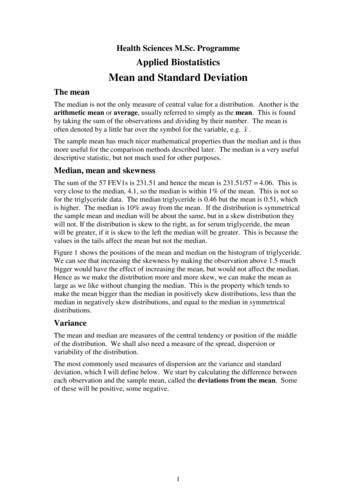
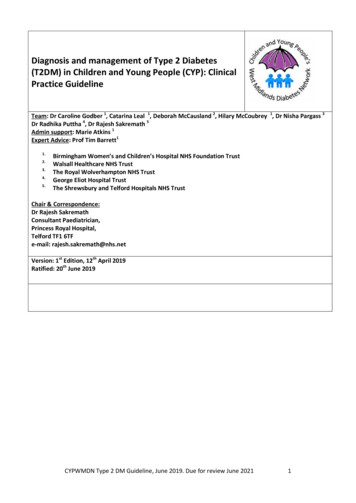
Li et al. Cardiovascular Diabetology(2022) 21:105Association of baseline, mean TyG index, and TyGindex variability with incident CVDDuring a median 9.0 years of follow-up (425,859.9person-years) after the TyG index variability assessment period, 2404 (4.9%) participants developed CVD.The overall incidence rate of CVD was 5.6 per 1000person-years.Table 2 presents the association between baseline TyGindex, mean TyG index, and TyG index variability withrisk of CVD. In Model 3, which was adjusted for allcovariates, the baseline and mean TyG index was positively associated with the risk of CVD. The aHR of CVDin the highest baseline TyG tertile was 1.25 (95% CI1.11–1.42) compared to that in the lowest tertile of baseline TyG index (P for trend 0.001). The CVD risk ofhighest tertile of mean TyG index level was higher (aHR,1.40; 95% CI 1.24–1.58) than that of lowest tertile ofmean TyG level (P for trend 0.001). After adjusting forall covariates, including baseline TyG index (Model 4),participants in the highest tertile of TyG index variability showed an increased risk of CVD (aHR, 1.12; 95% CIPage 6 of 121.01–1.24) compared to those in the lowest tertile (P fortrend 0.03). We observed a linear relationship of baseline TyG index, mean TyG index, and TyG index variability with incident CVD using restricted cubic splinesregression (Additional file 1: Fig. S4).Using an outcome-oriented method to maximize logrank statistics, the optimal cut-off points associated withincident CVD were 8.44 for baseline TyG index, 8.63for mean TyG index, and 0.17 for TyG index variability (Fig. 2). The Kaplan–Meier survival curves show thatthe incidence of CVD risk increased with higher levels ofbaseline TyG index, mean TyG level, and TyG variability(Fig. 2).Associations of TyG index variability with incident CVDaccording to baseline TyG index levelA significant interaction between TyG index variabilityand baseline TyG index was observed (P 0.002). Figure 3 shows the associations of TyG index variability withincident CVD after stratifying participants by baselineTable 2 Association between tertiles of baseline, mean, and variability of TyG index and incidence of cardiovascular diseaseHazard ratio (95% CI)aP for trendbTertile 1Tertile 2Tertile 3No. of ce rate per 1000 person-years4.185.826.95Model 1c1 [Reference]1.41 (1.27–1.56)1.81 (1.64–2.01) 0.001Model 2d1 [Reference]1.29 (1.15–1.44)1.37 (1.22–1.54) 0.001Model 3e1 [Reference]1.22 (1.09–1.37)1.25 (1.11–1.42) 0.001No. of nce rate per 1000 person-years3.855.757.35Model 1c1 [Reference]1.49 (1.34–1.66)2.00 (1.81–2.22) 0.001Model 2d1 [Reference]1.33 (1.18–1.49)1.51 (1.35–1.70) 0.001Model 3e1 [Reference]1.26 (1.13–1.42)1.40 (1.24–1.58) 0.001No. of ce rate per 1000 person-years5.035.595.94Model 1c1 [Reference]1.07 (0.97–1.18)1.19 (1.08–1.31) 0.001Model 2d1 [Reference]1.03 (0.93–1.15)1.13 (1.02–1.25)0.017Model 3e1 [Reference]1.04 (0.94–1.15)1.13 (1.02–1.25)0.021Model 4f1 [Reference]1.04 (0.94–1.15)1.12 (1.01–1.24)0.030Baseline TyG indexMean TyG indexTyG variabilityTyG triglyceride-glucose, CI confidence intervalaThe tertiles cutoff were 8.4, 8.4 to 8.9, 8.9 for baseline TyG index, 8.4, 8.4 to 8.8, 8.8 for mean TyG index, and 0.15, 0.15 to 0.35, 0.35 for TyG index variabilitybP value from linear trend test when tertiles were treated as an ordinal variable in the Cox modelcAdjusted for age and sexdAdjusted for age, sex, education, income, current smoking, current drinking, physical activity, body mass index, diabetes, hypertension, chronic kidney disease, andhigh-sensitivity C-reactive proteineAdjusted for covariates in model 2 plus hypercholesterolaemia, low-density lipoprotein cholesterol, and high-density lipoprotein cholesterolfAdjusted for covariates in model 3 plus baseline TyG index
Li et al. Cardiovascular Diabetology(2022) 21:105Baseline TyG indexLow5000High5.0HighLow2.5Cutpoint: 8.440.008.08.59.09.5Baseline TyG indexLow7.58.08.59.0Cumulative incidenceHighStandardized Log-Rank Statistic10.010000DensityPage 7 of 120.060.050.030.020.010.009.5Baseline TyG indexp 0.00010.040246Years of follow-up810810810Low2000010000Low5Cutpoint: 8.63008.08.5Mean TyG index8.09.0HighLow6000030000Standardized Log-Rank Statistic900008.5Mean TyG index0.20.060.05p 0.00010.040.030.020.010.009.00246Years of follow-upHigh2.01.5High1.0LowCutpoint: 0.170.50.000.0Low2.5TyG variabilityDensityHighCumulative incidenceHighHigh100.4TyG variability0.60.20.4TyG variabilityCumulative incidenceDensity30000Standardized Log-Rank StatisticMean TyG index400000.05Lowp 0.0170.040.030.020.010.000.60246Years of follow-upFig. 2 Determining cut-off values of baseline, mean, and variability of triglyceride-glucose index. Plot of the distribution (left panels), standardizedlog-rank statistics (middle panels), and Kaplan-Meier plot according to the cut point of baseline, mean, and variability of triglyceride-glucose index(right panels).BaselineVariabilityPopulation (n)Events (n)IRTertile 1Tertile 157242414.921 [Reference]Tertile 258021813.610.75 (0.61-0.91)Tertile 350061723.990.90 (0.73-1.10)Tertile 158352605.181 [Reference]Tertile 256353006.191.17 (0.99-1.40)Tertile 350512676.141.24 (1.04-1.48)Tertile 149682656.231 [Reference]Tertile 250893137.201.18 (1.00-1.40)Tertile 364694057.291.21 (1.03-1.42)Tertile 2Tertile 3IR incidence rate per 1,000 person-years; P for interaction 0.002.Adjusted HR (95% CI)0.60.811.21.4Hazard ratioFig. 3 Risk of incident cardiovascular disease according to the variability and baseline level of triglyceride-glucose index1.61.8
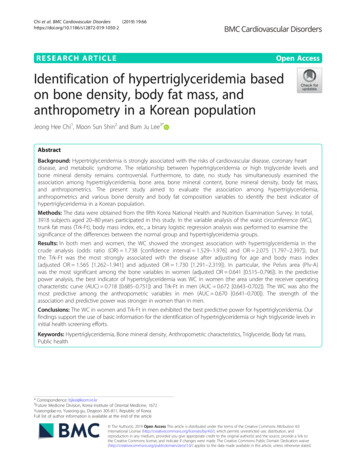
Li et al. Cardiovascular Diabetology(2022) 21:105Page 8 of 12TyG index level. Specifically, the groups with the highestincidence rate of CVD were in the highest tertile of bothbaseline TyG index and TyG index variability (7.29 per1000 person-years).Absolute risk difference for CVD by TyG index levelsand variabilityIn terms of absolute risk difference, participants in thehighest tertile of baseline TyG, mean TyG, and TyGindex variability were associated with 25.3 (95% CI 12.0–38.6), 34.3 (95% CI 20.2–48.3), and 6.3 (95% CI 0.6–12.1)more cases of CVD per 1000 population over 10 years,respectively, compared with participants in Tertile 1Table 3 Absolute risk difference (per 1000 population over 10 years) of cardiovascular disease by the baseline, mean, and variability ofTyG indexPredicted incidence per 1000 population over 10 yearsaAbsolute risk difference per1000 population over 10 yearsbBaseline TyG indexTertile 151.2 (47.0 to 55.8)ReferenceTertile 262.0 (57.9 to 66.3)10.7 (4.8 to 16.7)Tertile 376.6 (67.3 to 87.1)25.3 (12.0 to 38.6)Mean TyG indexTertile 148.5 (44.4 to 53.0)ReferenceTertile 260.5 (56.5 to 64.9)12.0 (6.2 to 17.8)Tertile 382.8 (72.8 to 94.3)34.3 (20.2 to 48.3)56.6 (52.8 to 60.8)ReferenceTyG index variabilityTertile 1Tertile 258.7 (54.7 to 62.9)2.1 ( 3.6 to 7.7)Tertile 363.0 (68.9 to 67.3)6.3 (0.6 to 12.1)TyG: triglyceride-glucoseaCalculated as CIFt 10 1000, where the predicted 10-year CIF (cumulative incidence function) of CVD was estimated from the flexible parametric survival models,which was standardized to the baseline variable (covariates in Model 3 for baseline and mean TyG index, and covariates in Model 4 for TyG index variability)bCalculated as the difference between the predicted incidence per 1000 population over 10 years across the baseline, mean, and variability of TyG index tertilesFig. 4 Adjusted (standardized) cumulative incidence curve for cardiovascular disease over 10-years according to baseline, mean, and variability oftriglyceride-glucose index
Li et al. Cardiovascular Diabetology(2022) 21:105(Table 3). The standardized cumulative incidence curvesfor CVD by tertiles of baseline TyG, mean TyG and TyGindex variability were displayed in the Fig. 4.Predicting CVD risk by baseline TyG index level and TyGindex variabilityThe addition of the baseline TyG index level and TyGindex variability to a clinical model including age, sex,education, income, current smoking, current drinking,physical activity, body mass index, diabetes, hypertension, chronic kidney disease, hs-CRP, hypercholesterolaemia, LDL-C, and HDL-C increased the C-statisticfrom 73.56 to 73.70% (difference, 0.136%; P 0.044);and there was a significant reclassification improvement (continuous NRI 10.87%, 95% CI 6.89% to15.27%) (Table 4).Sensitivity analysesThe relati
were linked to the Municipal Social Insurance Institu-tion and the Hospital Discharge Register for incidence of CVD, which cover all the Kailuan study participants. To further identify potential CVD cases, we reviewed the discharge lists from the 11 hospitals during 2006-2019 and asked for a history of CVD via a questionnaire dur-