Transcription
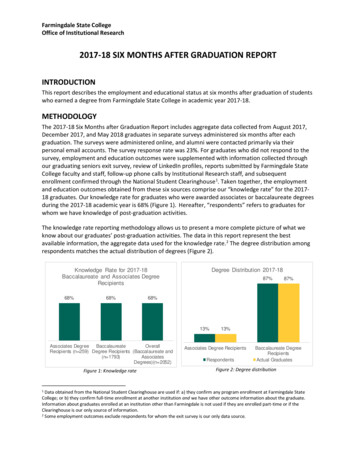
Farmingdale State CollegeOffice of Institutional Research2017-18 SIX MONTHS AFTER GRADUATION REPORTINTRODUCTIONThis report describes the employment and educational status at six months after graduation of studentswho earned a degree from Farmingdale State College in academic year 2017-18.METHODOLOGYThe 2017-18 Six Months after Graduation Report includes aggregate data collected from August 2017,December 2017, and May 2018 graduates in separate surveys administered six months after eachgraduation. The surveys were administered online, and alumni were contacted primarily via theirpersonal email accounts. The survey response rate was 23%. For graduates who did not respond to thesurvey, employment and education outcomes were supplemented with information collected throughour graduating seniors exit survey, review of LinkedIn profiles, reports submitted by Farmingdale StateCollege faculty and staff, follow-up phone calls by Institutional Research staff, and subsequentenrollment confirmed through the National Student Clearinghouse 1. Taken together, the employmentand education outcomes obtained from these six sources comprise our “knowledge rate” for the 201718 graduates. Our knowledge rate for graduates who were awarded associates or baccalaureate degreesduring the 2017-18 academic year is 68% (Figure 1). Hereafter, “respondents” refers to graduates forwhom we have knowledge of post-graduation activities.The knowledge rate reporting methodology allows us to present a more complete picture of what weknow about our graduates’ post-graduation activities. The data in this report represent the bestavailable information, the aggregate data used for the knowledge rate. 2 The degree distribution amongrespondents matches the actual distribution of degrees (Figure 2).Degree Distribution 2017-18Knowledge Rate for 2017-18Baccalaureate and Associates DegreeRecipients68%68%87%68%13%Associates Degree BaccalaureateOverallRecipients (n 259) Degree Recipients (Baccalaureate and(n 1793)AssociatesDegrees)(n 2052)Figure 1: Knowledge rate87%13%Associates Degree RecipientsRespondentsBaccalaureate DegreeRecipientsActual GraduatesFigure 2: Degree distribution1 Data obtained from the National Student Clearinghouse are used if: a) they confirm any program enrollment at Farmingdale StateCollege; or b) they confirm full-time enrollment at another institution and we have other outcome information about the graduate.Information about graduates enrolled at an institution other than Farmingdale is not used if they are enrolled part-time or if theClearinghouse is our only source of information.2 Some employment outcomes exclude respondents for whom the exit survey is our only data source.
EXECUTIVE SUMMARYEMPLOYMENT STATUSBaccalaureate Degree Recipients 94% of respondents are working and/or continuing their education. The majority (88%) are onlyworking or working while continuing their education.88% are employed by a company, self-employed, serving in the military, or completing aninternship.o Of those who are employed, 73% are employed full-time, 22% are employed part-time,and 3% are self-employed.o 71% of employed respondents are working in a new job related to their degree (39%) orcontinuing in a related job (32%). 25% are working in a new unrelated job (6%) orcontinuing in an unrelated job (19%). The rest are self-employed (3%), completing aninternship (1%) or serving in the military ( 1%).20% of employed respondents reported salaries of at least 60,000 (mainly attributable to Nursingalumni). 38% reported salaries of 40,000 or more.More than two-thirds of employed respondents were very satisfied (30%) or satisfied (40%) withtheir preparation at Farmingdale State College.o This percentage increased to 79% among survey respondents working in a job related totheir degree.Associates Degree Recipients 98% of respondents are continuing their education and/or are working. Most (76%) are onlyworking or working while continuing their education, but more than 20% are only attendingschool.78% are employed by a company, self-employed, or completing an internship.o Of those who are employed, 33% are employed full-time, 52% are employed part-time,7% are self-employed, 7% are completing an internship, and 2% are engaged in full-timepublic service.o 37% of employed respondents are working in a new job related to their degree (20%) orcontinuing in a related job (17%). 48% are working in a new unrelated job (7%) orcontinuing in an unrelated job (41%). The rest are self-employed (7%), completing aninternship (7%) or engaged in full-time public service (2%).22% of employed respondents reported salaries of 40,000 or more, primarily attributable toDental Hygiene and Medical Laboratory Technology graduates.58% of employed respondents are either very satisfied (21%) or satisfied (37%) with theirpreparation at Farmingdale State College.o This percentage increased to 69% among survey respondents working in a job related totheir degree.EMPLOYMENT LOCATION (ALL RESPONDENTS) 95% of employed graduates are employed in the New York City metropolitan area, with themajority (82%) working on Long Island.2
INTERNSHIPS (BACCALAUREATE GRADUATES ONLY) 32% of respondents reported doing an internship while a student at Farmingdale State College.41% of respondents who did an internship got their internship either through a FarmingdaleState College academic department, through Farmingdale State College’s InternshipCoordinator, or through staff members at Farmingdale State College.53% of respondents who did an internship were offered a permanent position at the companywhere they did an internship.CONTINUING EDUCATIONBaccalaureate Degree Recipients More than one-third of baccalaureate graduates are continuing or plan to continue their studiesin another formal degree program.Of those with specific plans, most are pursuing an MBA or other master’s degree. The majorityare studying full-time.Associates Degree Survey Respondents More than half of associates degree recipients are continuing or plan to continue their studies inanother formal degree program.o Of those with specific plans, most are pursuing a baccalaureate degree, and most arestudying full-time.o Most plan to pursue their baccalaureate degree at Farmingdale.LIVING AND WORKING ON LONG ISLAND (ALL RESPONDENTS) Half of respondents (51%) reported that Long Island salaries in their fields are competitive withor better than in other regions; more than one-third (36%) were not sure.Nearly half of respondents (49%) indicated that Long Island businesses are adjusting to industrytrends, but many (41%) were unsure about this.More than half of respondents (59%) plan to remain on Long Island or in the New York metroarea.o Those who don’t plan to remain cited taxes and the cost of housing/living as reasons forleaving. Those who have already left cited the cost of housing/living and better careeropportunities elsewhere.48% of respondents live in Suffolk County; 39% live in Nassau County. 63% of respondents livewith their parents.Most (71%) respondents think Long Island is a good place to raise a family.o Those who don’t think so most often cited the cost of housing/living (100%) and taxes(88%) as reasons. More than half also cited traffic and overpopulation.3
KEY FINDINGSDEGREES EARNEDBaccalaureate Degree RecipientsRespondents received degrees in majors from the School of Arts and Sciences (24%), School of Business(42%), School of Engineering Technology (26%), and School of Health Sciences (8%), which is similar tothe actual degree distribution (Figure 3). See Appendix A: Table A1 for response and knowledge rates bymajor for baccalaureate degree recipients.Distribution of Baccalaureate Degrees by School 2017-1842%24%39%26%26%25%8%Arts & SciencesBusinessRespondents (n 1215)Engineering Technology10%Health SciencesActual Graduates (n 1793)Figure 3: Baccalaureate degrees by schoolAssociates Degree RecipientsRespondents received degrees from the School of Arts and Sciences (78%), School of Business (5%),School of Engineering Technology (2%), and School of Health Sciences (16%), which is similar to theactual degree distribution (Figure 4). See Appendix A: Table A2 for response and knowledge rates bymajor for associates degree recipients.Distribution of Associate's Degrees by School 2017-1878%75%16%5%Arts & Sciences6%BusinessRespondents (n 176)2%18%2%Engineering TechnologyActual Graduates (n 259)Figure 4: Associates degrees by schoolHealth Sciences
EMPLOYMENT STATUS AND EMPLOYMENT RELATION TO MAJORBaccalaureate Degree RecipientsThe majority (88%) of respondents are employed by a company, self-employed, serving in the military,or completing an internship at the six-months-out point after graduation. 8% are unemployed andlooking for work and 4% were unemployed but not seeking employment (Figure 5). See Appendix B:Table B1 for a list of reported job titles and employers by major.Employment Status of Baccalaureate Degree RecipientsSix-Month-Out Survey plus Follow-Up (n 642)100%88%Other employment, 4%80%Part-time, 20%60%40%Full-time, 64%20%12%Not seeking w ork, 4%Seeking w ork, 8%0%EmployedFull-timePart-timeNot employedOther employmentSeeking workNot seeking workFigure 5: Primary employment status of baccalaureate degree recipientsMore than three-quarters (81%) of employed respondents are working at a job that is closely related(54%) or somewhat related (27%) to the degree they earned at Farmingdale State College (Figure 6).How closely is your current job related to the degree or certificate youreceived from Farmingdale?Employed Baccalaureate Degree RecipientsSix-Month-Out Survey plus Follow-Up (n 511)54%27%19%Not relatedSomewhat relatedClosely relatedFigure 6: Job relation to degree among employed baccalaureate graduates5
Of the respondents whose employment is related to their degree, 83% are working full-time, 13% areworking part-time, and 3% have some other employment status.Associates Degree Recipients78% of respondents are employed by a company, self-employed, completing an internship, or engagedin full-time public service at the six-months-out point after graduation. 10% are unemployed and lookingfor work, and 12% were not looking for work (Figure 7). See Appendix B: Table B2 for a list of reportedjob titles and employers by major.Employment Status of Associates Degree RecipientsSix-Month-Out Survey plus Follow-Up (n 59)90%78%80%Other employment, 12%70%60%50%Part-time, 41%40%30%22%20%Not seeking w ork, 12%Full-time, 25%10%Seeking w ork, 10%0%Not employedEmployedFull-timePart-timeOther employmentSeeking workNot seeking workFigure 7: Primary employment status of associates degree recipientsMore than half (55%) of employed respondents are working at a job that is closely related (29%) orsomewhat related (26%) to the degree they earned at Farmingdale State College (Figure 8).How closely is your current job related to the degree or certificate youreceived from Farmingdale?Employed Associates Degree RecipientsSix-Month-Out Survey plus Follow-Up (n 38)45%Not related26%29%Somewhat relatedClosely related6
Figure 8: Job relation to degree among employed associates graduatesOf the respondents whose employment is related to their degree, 52% are working full-time, 29% areworking part-time, 10% are self-employed, and 10% have some other employment status.WHEN EMPLOYMENT WAS SECUREDBaccalaureate Degree RecipientsNearly two-thirds (67%) of employed respondents secured their job prior to graduation fromFarmingdale State College. Among those with positions related to their degree, 62% secured their jobprior to graduation (Figure 9).Employment Secured Before GraduationEmployed Baccalaureate Degree Recipients65%62%Employed baccalaureate degree recipients (n 519)Employed baccalaureate degree recipients in jobsrelated to degree (n 412)Figure 9: When employment was secured by employed baccalaureate degree recipientsAssociates Degree RecipientsNearly three-quarters (72%) of employed respondents who are employed secured their job prior tograduation from Farmingdale State College. Among those with positions related to their degree, 65%secured their job prior to graduation (Figure 10).Employment Secured Before GraduationEmployed Associates Degree Recipients72%65%Employed Associates degree recipients (n 36)Employed Associates degree recipients in jobs relatedto degree (n 20)Figure 10: When employment was secured by employed associates degree recipients7
ANNUAL SALARY RANGE (BACCALAUREATE GRADUATES ONLY)Baccalaureate Degree RecipientsTwenty percent of employed respondents reported salaries of at least 60,000, attributable mainly toNursing graduates. 37% of employed respondents reported salaries of 40,000 or more, and 19%reported salaries between 20,000 and 39,999. Six percent reported salaries below 20,000, while 36%did not report their salaries (Figure 11).What is your current annual salary range?Employed Baccalaurate Degree Recipients (n 361) 60,000 20% 50,000 - 59,9998% 40,000 - 49,9999% 35,000 - 39,9996% 30,000 - 34,9997% 25,000 - 29,9993% 20,000 - 24,9993%Less than 20,0006%Prefer not to answer/no response36%Figure 11: Salary ranges for employed baccalaureate graduatesPREPAREDNESS FOR EMPLOYMENT (BACCALAUREATE GRADUATES ONLY)Baccalaureate Degree RecipientsMore than two-thirds (70%) of employed respondents were very satisfied (30%) or satisfied (40%) withtheir preparation at Farmingdale State College (Figure 12).How satisfied have you been overall with your preparation at FarmingdaleState College for professional employment?Employed Baccalaureate Degree Recipients (n 287)30%Very y dissatisfiedFigure 12: Satisfaction with preparation for employment, baccalaureate graduatesAmong respondents working in a job related to their major, nearly 80% (79%) of baccalaureate degreerecipients were very satisfied (36%) or satisfied (43%) with their preparation at Farmingdale StateCollege for professional employment.LOCATION OF EMPLOYMENTOf employed graduates who provided employment location information, 96% are working in New YorkState, 95% in the New York City metropolitan area, and 82% on Long Island.8
INTERNSHIPS (BACCALAUREATE GRADUATES ONLY)Approximately one-third (32%) of respondents reported doing an internship while a student atFarmingdale State College. Less than half (41%) of respondents who did an internship got theirinternship either through a Farmingdale State College academic department, through Farmingdale StateCollege’s internship coordinator, or through staff members at Farmingdale State College. More than half(53%) of respondents who did an internship were offered a permanent position at the company wherethey did an internship.CONTINUING EDUCATIONBaccalaureate Degree RecipientsMore than one-third (37%) of respondents are continuing or plan to continue their education. The mostfrequently identified institution where these respondents are continuing their education is Stony BrookUniversity. Graduates from the School of Arts and Sciences are more likely than graduates from theSchool of Business, the School of Engineering Technology, or the School of Health Sciences to continuetheir education. For a list of institutions where graduates are pursuing additional education, seeAppendix C: Table C1.Associates Degree RecipientsMore than half of associates degree recipients are continuing or plan to continue their education.Subsequent enrollment confirmed through the National Student Clearinghouse, combined withrespondents’ stated plans indicates that at least 59% of all associates degree recipients are continuing orplan to continue their education. Graduates from the School of Arts and Sciences are more likely thanothers to continue their education. The most frequently identified institution where these respondentsare continuing their education is Farmingdale State College. For a list of institutions where graduates arepursuing additional education, see Appendix C: Table C2.SUBSEQUENT DEGREEBaccalaureate Degree RecipientsAmong respondents for whom we have detailed information, most (80%) are pursuing an MBA (12%) orother masters degree (68%). Five percent are pursuing a professional degree in a medical field, and 10%are pursuing additional education at the undergraduate level. For a list of degrees and programsrespondents are pursuing, see Appendix D: Table D1.Subsequent Degree Types Pursued by Baccalaureate Degree Recipients(n 312)68%12%Masters, besidesMBA (e.g., MA,MS, MSW)MBA5%2%3%6%4%Medical Degree(MD, DO, DDS,DVM, PharmD,DC, PA, DPT)Law DegreePhD or EdDBachelorsCertificateFigure 13: Degrees pursued by baccalaureate graduates9
Associates Degree RecipientsAmong respondents for whom we have detailed information, nearly all (99%) are pursuingbaccalaureate degrees. Although a small number of respondents reported plans to obtain higherdegrees, they would need a baccalaureate degree first. For a list of degrees and programs respondentsare pursuing, see Appendix D: Table D2.Subsequent Degree Types Pursued by Associates Degree Recipients(n 132)99%1%BachelorsPhD or EdDFigure 14: Degrees pursued by associates graduatesFULL- OR PART-TIME STUDYBaccalaureate Degree RecipientsAmong respondents continuing their education, most (62%) of those who provided detailed informationare studying full-time (Figure 15).Associates Degree RecipientsAmong respondents continuing their education, three-quarters (76%) of those who provided detailedinformation are studying full-time (Figure 15).Full-Time vs. Part-Time Study for Graduates Continuing ccalaureate Degree Recipients (n 71)Part-timeAssociates Degree Recipients (n 127)Figure 15: Full-time vs. part-time study10
LIVING AND WORKING ON LONG ISLAND (ALL RESPONDENTS)Approximately half (51%) of respondents reported that Long Island salaries in their fields arecompetitive with or better than in other regions; more than one-third (36%) expressed uncertaintyabout how salaries on Long Island compare with those in other regions (see Figure 16).Nearly half (49%) of respondents indicated that businesses on Long Island are adjusting to industrytrends in business practices, technology, and new products/services, but many (41%) respondents werenot sure (see Figure 17).In your experience, how do salaries onLong Island in your field compare withother regions? (n 358)21%36%30%Do you believe businesses on LongIsland are adjusting to industry trendsin business practices, technology, andnew product/service development?(n 358)13%49%Better than CompetitiveNotother regions with other competitiveregionswith otherregions41%Not sure10%YesFigure 16: Salaries on Long Island vs. other regionsNoNot sureFigure 17: Long Island businesses' adjustment to trendsMost respondents (59%) plan to pursue their careers on Long Island or within the New York metro area(Figure 18). Among those who indicated that they do not plan to remain in the area, the most commonlycited reason was taxes, followed closely by the cost of housing/living (Figure 19). For those who havealready left the area, the most common reasons were the cost of housing/living (59%) and to pursuebetter career opportunities elsewhere (59%).Do you hope/expect to remain on LongIsland or the metro New York City areato pursue your career? (n 374)Why do you NOT expect to remain onLong Island or in the New York Cityarea to pursue your career (check allthat apply)? (n 35)86%89%59%54%34%27%11%9%YesNo5%Not sureI do not workin the LI/NYCareaFigure 18: Graduates’ plans to remain in the area for workCost ofhou sin g/livingTaxesTrafficBetter care eropp ortu nitieselsewhereOther*Responses are not mutually exclusiv e. Percentages ref lectproportion of respondents selecting each answer.Figure 19: Reasons for pursuing career elsewhere
The majority (87%) of respondents live in either Nassau (39%) or Suffolk (48%) counties, with anadditional 7% residing in New York City or elsewhere in New York State (Figure 20).Where are you living? (n 387)48%39%6%NassauSuffolkNYC (fiveboroughs)5%1%2%Elsewhere in New Outside New YorkYork StateState (pleasespecify)Prefer not toanswerFigure 20: Geographic residence of graduatesNearly two-thirds of respondents (63%) live with their parent(s). Living with roommates other thanspouses or partners was the least common response (5%) (Figure 21).What are your housing arrangements? (n 387)63%16%Parent(s)home/apartmentOwn home/apartment12%Home/apartmentshared withspouse/partner5%4%Home/apartmentshared withroommate(s)Prefer not to answerFigure 21: Graduates' housing arrangements12
Most respondents (71%) think that Long Island is a good place to raise a family; only 16% of respondentsdisagreed.Do you think Long Island is a good place to raise a family? (n 387)71%Yes16%13%NoNot sureFigure 22: Raising a family on Long IslandAmong respondents who don’t think Long Island is a good place to raise a family, all cited the cost ofhousing/living, and most (88%) cited taxes. More than half also identified traffic (58%) andoverpopulation (54%) as reasons why Long Island is not a good place to raise a family.Why do you think Long Island is NOT a good place to raise a family (checkall that apply)? (n 59)100%88%58%54%34%22%15%10%Cost of housing/ livingTaxesTrafficOverpopulated Bureaucracy / ponses are not mutually exclusiv e. Percentages ref lect proportion of respondents selecting each answer.Figure 23: Reasons why Long Island is not a good place to raise a family13Other
APPENDIX AOVERVIEW OF GRADUATES: RESPONDENTS VS. ACTUAL DEGREES GRANTEDTable A1: Baccalaureate Degree Survey RespondentsDegree/MajorAeronautical Science: Professional PilotApplied EconomicsApplied MathematicsApplied PsychologyArchitectural Engineering TechnologyAviation AdministrationBioscienceBusiness ManagementComputer Engineering TechnologyComputer Programming & Information SystemsConstruction Management EngineeringCriminal Justice: Law Enforcement TechnologyDental HygieneElectrical Engineering TechnologyGlobal Business ManagementHorticultural Technology ManagementIndustrial Technology - AutomotiveIndustrial Technology - Facility ManagementManufacturing Engineering TechnologyMechanical Engineering TechnologyMedical TechnologyNursingProfessional CommunicationsScience, Technology & SocietySecurity SystemsSoftware TechnologySport ManagementTelecommunications TechnologyVisual 63%76%0%70%0%84%68%* Respondents reported in highest (if multiple degrees at different levels) or last (if multiple degrees at same level) degree andmajor; each respondent is counted only once.**Source for actual degrees is Banner and includes all degrees awarded; some graduates are counted more than once.
Table A2: Associate Degree Survey RespondentsDegree/MajorAutomotive Engineering TechnologyCriminal Justice - Law EnforcementDental HygieneLiberal Arts & SciencesMechanical Engineering TechnologyMedical Laboratory TechnicianGeneral HorticultureLandscape 8 0%100%50%67%0%100%0%100%40%50%* Respondents reported in highest (if multiple degrees at different levels) or last (if multiple degrees at same level) degree andmajor; each respondent is counted only once.**Source for actual degrees is Banner and includes all degrees awarded; some graduates are counted more than once.Table A3: Certificate Survey RespondentsDegree/MajorAccountingAdvanced ProgrammingComp Sys Tech-Bus Prog & SysComputer Information SystemsManagementMarketingOrnamental HorticultureSciences for the Health 8 AllRespondents110000136*1120101410*12311111020*** Respondents reported in highest (if multiple degrees at different levels) or last (if multiple degrees at same level) degree andmajor; each respondent is counted only once.**Source for actual degrees is Banner and includes all degrees awarded; some graduates are counted more than once.15
APPENDIX BREPORTED JOB TITLES & EMPLOYERS BY MAJORTable B1: Baccalaureate Degree RespondentsDegree/MajorAeronautical Science:Professional Pilot, BSApplied Economics, BSApplied Mathematics, BSApplied Psychology, BS# Gradswith JobDetails66217Count(if )Job TitleEmployerFLIGHT INSTRUCTORFARMINGDALE STATE COLLEGE3FLIGHT INSTRUCTORNASSAU FLYERS2CREW MEMBERTRADER JOESACCOUNT MANAGERAPPLECREDIT ASSOCIATEHONEYWELLSTRATEGY ASSOCIATENOT SPECIFIEDSALES & SERVICE SUPERVISORPEOPLES UNITED BANKSERVICE MANAGERSAM TELLASSISTANTSHIPSENIOR PRODUCT & DELIVERYANALYSTST JOHNSCASHIERWENDYSCUSTOMER REPRESENTATIVEATLANTIC NISSANTEACHERS ASSISTANTMARKETING AND ADVERTISINGASSOCIATEBOCESRECEPTIONISTEASTERN ATHLETIC CLUBEXPRESS EMPLOYMENTPROFESSIONALSSTAFFING CONSULTANTINDEPENDENT MERCHANT GROUPCIUFFO CABINETRYTEACHERS AIDEDIRECTOR OF SERVICE ANDENTITLEMENTH FRANK CAREY HSRESIDENTIAL COUNSELORMERCY HAVEN INCPRESCHOOL TEACHERMISS DAWNS CHILDCARERECRUITING ASSISTANTNOOR STAFFING GROUPASSISTANT MANAGERNOT SPECIFIEDNANNYNOT SPECIFIEDPETCARE SPECIALISTHUMAN RESOURCESADMINISTRATIVE ASSISTANTBEHAVIORAL HEALTHASSOCIATEPETSMARTASSOCIATE MANAGERUNITED ARTIST REGAL CINEMAYAI EMPLOYEE PER DIEMYAI ORGANIZATIONIVCISCO FAMILY OF SERVICESSOUTH OAKS HOSPITAL
Degree/MajorArchitectural EngineeringTechnology, BSAviation Administration, BS# Gradswith JobDetails1117Job TitleEmployerDRAFTERBOBBY K ARCHITECTSDRAFTSMAN/JR ARCHITECTBOBBY K ARCHITECTSSTAFF DESIGNERH2M ARCHITECTS ENGINEERSDRAFTERHM LOKE ENGINEERINGENGINEER DRAFTERHM LOKE ENGINEERINGASSOCIATE ENGINEERPALOMA MODULAR BUILDINGSESTIMATORPHILIP ROSS INDUSTRIESJUNIOR ARCHITECTTHE LIRO GROUPCOMMISSIONING ENGINEERWSP PARSONS BRINCKERHOFFFLIGHT DISPATCHERACADEMY OF AVIATIONAIRMANAIR FORCERAMP AGENTAMERICAN AIRLINESCAMP SYSTEMS INTERNATIONALINCTECHNICAL SERVICE ANALYSTBioscience, BS28LEGAL ADMINISTRATIONCLIENT SERVICECOORDINATORFBFG LAWFLIGHT INSTRUCTORFLIGHT SCHOOLADMINISTRATORGLOBAL AVIATIONCNA NURSING ASSISTANTMATHER HOSPITALLINE SERVICE TECHNICIANMILLION AIRLINE SERVICE TECHNICIANCLIENT SERVICEREPRESENTATIVEREPUBLIC JET CENTER LLCRADIO OPERATORROCKWELL COLLINSREAL ESTATE AGENTSCOPE REALTYLINE SERVICE TECHNICIANSHELTAIR AVIATIONCOORDINATORSIMBA ACADEMY2D LTUSAFPARAMEDICAMITYVILLE FIRE DEPARTMENTADMINISTRATION CLERKAOSCO INCMEDICAL ASSISTANTBRANCH MEDICAL ASSOCIATESSENIOR MEDICAL ASSISTANTCITYMDMANAGERCONSTRUCTION COMPANYVETERINARY ASSISTANTDEER PARK ANIMAL HOSPITALCOUNSELORESBOCESBUTCHER/DRIVERFARMINGDALE MEAT MARKETMEDICAL ASSISTANTMARJORIE C RAVITZ DPM PCMEDICAL ASSISTANTNORTHWELL HEALTHNURSING ASSISTANTNORTHWELL HEALTHPHARMACY TECHNICIANNORTHWELL HEALTH17GAMA AVIATIONLONG ISLAND AVIATORS LLCREPUBLIC JET CENTER LLCCount(if )3
Degree/Major# Gradswith JobDetailsJob TitleSENIOR PATIENT CARECOORDINATOREmployerMEDICAL ASSISTANTNOT SPECIFIEDMEDICAL ASSISTANTNOT SPECIFIEDNYS PARKS & RECREATIONHISTORICAL PRESERVATIONDEPARTMENTPARK & RECREATION AIDEBusiness Management, BS198NORTHWELL HEALTHOPTOMETRIC TECHNICIANCLINICAL SUPPORTCOORDINATORREGULATORY AFFAIRSCOORDINATOROFFICE OF DR CORREALECO-OWNERPUMP ACTIVE INCPHARMACY TECHNICIANRITE AIDMEDICAL ASSISTANTROCKVILLE DERMATOLOGYVETERINARY ASSISTANTSHIRLEY VETERINARY HOSPITALINFORMATION TECHNOLOGYST ANTHONYS HIGH SCHOOLSHIFT SUPERVISORMEDICAL ASSISTANTSTARBUCKSSTONY BROOK UNIVERSITYHOSPITALCLERKSTOP & SHOPPHARMACY TECHNICIANWALGREENSSALES REPRESENTATIVECLIENT SERVICE ACCOUNTCOORDINATOR2020 COMPANIESTEAM LEADIMPLEMENTATIONSCONSULTANTPFIZERPIPING ROCK HEALTH PRODUCTSACCESS DIRECT SYSTEMSACCOMMODATIONS PLUSINTERNATIONALACCOUNTANTS WORLD LLCMANAGING PARTNERACCOUNTINGKEYACCOUNTS SPECIALISTINVENTORY CONTROLSPECIALISTADECCORECEPTIONCOMMUNITY SUPPORTPROFESSIONALADVANTAGE VISIONINSIDE SALES ASSISTANTALA NORTH AMERICA INCMANAGERALDO GROUPSOCIAL MEDIA MARKETINGALLSTATELEARNING SPECIALISTALTICE USA (OPTIMUM)SENIOR DATA ANALYSTJUNIOR FINANCIAL ADVISORCLIENT RELATIONSHIPMANAGERALTICE USA (OPTIMUM)AMERICAN HONDA MOTORCOMPANY INCAMERIPRISE FINANCIAL SERVICESINCAMERIPRISE FINANCIAL SERVICESINCRESTARAUNT MANAGERAMITY ALESLOGISTICSANNIERECALL SPECIALIST18ADVANCED ENERGYAHRC NYCCount(if )
Degree/Major# Gradswith JobDetailsJob TitleEmployerWAITERANTHONYS COAL FIRED PIZZALINEMAN APPRENTICEASPLUNDHRECRUITERATC TRAVELERSERVICE MANAGER ASSISTANTATW REFRIGERATIONTAX INTERNBDO USA LLPRECEPTIONISTBERDON LLPSALES PERSONCORPORATE RELATIONSBEST BUYBETHPAGE FEDERAL CREDITUNIONBARTENDERBK GROSSOSBOOKKEEPERBOOKKEEPER360BOUNCE! TRAMPOLINE SPORTSFRANCHISE GROUPEVENT PLANNERSERVERPRODUCTION PLANNERBRIO TUSCAN GRILLEBROADRIDGE FINANCIALSOLUTIONS INCOFFICE ADMINISTRATORBROADWAY GOURMETPRO-SHOP STAFFBROCKVILLE COUNTRY CLUBHOSPITALITY MANAGEMENTBUFFALO WILD WINGSLOGISTICS ANALYSTCANON SOLUTIONS AMERICARELATIONSHIP BANKERCAPITAL ONEASSISTANTEMERGENCY MEDICALTECHNICIANCENTRAL ENTERTAINMENT GROUPWAREHOUSE MANAGERCIPLA PHARMACEUTICALSSALES AND MARKETINGSECOND ASSISTANT GOLFPROFESSIONALHUMAN RESOURCESASSOCIATECOACHFRONT OFFICE MANAGERSUPERVISOR AT CONNETQUOTSTATE PARKCOMMUNITY CHIROPRACTIC CAREPURCHASING ASSISTANTCONSUMERS KITCHEN AND BATHSNOT SPECIFIEDASSISTANT MARKETINGMANAGERQUALITY ASSURANCEENGINEERCOSTCOGENERAL MANAGERINVESTIGATORCUBESMARTDANIEL J HANNON & ASSOCIATESINCADMINISTRATIVE ASSISTANTDAVITA DIALYSISPROJECT MANAGERDCC TRANSIT WORKS INCSERVERDEL FUEGOD
Of those with specific plans, most are pursuing an MBA or other master's degree. The majority are studying full-time. . 48% of respondents live in Suffolk County; 39% live in Nassau County. 63% of respondents live with their parents. Most (71%) respondents think Long Island is a good place to raise a family. .