Transcription
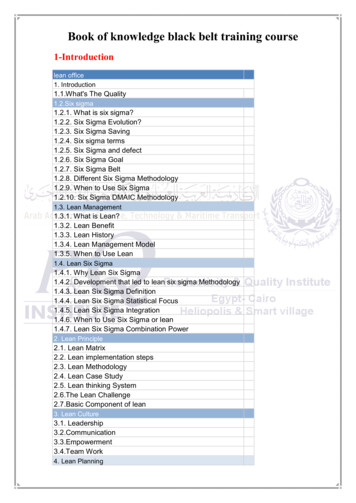
Book of knowledge black belt training course1-Introductionlean office1. Introduction1.1.What's The Quality1.2.Six sigma1.2.1. What is six sigma?1.2.2. Six Sigma Evolution?1.2.3. Six Sigma Saving1.2.4. Six sigma terms1.2.5. Six Sigma and defect1.2.6. Six Sigma Goal1.2.7. Six Sigma Belt1.2.8. Different Six Sigma Methodology1.2.9. When to Use Six Sigma1.2.10. Six Sigma DMAIC Methodology1.3. Lean Management1.3.1. What is Lean?1.3.2. Lean Benefit1.3.3. Lean History1.3.4. Lean Management Model1.3.5. When to Use Lean1.4. Lean Six Sigma1.4.1. Why Lean Six Sigma1.4.2. Development that led to lean six sigma Methodology1.4.3. Lean Six Sigma Definition1.4.4. Lean Six Sigma Statistical Focus1.4.5. Lean Six Sigma Integration1.4.6. When to Use Six Sigma or lean1.4.7. Lean Six Sigma Combination Power2. Lean Principle2.1. Lean Matrix2.2. Lean implementation steps2.3. Lean Methodology2.4. Lean Case Study2.5. Lean thinking System2.6.The Lean Challenge2.7.Basic Component of lean3. Lean Culture3.1. Leadership3.2.Communication3.3.Empowerment3.4.Team Work4. Lean Planning
5. Lean Concept6. Lean Seven Waste.6.1.MUDA, MURA, MURI6.2.Over 6.Motion6.7.Correction6.8.Over Processing6.9.People Utilization7. Lean and Work Cycle8. Lean Tools9. Lean Tool Diagram10. 5s11. Visual Management12. Standardize Work13. Cellular Layout & Spaghetti DiagramBookmark not defined.14. Poka Yoke15.Mini-tab training15.1 Mini-tab windows15.1.1 Example15.2. Menu structure15.2.1 Example15.3.Graph types & purpose15.3.1 Example16. Statistics16.1 course objective16.2 Quality management16.3 What is statistics?16.4 the nature of probability and statistics16.4.1 descriptive and inferential statistics16.4.2 variables and types of data16.4.3 data collection and sampling techniques16.5 frequency distribution and graphs16.5.1 organizing data16.5.1.1 categorical frequency distributions16.5.1.2 grouped frequency distributions16.5.2 histograms, frequency polygons, and ogives16.5.3 other types of graphs16.5.3.1 bar graphs16.5.3.2 pareto charts16.5.3.3 the time series graph16.5.3.4 the pie graphs16.6 data description16.6.1 measures of central tendency
16.6.1.1 the mean16.6.1.2 the median16.6.1.3 the mode16.6.1.4 the midrange16.6.1.5 the weighted mean16.6.2 measures of variation16.6.2.1 range16.6.2.2 population variance and standard deviation16.6.2.3 sample variation and standard deviation16.6.2.4 variance and standard deviation for grouped data16.6.2.5 coefficient of variation16.6.3 measures of position16.6.4 exploratory data analysis16.6.4.1 the five - number summary and boxplots16.7 probability and counting rules16.7.1 sample spaces and probability16.7.2 the addition rules for probability16.7.3 the multiplication rules and conditional probability16.7.4 counting rules16.7.5 probability and counting rules16.8 discrete probability distribution16.8.1 probability distributions16.8.2 mean, variance, standard deviation, and expectation16.8.3 the binomial distribution16.8.4 other types of distribution16.9 the normal distribution16.9.1 normal distribution19.9.2 application of the normal distribution16.9.3 the central limit theorem16.9.4 the normal approximation to the binomial distribution2-Main course1.0 Define Phase1.1 The Basics of Six Sigma1.1.1 Meanings of Six Sigma1.1.2 General History of Six Sigma & Continuous Improvement1.1.3 Deliverables of a Lean Six Sigma Project1.1.4 The Problem Solving Strategy Y f(x)1.1.5 Voice of the Customer, Business and Employee1.1.6 Six Sigma Roles & Responsibilities1.2 The Fundamentals of Six Sigma1.2.1 Defining a Process1.2.2 Critical to Quality Characteristics (CTQ’s)1.2.3 Cost of Poor Quality (COPQ)1.2.4 Pareto Analysis (80:20 rule)1.2.5 Basic Six Sigma Metricsa. including DPU, DPMO, FTY, RTY Cycle Time; deriving these
metrics1.3 Selecting Lean Six Sigma Projects1.3.1 Building a Business Case & Project Charter1.3.2 Developing Project Metrics1.3.3 Financial Evaluation & Benefits Capture1.4 The Lean Enterprise1.4.1 Understanding Lean1.4.2 The History of Lean1.4.3 Lean & Six Sigma1.4.4 The Seven Elements of Wastea. Overproduction, Correction, Inventory, Motion, Overprocessing, Conveyance, Waiting.1.4.5 5Sa. Straighten, Shine, Standardize, Self-Discipline, Sort2.0 Measure Phase2.1 Process Definition2.1.1 Cause & Effect / Fishbone Diagrams2.1.2 Process Mapping, SIPOC, Value Stream Map2.1.3 X-Y Diagram2.1.4 Failure Modes & Effects Analysis (FMEA)2.2 Six Sigma Statistics2.2.1 Basic Statistics2.2.2 Descriptive Statistics2.2.3 Normal Distributions & Normality2.2.4 Graphical Analysis2.3 Measurement System Analysis2.3.1 Precision & Accuracy2.3.2 Bias, Linearity & Stability2.3.3 Gage Repeatability & Reproducibility2.3.4 Variable & Attribute MSA2.4 Process Capability2.4.1 Capability Analysis2.4.2 Concept of Stability2.4.3 Attribute & Discrete Capability2.4.4 Monitoring Techniques3.0 Analyze Phase3.1 Patterns of Variation3.1.1 Multi-Vari Analysis3.1.2 Classes of Distributions3.2 Inferential Statistics3.2.1 Understanding Inference3.2.2 Sampling Techniques & Uses3.2.3 Central Limit Theorem3.3 Hypothesis Testing3.3.1 General Concepts & Goals of Hypothesis Testing3.3.2 Significance; Practical vs. Statistical
3.3.3 Risk; Alpha & Beta3.3.4 Types of Hypothesis Test3.4 Hypothesis Testing with Normal Data3.4.1 1 & 2 sample t-tests3.4.2 1 sample variance3.4.3 One Way ANOVAa. Including Tests of Equal Variance, Normality Testing andSample Size calculation, performing tests and interpretingresults.3.5 Hypothesis Testing with Non-Normal Data3.5.1 Mann-Whitney3.5.2 Kruskal-Wallis3.5.3 Mood’s Median3.5.4 Friedman3.5.5 1 Sample Sign3.5.6 1 Sample Wilcoxon3.5.7 One and Two Sample Proportion3.5.8 Chi-Squared (Contingency Tables)a. Including Tests of Equal Variance, Normality Testing andSample Size calculation, performing tests and interpretingresults.4.0 Improve Phase4.1 Simple Linear Regression4.1.1 Correlation4.1.2 Regression Equations4.1.3 Residuals Analysis4.2 Multiple Regression Analysis4.2.1 Non- Linear Regression4.2.2 Multiple Linear Regression4.2.3 Confidence & Prediction Intervals4.2.4 Residuals Analysis4.2.5 Data Transformation, Box Cox4.3 Designed Experiments4.3.1 Experiment Objectives4.3.2 Experimental Methods4.3.3 Experiment Design Considerations4.4 Full Factorial Experiments4.4.1 2k Full Factorial Designs4.4.2 Linear & Quadratic Mathematical Models4.4.3 Balanced & Orthogonal Designs4.4.4 Fit, Diagnose Model and Center Points4.5 Fractional Factorial Experiments4.5.1 Designs4.5.2 Confounding Effects4.5.3 Experimental Resolution5.0 Control Phase
5.1 Lean Controls5.1.1 Control Methods for 5S5.1.2 Kanban5.1.3 Poka-Yoke (Mistake Proofing)5.2 Statistical Process Control (SPC)5.2.1 Data Collection for SPC5.2.2 I-MR Chart5.2.3 Xbar-R Chart5.2.4 U Chart5.2.5 P Chart5.2.6 NP Chart5.2.7 X-S chart5.2.8 CumSum Chart5.2.9 EWMA Chart5.2.10 Control Methods5.2.11 Control Chart Anatomy5.2.12 Subgroups, Impact of Variation, Frequency of Sampling5.2.13 Center Line & Control Limit Calculations5.3 Six Sigma Control Plans5.3.1 Cost Benefit Analysis5.3.2 Elements of the Control Plan5.3.3 Elements of the Response Plan
Book of knowledge black belt training course 1-Introduction lean office 1. Introduction 1.1.What's The Quality . Six Sigma Evolution? 1.2.3. Six Sigma Saving 1.2.4. Six sigma terms 1.2.5. Six Sigma and defect 1.2.6. Six Sigma Goal 1.2.7. Six Sigma Belt 1.2.8. Different Six Sigma Methodology 1.2.9. When to Use Six Si
