Transcription
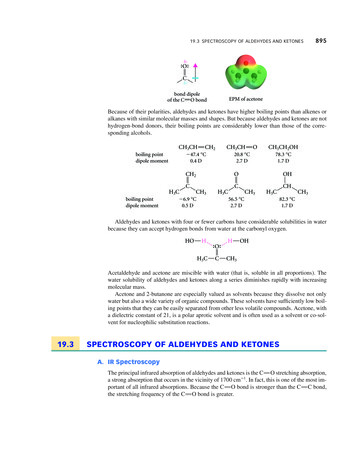
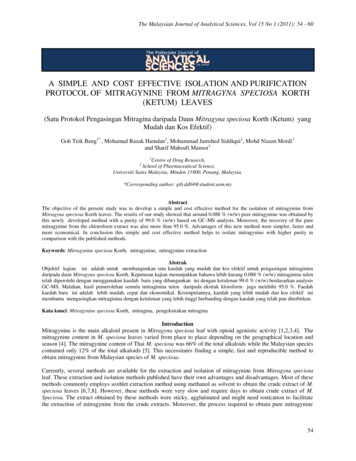
Chapter 1INTRODUCTION TO NMR SPECTROSCOPY1.1IntroductionNuclear magnetic resonance (NMR) is a spectroscopic technique that detects the energy absorbed by changes in the nuclear spin state. Theapplication of NMR spectroscopy to the study ofproteins and nucleic acids has provided unique information on the dynamics and chemical kineticsof these systems. One important feature of NMRis that it provides information, at the atomic level,on the dynamics of proteins and nucleic acids overan exceptionally wide range of time scales, rangingfrom seconds to pico-seconds. In addition, NMRcan also provide atomic level structural information of proteins and nucleic acids in solution (seeFig. 1.1), i.e. there is no need to crystallize thesample for NMR studies. Thus NMR provides amethod of obtaining structural information if theFigure 1.1. Protein strucmolecule cannot be crystallized or there is someture determined by NMRquestion regarding a structure obtained by X-ray spectroscopy. Four struccrystallography. Lastly, it is relatively easy to tures of a 130 residue prostudy protein-ligand interactions under physiologi- tein, derived from NMRcal conditions by simply adding ligand to the NMR constraints, are overlaid tosample of the unliganded protein.highlight the accuracy ofAlthough NMR is a powerful technique, it does structure determination byhave its limitations. First, almost all experiments NMR spectroscopy.require that the observed NMR absorption peaksare assigned to a particular atom in the protein. Although resonance assignment methods are well characterized, they do require considerable time for dataacquisition and analysis. Secondly, the size of the protein or nucleic acid thatcan be studied by NMR is limited. Assemblies with rotational correlation timeof greater than 25 ns (corresponding to a protein with a molecular weight of60 kDa) may be difficult to study at the detailed atomic level. However, morelimited NMR studies can be performed on much larger proteins and biologicalassemblies. Generally, it is necessary to label larger proteins with 13 C, 15 N,and perhaps 2 H, to successfully apply NMR techniques to such large systems.
2Introduction to NMR SpectroscopyLabeling of this type is most easily accomplished biosynthetically in either E.coli or in tissue culture (at a much higher expense). A rough indication of theisotopic labeling requirements as a function of protein size is given in Table1.1. Lastly, due to the small energy difference between the ground and excitedstate of the nuclear spins, NMR is a particularly insensitive technique. Proteinconcentrations on the order of 0.5 to 1 mM are typical, thus a single 0.4 mlNMR sample of a 20 kDa protein would require between 4 and 8 mg of protein.Fortunately, the techniques are not destructive and the sample can be used forother purposes.For most of this text we will employ a semi-classical model of the nuclearspins to obtain an intuitive understanding of many of the fundamental aspectsof modern NMR spectroscopy. In this chapter we will highlight a number ofimportant features of NMR spectroscopy, including:1. How energy states are created by the magnetic field,2. The relationship between the environment and the absorption energy,3. Coupling between nuclear spins.1.2Classical Description of NMR SpectroscopyThe basic phenomenon of nuclear magnetic resonance NMR spectroscopy issimilar to other forms of spectroscopy, such as visible spectroscopy. A photonof light causes a transition from the ground state to the excited state. Forexample, in the case of visible spectroscopy the absorption of a photon by anelectron causes the electron to move from its ground state orbital to an orbitalof higher energy, the excited state. In the case of NMR, the absorption of aradio-frequency photon promotes a nuclear spin from its ground state to itsexcited state.NMR spectroscopy differs in a number of important aspects from other formsof spectroscopy. First, the generation of the ground and excited NMR statesrequires the existence of an external magnetic field. This requirement is a veryimportant distinction of NMR spectroscopy in that it allows one to changethe characteristic frequencies of the transitions by simply changing the appliedmagnetic field strength. Second, the NMR excited state has a lifetime that is onthe order of 109 times longer than the lifetime of the excited electronic states.This difference in lifetimes follows directly from Einstein’s law for spontaneousemission that relates the lifetime of the excited state, τ , to the frequency of theTable 1.1.Molecular Weight Limitations for Chemical Shift AssignmentsIsotopic LabelingNone15N15N, 13 C15N, 13 C, 2 HMol. Weight 10 kDa10-15 kDa15-30 kDa30-60 kDa
3transition, ω:1(1.1)ω3The long lifetime of the excited state implies extremely narrow spectral linessince the ability to define the energy of a transition is proportional to the lifetime of the excited state 1 . In the case of small organic molecules, linewidthsless than 1 Hz are easily attainable. Thus it is possible to detect small changesin absorption energies that arise from subtle differences in the environmentof a nuclear spin. The persistence of the excited state also facilitates multidimensional spectroscopy, by allowing the resonance frequency information associated with one spin to be passed to another. Finally, the long lifetime ofthe excited state permits the measurement of molecular dynamics over a widerange of time scales.τ 1.2.1Nuclear Spin TransitionsIn all forms of spectroscopy it is necessary to have two or more differentstates of the system that differ in energy. In a system with two energy levels,the one of lower energy if often referred to as the ground state and the higherenergy state is the excited state. In the case of nuclear magnetic resonancespectroscopy, the energies of the states arise from the interaction of a nuclearmagnetic dipole moment with an intense external magnetic field. Excitationof transitions between these states is stimulated using radio-frequency (RF)electromagnetic radiation.1.2.1.1Magnetic DipoleThe nuclear magnetic dipole moment arises from the spin angular momentumof the nucleus. All nuclei with an odd mass number (e.g. 1 H, 13 C, 15 N) havespin angular momentum because they have an unpaired proton. All nuclei withan even mass number and an odd charge (e.g. 2 H, 14 N) also have spin angularmomentum.⃗ is quantized (as is all angular momentum)The spin angular momentum, S,and the different quantum states are indexed with the spin quantumnumber!⃗ h̄ I(I 1). WeI. The total angular momentum of a nuclear spin is: Swill generally be interested in the z-component of the angular moment, Sz ,which is restricted to integral steps of h̄ ranging from I to I. For example,a spin one-half nuclei would have two possible values of Sz : 21 h̄, and 12 h̄,corresponding to spin quantum numbers mz 21 and mz 21 , respectively.The magnetic moment of a nuclear spin, µ⃗ , is proportional to its spin angularmomentum, h̄I⃗ by a factor, γ, which has units of radians sec 1 gauss 1 .µ⃗ n γn h̄I⃗(1.2)The magnitude of γ depends on the type of nuclei. NMR properties of various1 Thisis one form of Heisenberg’s uncertainty principle: E t h̄/2.
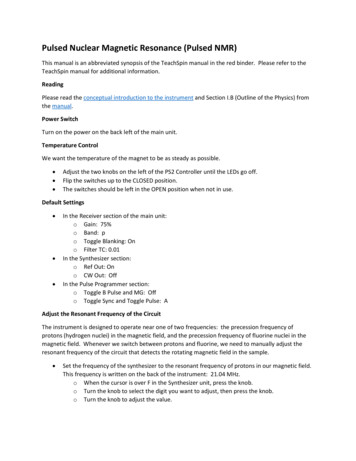
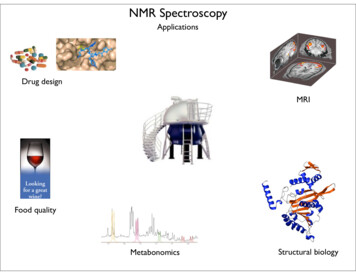
4Table 1.2.Nuclei11H2H19F13C15N31PIntroduction to NMR SpectroscopyProperties of NMR Active Nuclei.γ(rad · sec 1 · gauss 1 /21/2Natural Abundance (%)99.9800.016100.00021.10830.373100.001The term “Protons” is used interchangeably with 1 H in the text.Fluorine is not normally found in biopolymers, therefore it has to be introduced by chemical or biosynthetic labeling.3These isotopes of carbon and nitrogen are normally found in low levels inbiopolymers, therefore the levels of these two spins are generally enriched, often to 100%, by biosynthetic labeling.†CGS units.2nuclear spins, including values of γ, are shown in Table 1.2. NMR activeisotopes of hydrogen, carbon, nitrogen, and phosphorus exist, thus it is possibleto observe NMR signals from virtually every atom in biopolymers. Protons(1 H) and phosphorus are highly abundant in natural biopolymers, while in thecase of carbon and nitrogen it is usually necessary to introduce the appropriateisotope into the sample (see footnote 4 in Table 1.2). Also note, that with theexception of deuterium (2 H), all of these nuclei have a z-component of the spinangular momentum of h̄/2. Consequently, the material presented in this textapplies to all of the above atomic nuclei, except for deuterium. Deuterium witha spin quantum number I 1 is a quadrapolar nuclei and in certain instancesneeds to be treated differently than spin-1/2 nuclei.1.2.1.2Transition Energies - Nuclear Dipole-MagneticField InteractionWhen the orientation of a collection of nuclearBspins is observed in the absence of a magnetic field,all possible orientations of the magnetic dipole areθµpossible (see Fig. 1.3). However, once the spins areplaced in a magnetic field, the direction of z-axisbecomes defined by the direction of the field, andthe magnetic moments of spin-1/2 nuclei assume Figure 1.2. Interaction oftwo orientations, either along or opposed to the magnetic dipole with an apmagnetic field, as illustrated in Fig. 1.3. Note plied field.that the magnetic moments cannot orient parallelto the magnetic field because of the restrictions placed on the value of µz bythe quantum mechanical properties of the system.The energy of a state depends on the interaction of the aligned magneticdipole with an externally applied magnetic field. The size of this interaction
5ABzZµZµ 1/2µ 1/2YθYYφXXXµ-1/2Figure 1.3. Orientation of Magnetic Dipoles.A. Orientation of nuclear magnetic dipoles in the absence of a magnetic field. A unitsphere is shown and the dots on the surface illustrate the various orientations of thedipoles in space. The orientation of one dipole is indicated by a line drawn from thecenter of the sphere.B. The orientation of the nuclear spin dipoles in a static magnetic field along Z. Notethat one-half of the spins are pointed up and the other half are pointed down. Alsonote that they can assume any value of φ, but only two values of θ. φ and θ representthe orientation of the magnetic dipole in spherical coordinates, as shown on the rightpart of this figure.can be found from classical electromagnetic theory. For example, consider a⃗ with the magnetic field along themagnetic dipole in a static magnetic field, B,z-axis, as shown in panel B of Fig. 1.3. The energy required to change theangle, θ, is"""⃗E Γdθ (⃗µ B)dθ µ B sin(θ)dθ µ B cos(θ) ⃗ ⃗µ·B(1.3)The torque, Γ arises as the static field attempts to align the magnetic dipole ofthe nucleus. The energy of interaction, or Hamiltonian 2 , between the field and⃗the dipole is therefore given by the dot product of the two vectors: H ⃗µ · B.The actual magnetic field that is present at the nucleus is usually attenuated,or shielded, by the presence of electrons that surround the nucleus, giving amodified field at the nucleus, B:B (1 σ)Bo(1.4)where σ represents the degree of shielding. An extensive discussion of shieldingeffects is found in Section 1.3.Assuming that the magnetic field is along the z-axis, the energy of each stateis:H uz Bz(1.5)2 TheHamiltonian is a quantum mechanical operator that gives the energy of the systemwhen applied to the wavefunction of the system.
6E0Introduction to NMR Spectroscopym z 21Bm z 21Figure 1.4. Energy of the two quantum states of a spin 12 particle, with γ 0, as afunction of the magnetic field strength. The diagram for a spin with γ 0 would beidentical, except that the quantum number would be interchanged.At this point, we have a result that is entirely classical, it is applicable to anymagnetic dipole that is placed into a magnetic field. To relate the energy of anuclear spin to its quantum state, we make use of the relationship between themagnetic dipole and the z-component of the spin angular momentum, µz γh̄mz , giving the energy for a spin in a quantum state, mz :H γh̄Bmz(1.6)This is often referred to as the Zeeman Hamiltonian.Using Eq. 1.6 it is possible to draw an energy diagram for the system as afunction of magnetic field. For a spin-1/2 particle (mz 1/2) the energy asa function of the magnetic field is shown in Fig. 1.4.The ground, or lower energy state, referred to as α, corresponds to mz 1/2, and the excited, or higher energy state, is referred to as β, correspondsto mz 1/2. The energies of the two states can be calculated using Eq. 1.6,Eα γh̄B2Eβ γh̄B2(1.7)The energy difference between the two states is easily computed, E Eβ Eα γh̄B(1.8)and using the relationship, E h̄ω, gives the well known Larmor equation:ωs γB(1.9)In the above equation, ωs refers to the absorption, or resonance, frequencyof the shielded nucleus, i.e. its observed resonance frequency. The Larmorequation is one of the key equations in NMR spectroscopy, it states that theabsorption frequency of a transition is equal to γ multiplied by the strength ofthe magnetic field at the nucleus.The energy of an NMR transition is quite low, requiring radiowaves to excitethe spins. The small value of E has two important consequences:
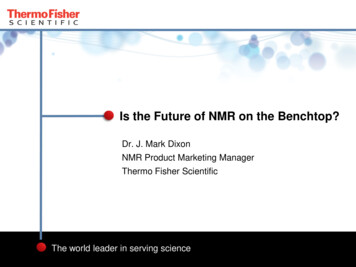
71. The population difference between the two energy levels is very small, onthe order of 1 part in 106 . The actual population difference can be easilycalculated from Boltzmann’s relationship: γh̄BNβγh̄B e kt 1 Nαkt(1.10)The consequence of having a small population differences is that NMR spectroscopy is a relatively insensitive experimental technique because of thesmall excess of spins in the ground state. In any form of spectroscopy thepresence of electro-magnetic radiation induces transitions from the groundto the excited state and vice versa, consequently, the net absorption depends on the population difference between the two states. Due to thelow sensitivity, it is common to increase the signal-to-noise of the spectrumby signal averaging. In addition, typical NMR experiments require proteinconcentrations on the order of 1 mM. However, in some cases concentrationsin the range of 50 µM have be used.2. The lifetime of the excited state can be quite long, on the order of msecto sec. As discussed above, a long lifetime provides three benefits: narrowresonance lines, experimental manipulation of the excited state in multidimensional experiments, and sensitivity to molecular motion over a widetime scale.1.3Chemical ShieldingThe magnetic field strength at the nucleus differs slightly from the applied field,Bo , because of shielded by the electron density surrounding the nucleus. This shielding is due to precession of electrons underthe influence of the applied magnetic field,which generates an additional magnetic fieldthat usually opposes the externally appliedmagnetic field.The magnetic field from the electronsshields the nucleus from Bo , and results in alocal magnetic field strength at the nucleusthat is given by:B (1 σ) · Bo(1.11)CHCH33SiCHCH33Figure 1.5. Tetramethyl silane(TMS) is often used as a referencecompound. The Si atom is electropositive with respect to carbon,therefore the electron density onthe methyl groups is higher thanwould be found on the equivalenthydrocarbon. The high electrondensity shields the methyl carbonand protons, leading to a lowereffective field at the nucleus and alower resonance frequency.where sigma represents the shielding of thenuclear spin. For an isotropic electron distribution the shielding is given by the Lamb formula [?]:e2σ 3mc2"ρ(r)drr(1.12)
8Introduction to NMR SpectroscopyAs the electron density around the nucleus increases, the effective field decreases, leading to lower resonance frequencies. Since the resonance frequencyis due to the chemical environment of the nuclear spin, the observed frequencyis referred to as a chemical shift. Due to differences in shielding, differentspins will experience different values of local magnetic field, giving rise to shiftsin their frequencies. Chemical shift reference standards, such as tetra-methylsilane were chosen because their protons are highly shielded (see Fig. ?).For anisotropic electron distributions the shielding is described by a tensor.A tensor is a concise mathematical expression of the anisotropic properties ofa physical system in three-dimensional space and has the following form3 σxx00σyy0 σ 0(1.13)00 σzzEquation 1.13 describes the chemical shielding if the magnetic field were alongthe x-axis (σxx ), y-axis (σyy ), or the z-axis (σzz ). Under conditions of rapidtumbling, which is generally the case in solution, an averaged shielding is observed:1σ̄ [σxx σyy σzz ](1.14)31.3.1Chemical Shift Scale - ppmEquation 1.9 indicates that the observed absorption frequency depends onthe magnetic field strength. Commercial NMR spectrometers can be purchasedwith different magnetic field strengths. A field strength that gives a protonabsorption frequency of 500 MHz (11.7 Tesla) is fairly common. However,spectrometers with proton frequencies ranges as high as 900 MHz are becomingmore common. To faciliate the comparison of spectra obtained with differentfield strengths, the effect of the field strength is removed by converting allfrequencies to a dimensionless scale, the chemical shift scale. This scale isdefined as:ν νoδ 106(1.15)νowith units of ppm, or parts-per-million. The conversion from frequency tochemical shift makes the position of the spectral line independent of the magnetic field strength (by dividing by νo ).The constant, νo , is a reference frequency, in units of Hertz (Hz). It is oftenthe frequency of the line from a reference compound whose resonance is atone end of the spectrum. For example, tetra-methyl silane is used to referenceorganic samples and the proton and carbon frequencies of its spectral line areset to zero ppm. In the case of protein solutions the water line can be used as3 Thissimple form, with all off-diagonal elements having the value of zero, is only foundfor one particular orientation of the molecule with respect to the magnetic field, called theprinciple axis system (PAS).
9Table 1.4. Nitrogen chemical shifts for side-chain atoms. The amide nitrogen chemical shifts are 120 ppm, with the exception of Glycine, which is found at 109.9 ppm.Data from BioMagResBank [?].ResidueArgAsnGlnHisLysTrpShifts89.8 (ϵ), 74.8 NH1, 75.8 NH2112.8 (δ)111.8 (ϵ)190.7 (δ1), 179.8 (ϵ2)71.86 (ζ)129.5 (ϵ)an approximate proton chemical shift reference point, with a chemical shift ofabout 4.70 ppm.1.4Characteristic 1 H,Shifts13C and15N ChemicalThe proton, carbon, and nitrogen chemical shifts found for amino-acids inproteins are presented in tables 1.3, 1.5, 1.4.Table GlnMetCysTrpPheTyrHisAverage proton chemical shifts in proteins. Data from .11,3.12Others0.84, 0.83(CH3)1.30, 1.24 (CH2), 0.80 (γCH3), 0.70 (δCH3)1.54 (γCH), 0.77, 0.76(δCH3)1.93 (γCH2), 3.64, 3.63 (δCH2)5.33 Hγ (OH)1.16 (γCH3), 4.40 Hγ1 (OH)2.31 (γCH2)1.38 (γCH2), 1.61 (δCH2), 2.93 (ϵCH2), 7.52 (ζNH3)1.58 (γCH2), 3.13 (δCH2), 7.32, 6.74, 6.72 (NH)7.27, 7.20 (δNH2)2.32 (γCH2), 7.17, 7.07 (γNH2)2.44 (γCH2), 1.86 (ϵCH3)1.66 -SH6.68-7.17 (aromatic), 10.13 (NH)6.89-6.91 (aromatic)6.86 (Hδ), 6.64 (Hϵ), 9.25 (-OH)Hδ1 10.14(NH), Hδ2 7.08, Hϵ1 8.08, Hϵ2 10.43(NH)
10Introduction to NMR SpectroscopyTable 1.5. Carbon chemical shifts from the BioMagResBank [?]. Carbonyl shiftshave been omitted since they are quite uniform at approximately 175 .626.827.1(CH3)(γ1), 17.3 (γCH3), 13.4 (δCH3)(γ), 24.5 (δCH3)(γ), 50.3 (δ)21.4 (γCH3)178.41 (γ) sidechain36.0 (γ), 181.9 (δ) sidechain24.9 (γ), 28.8 (δ), 40 (ϵ)27.3 (γ), 43.1 (δ), 159.0 (ζ)178.41 (γ) sidechain33.7 (γ), 179.7 (δ) sidechain32.1 (γ), 17.2 (ϵCH3)110-137 (aromatic)129-138 (aromatic)117 (ϵC), 132 (δC), 156 (ζ)119.8 (δ2), 136 (ϵ1)Effect of Electronic Structure on ChemicalShiftsThe chemical shifts presented in tables 1.3 and 1.5 are clearly different fromatom to atom. For example, amide protons resonate at 8 ppm, Hα protonsat 4 ppm and methyl protons at 1 ppm. A similar trend in carbon shifts isobserved for α- and β-carbons. These trends in chemical shifts can be explainedby the electronegativity of the atoms that are chemically bonded to the atom ofinterest. The amide proton has a high chemical shift because the nitrogen atomis more electron withdrawing than carbon. The reduced electron density at theamide proton decreases the shielding and therefore increases the effective fieldand consequently the resonance frequency. Similarly the Hα shifts are higherthan the methyl-H shifts because of the proximity of the α-protons to theelectronegative nitrogen.
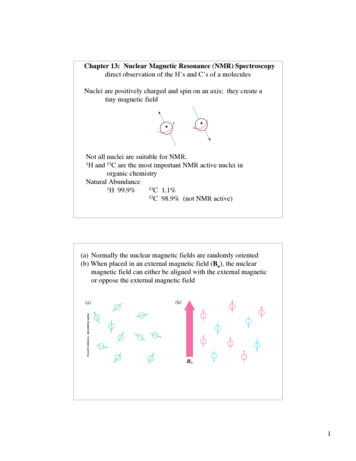
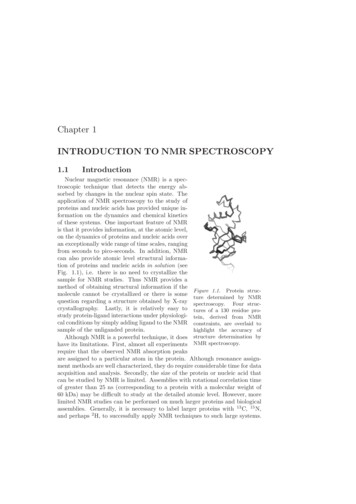
αMETαPROSERβαVAL70ILEγβ6050403013 C Chemical Shift δδ ARGγCH 3βαASPαGLUαALAβαCYSTHRβαASNBCH 3ββγ5432101H Chemical Shift [ppm]-1Figure 1.6. The distribution of observed carbon (A, left) and proton (B, right) chemical shifts in proteins. The solid circles ( ) mark the average chemical shift. The solidlines indicate 3σ; 95% of the observed chemical shifts fall within this range. Thegray boxes indicate nominal chemical shift ranges for α, β, and methyl atoms. In thecase of carbon shifts, these range separate the atom types quite well. Note that thereare a few exceptions, for example, the β-carbons of Ser and Thr fall in the α-regionand the α-carbon of Gly can fall in the β-carbon region. The large range of β-carbonshifts for Cys is due to the fact that both free and disulfide bonded residues are included in this figure. In the case of proton shifts, the separation is not as clean dueto the extensive chemical shift overlap between the various atom types. Data fromthe BioMagResBank database of chemical shifts [?].Note that within a residue, the relationship between atom type and chemicalshift is similar for both carbon and proton shifts. For example, in the case ofArginine the following ordering is found: α δ β γ for both carbon and
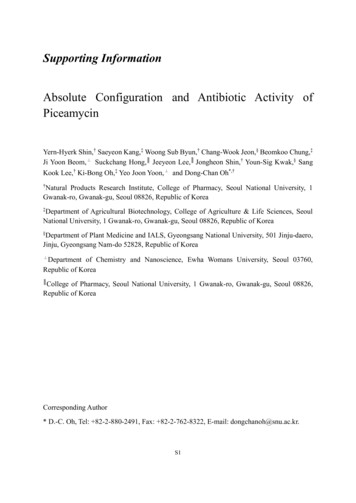
12Introduction to NMR Spectroscopyproton shifts (see Fig. 1.6. The identical ordering reflects a similar electronicenvironment for both the carbon and its attached proton.The conformation, or secondary structure, of the polypeptide backbone alters the chemical shift of chemically equivalent atoms in a predictable fashion.For example, the Cα shift of Alanine decreases by 1.3 ppm when this residueis found in a β-strand, and increases by 2.3 ppm when found in an α-helicalconfiguration. Although the secondary structure of the backbone is only one ofthe factors that alter chemical shifts, it is possible to predict secondary structure by correlating the deviation of the chemical shift from random-coil valuesfor a number of different atoms (e.g. Cα , Hα , etc).In addition to electronegativity effects, a formal positive change (e.g. LysϵN) also withdraws electrons from adjacent atoms, decreasing the shielding andtherefore increasing the chemical shift. A formal negative change, will have theopposite effect.1.4.2Ring Current EffectsChemical shifts are also perturbed by additional magnetic fields that arisefrom the precession of delocalized electrons in conjugated systems, such asaromatic rings or carboxylic acid groups. These ring current effects can besubstantial. Several methods have been devised to calculate the effect of ringcurrents on chemical shifts. The simplest method, introduced by Pople [?], isto consider the induced magnetic field as a point dipole at the center of thearomatic ring. The magnetic field that is generated by this dipole is given by6oDistance oDistance [A]Figure 1.7. Calculated ring current shifts for a Phenylalanine ring. The x-axis liesin the plane of the ring and the y-axis is perpendicular to the plane of the ring. Thelocation of the carbon and its attached hydrogen are indicated by the large and smallspheres, respectively. The large gray area represents the approximate Van der Waalsradius of the phenyl group. The lines represent contours of iso-chemical shift changes.
13the standard dipole equation:σ iB1 3cos2 θr3(1.16)where i is a ring-current factor that depends on the geometry of the ring. Forthe phenyl group i 1. B is a constant of proportionally, on the order of 25ppm. θ is the angle between the normal to the aromatic ring and the vectorthat joins the atom to the origin.This function is plotted in Fig. 1.7. The ring-current effect depends onboth distance and orientation. The weak distance dependence, of 1/r3 , impliesthat ring current effects can significantly perturb the chemical shifts of near-byresidues. Chemical shift perturbations also depend on the orientation of theatom with respect to the plane of the aromatic ring. For example, placementof an atom 4 directly above the center of the ring will decrease the chemicalshift by approximately 0.75 ppm. In contrast, if the atom is placed in theplane of the ring at the same distance from the center, its chemical shift willbe increased by approximately 0.33 ppm. Aromatic protons, because of theirclose proximity to the center of the ring, experience an increase of 2 ppmdue to ring current effects.1.4.3Effects of Local Environment on ChemicalShiftsThe above discussion suggest that chemically equivalent atoms will haveidentical chemical shifts. For example, one might expect that all of the Alanine methyl protons in a protein to resonance at 1.39 ppm. Fortunately, thetertiary structure in folded proteins generates sufficient diversity in the local environment such that different resonance frequencies are observed for otherwiseidentical groups. The environmental differences that cause diversity in chemical shifts include electro-negativity effects (e.g. in hydrogen bonded amideprotons), as well as the electrostatic and magnetic (ring current) effects thatwere discussed previously. Typical ranges of carbon and proton chemical shiftsfor aliphatic atoms in a large number of proteins are shown in Fig. 1.6. Thecarbon chemical shifts are more disperse, covering a range of approximately 70ppm, while the proton chemical shift range is about 6 ppm.1.4.3.1Degeneracy and Equivalent Chemical shiftsIn a number of cases, two or more spins (e.g. protons) will have identicalchemical shifts. These spins are said to have degenerate chemical shifts.Chemical shift degeneracy occurs when the two protons are magneticallyequivalent. A simple test for magnetic equivalence is to replace each of the twoprotons with a test atom, e.g. F, generating two new compounds, and determinewhether the two protons are magnetically equivalent using the following steps:1. If two different compounds are generated, then the protons are non-equivalentand will show two separate peaks.
14Introduction to NMR SpectroscopyHOOCH C H NH3glycineHOOCF C H NH3HOOCH C F NH3enantiomersFigure 1.8. Testing for magnetic equivalence of glycine α-protons. Replacement ofeach α-proton with fluorine generates the two compounds on the right. These areenantiomers and therefore will show identical chemical shifts in an achiral environment. spectroscopy.2. If the two molecules can be superimposed, then they are magnetically equivalent.3. If the two molecules are mirror images of each other (enantiomers), thenthe two protons will have the same chemical shift in an achiral environment.However, two different shifts can be observed in a chiral environment, suchas in biological polymers.4. If the two molecules are diastereoamers, then the two protons are in differentmagnetic environments and will show different chemical shifts.As an example of the second item in the above list, consider the methylprotons of alanine. Replacement of each methyl proton with F will generatethree different derivatives. However, these can all be superimposed on eachother by rotation about the alpha-beta bond, so all three protons are equivalent.A similar analysis shows that the delta and epsilon protons on tyrosine andphenylalanine are also equivalent due to rotation of the ring.As an example of the third item on the above list, consider the two alphaprotons on glycine. When each of these is replaced by F, a chiral center on thealpha carbon is generated, and the two compounds are mirror images of eachother. Consequently, the chemical shifts of the two alpha protons in glycinewill be identical in water, an achiral solvent. However, if glycine is incorporatedinto a protein, it is likely that the environment is no longer achiral and separatechemical shifts will be observed for each proton.Although two protons may be magnetically equivalent in a formal sense,restriction of rotation can produce non-equivalency if the rotation was requiredto generate equivalency. For example, if the rotation of methyl groups on Ala,Val, Leu, Ile, or aromatics on Phe or Tyr sidechains, is somehow restricted,such that the methyl or aromatic protons are now in different environments,then distinct resonances will be seen for each proton. In order for this tooccur the rate of rotation must be significantly slower than the difference inresonance frequencies of the protons in the different environments. In the caseof aromatic residues, the rate of ring-flipping is often sufficiently slow thatindividual resonances are seen for each of the
4 Introduction to NMR Spectroscopy Table 1.2. Properties of NMR Active Nuclei. Nuclei1 γ(rad·sec 1 · gauss 1)† INaturalAbundance(%) 1H26,753 1/2 99.980 2H4,106 1 0.016 19F25,179 1/2 100.0002 13C6,728 1/2 1.1083 31P10,841 1/2 100.00 1The term "Protons" is used interchangeably with 1Hinthetext. 2Fluorine is not normally found in biopolymers, therefore it has to be intro-