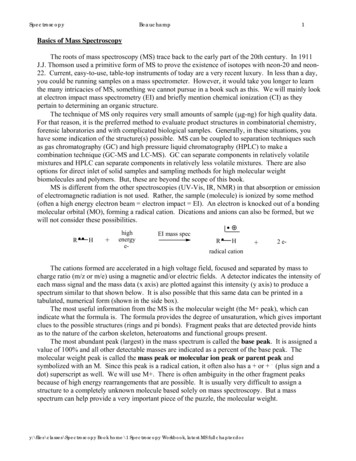
Transcription
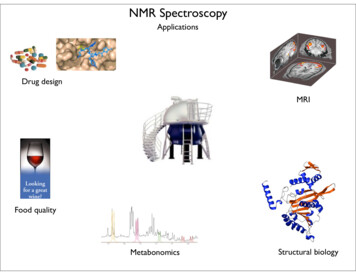
NMR SpectroscopyApplicationsDrug designMRIFood qualityMetabonomicsStructural biology
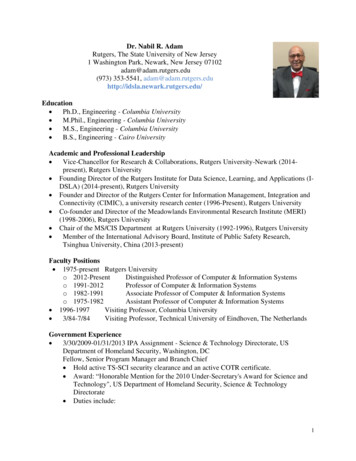
NMR SpectroscopyBasic PrinciplesN.M.R. Nuclear Magnetic ResonanceSpectroscopic technique, thus relies on the interaction between material and electromagnetic radiationThe nuclei of all atoms possess a nuclear quantum number, I. (I 0, always multiples of .)Only nuclei with spin number (I) 0 can absorb/emit electromagnetic radiation.Even atomic mass & number: I 0 (12C, 16O)Even atomic mass & odd number: I whole integer (14N, 2H, 10B)Odd atomic mass: I half integer (1H, 13C, 15N, 31P) The spinning nuclei possess angular momentum, P, and charge, and so an associated magnetic moment, . x PWhere is the gyromagnetic ratio
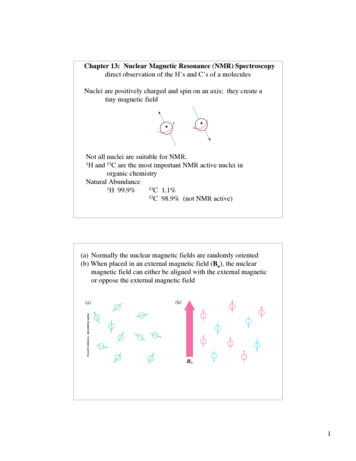
NMR SpectroscopyBasic PrinciplesB0The spin states of the nucleus are quantified:I, (I - 1), (I - 2), , -I I (e.g. 1H)Energy– – E h h B0/2 B0 0B0 0
NMR SpectroscopyBasic PrinciplesIn the ground state all nuclear spins are disordered, andthere is no energy difference between them. They aredegenerate.BoSince they have a magnetic moment, when we apply astrong external magnetic field (Bo), they orient eitheragainst or with it:There is always a small excess of nuclei (populationexcess) aligned with the field than pointing against it.
NMR SpectroscopyBasic Principles Bo 0 Bo 0 E h 0 h B0/2 0 is the Larmor Frequency 0 B0, angular velocityzB0 yx
NMR SpectroscopyBasic PrinciplesEach level has a different population (N), and the difference between the two is relatedto the energy difference by the Boltzmman distribution:N /N e E/kT E for 1H at 400 MHz (B0 9.5 T) is 3.8 x 10⁻⁵ Kcal/mol N /N 1.000064The surplus population is small (especially when compared to UV or IR).That renders NMR a rather insensitive technique!
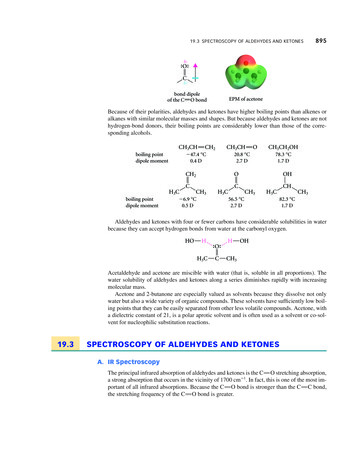
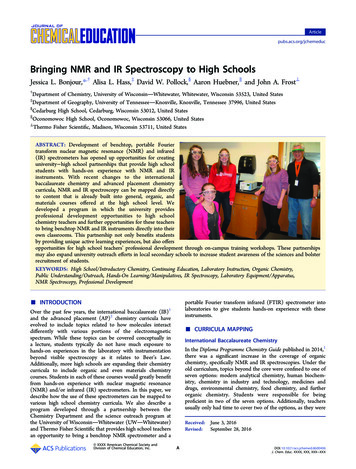
NMR SpectroscopyThe electromagnetic spectrum -rays60010221020Mossbauer500400X-raysvisible 1014infraredelectronic100rotational108NMR106 equency8201012microwave19F3001018ultraviolet 1016101H13C /MHzolefinicacetylenicaliphatic /ppm
NMR SpectroscopyThe Vector Model M0yxyxyyxx
NMR SpectroscopyNMR excitationzB1 C * cos ( ot)MoyB1xBoiTransmitter coil (x)B1 is an oscillating magnetic fieldyy- 0 0 xx
NMR SpectroscopyLaboratory vs. Rotating framezz’ 0 M0M0y 0 xy’B1- 0 Laboratory framex’-2 0 Rotating frame
NMR SpectroscopyEffect on an rf pulsezzM0 1tp (degrees) 90 B1xyyB1x 180
NMR SpectroscopyMagnetization properties 1H 400,000,000 Hz A 400,000,005 HzzAyyB1MAyMAx 5 Hzxxyxxyxyxy
NMR SpectroscopyMagnetization properties 1H 400,000,000 Hz A 400,000,005 HzzAB1MAyyyyMAx 5 HzxxxMAy MA cos tdetectorMAx MA sin tIMIMMAMAttt
NMR SpectroscopyThe Fourier TransformFTtime domainIMfrequency domain 1/ t tFTttimefrequency
NMR SpectroscopyThe Fourier TransformIMSignal Induction Decay (FID)time
NMR SpectroscopyThe Fourier TransformFT
NMR SpectroscopyContinuous wave vs. pulsed NMR o or Bo o or Botime
NMR SpectroscopyContinuous wave vs. pulsed NMR For cos( t)FT absorptive lines For sin( t)FT despersive lines
NMR SpectroscopyContinuous wave vs. pulsed NMRA monochromatic radiofrequency pulse is a combination of a wave(cosine) of frequency 0 and a step function* tp Since f 1/t, a pulse of 10 sduration excites a frequencybandwidth of 105 Hz!FT o
NMR SpectroscopyContinuous wave vs. pulsed NMR E t h or t 1
NMR SpectroscopySingle-channel signal detectionz yxFT 0 -
NMR SpectroscopyQuadrature detectionz yxMyMxMyMx
NMR SpectroscopyQuadrature detectioncosysinx 0 - 0 HzHz
NMR SpectroscopyThe Chemical ShiftThe NMR frequency of a nucleus in a molecule is mainly determined by itsgyromagnetic ratio and the strength of the magnetic field BThe exact value of depends, however, on the position of the nucleus in the molecule ormore precisely on the local electron distributionthis effect is called the chemical shift
NMR SpectroscopyThe Chemical Shift E h h B/2 Nuclei, however, in molecules are never isolated from other particles that are chargedand are in motion (electrons!). Thus, the field actually felt by a nucleus is slightly different from that of the appliedexternal magnetic field!!
NMR SpectroscopyThe Chemical Shift E h h Be /2 Beff, is given by B0-B B0-B0 B0(1- ) and is the chemical shift ( - ref) ref B0(1- )2 106 106 ( ref- )
NMR SpectroscopyThe Chemical Shiftmethylprotonsamide protons protonsmethyleneprotonsaromatic ring750 MHz 1H spectrum of a small protein shieldingfrequencymagnetic field
NMR SpectroscopyThe Chemical Shift
NMR SpectroscopyThe Chemical Shift
NMR SpectroscopyNuclear Shielding dia para nb rc ef solvdiamagnetic contributionparamagnetic contributionneighbor anisotropy effectring-current effectelectric field effectsolvent effect
NMR SpectroscopyNuclear Shielding - diamagnetic contributionThe external field B0 causes the electrons to circulate within their orbitalsB0h B0h B0(1- )B’The higher is the electron density close to the nucleus, the larger the protection is!
NMR SpectroscopyNuclear Shielding - diamagnetic contributionDepends on the electronegativityCH3X
NMR SpectroscopyNuclear Shielding - paramagnetic contributionThe external field B0 mixes the wavefunction of the ground state with that of the excited stateThe induced current generates a magnetic field that enhances the external field and deshields thenucleusLUMOB0HOMO p 1 1R3
NMR SpectroscopyChemical shift range1H; 10 ppm13C; 200 ppm19F; 300 ppm31P; 500 ppmLocal diamagnetic and paramagnetic currents make only modest contributions to 1H shielding!
NMR SpectroscopyChemical Shift AnisotropyNuclear shielding, , is a tensor.The distribution of the electrons about the nucleus is non-sperical- thus, the magnitude of theshielding depends on the relative orientation of the nucleus with respect to the static field.In isotropic cases: ( 11 22 33)In static cases, e.g. solid state
NMR SpectroscopyNuclear Shielding - neighboring groupB0BABμpar μperAμpar μper --
NMR SpectroscopyNuclear Shielding - neighboring group -CC-μpar μperC μpar μper C-C 2H 476C 2H 2543C 2H 6210ppm
NMR SpectroscopyNuclear Shielding - ring-current effectMore pronounced in aromatic rings due to the electron cloudsBo9.28e--2.99
NMR SpectroscopyNuclear Shielding - hydrogen bondingHydrogen bonding causes deshielding due to electron density decrease at the proton site[EtOH] in CCl4CH3CH2OH1M0.1M0.01M0.001M6420ppm
NMR SpectroscopySpin-spin (scalar) couplingHF (1H-19F)HFJHFJHF
NMR SpectroscopySpin-spin (scalar) couplingHF (1H-19F)H FHH FBo19F1HH FHH F19F1HNuclear momentMagnetic polarizationof the electronE h JAX mA mXwhere m is the magnetic quantum numberJAX is the spin-spin coupling constant
NMR SpectroscopySpin-spin (scalar) couplingAX2AMXAX3
NMR SpectroscopySpin-spin (scalar) couplingStrong coupling – 10 J
NMR SpectroscopySpin-spin (scalar) couplingThe principal source of scalar coupling is an indirect interaction mediated by electrons involved in chemical bondingThe magnitude of interaction is proportional to the probability of finding the electron at the nucleus (R 0)Magnitude in Hz- independent of the external magnetic fieldH3C – CH3H2C – CH2HC CH125 Hz160 Hz250 Hz
NMR SpectroscopySpin-spin (scalar) couplingThree-bond coupling most useful since it carries information on dihedral anglesEmpirical relationship: the Karplus relation3J A B cos C cos2
NMR SpectroscopyChemical shifts on the rotating frame500 MHzz3y2 0x tzyx 500 Hz
NMR SpectroscopySpin couplings on the rotating frameJzy 0x tz -J/2 Hzyx J/2 Hz
NMR SpectroscopyThe basic spin-echo pulse sequence90 appliedalong x axis180 appliedalong y axisx delayy acquisition
NMR Spectroscopy90 appliedalong x axisEffect of spin echo on chemical shift evolution180 appliedalong y axisx y acquisitiondelayzzy90xy xxzzyzyx180y Axy x A
NMR Spectroscopy90 appliedalong x axisEffect of spin echo on scalar coupling evolution180 appliedalong y axisx y acquisitiondelayzzy90x1H-Xy xxzz-J/2yz(only180yyy -J/2x J/2x J/2x1H)
NMR Spectroscopy90 appliedalong x axisEffect of spin echo on scalar coupling evolution180 appliedalong y axisx y acquisitiondelayzzy90x1H-Xy xxzz-J/2z180yyy J/2x J/2x-J/2xy(both 1H and X)
NMR SpectroscopyWater suppression by the Jump and Return method zzy90xy xxzzyzy A90-xxyxx
NMR SpectroscopyWater suppression
NMR SpectroscopySpin decouplingdecouple1H13CH CHH CH CHH C
NMR SpectroscopyThe J-modulated spin echodecouple1Hyx13C
NMR SpectroscopyThe J-modulated spin echodecouple1Hyx13C
NMR SpectroscopyThe J-modulated spin echoIf 180J degreesC:CH:CH2:CH3:I 1I cos I cos2 I cos3 decouple1Hyx13C
NMR SpectroscopyThe J-modulated spin echodecouple1Hyx13C 1/J13C(ppm)
NMR SpectroscopySensitivity enhancementNMR has poor sensitivity compared to other analytical techniquesThe intrinsic sensitivity depends upon the gyromagnetic ratio, A greater contributes to:a high resonant frequency- large transition energy difference- greater Boltzmann population differencehigh magnetic moment and hence a stronger signalhigh rate of precession which induces a greater signal in the detection coilSo, the strength of NMR signal is proportional to 3Noise increases a square-root of observed frequency}S/N 5/2
NMR SpectroscopySensitivity enhancement by polarization transferSignal sensitivity enhancement by transferring the greater population differences of high spins onto their spin-coupled low- partners. C21H-13CH2H1 C1 spin pair
NMR SpectroscopySensitivity enhancement by polarization transferSignal sensitivity enhancement by transferring the greater population differences of high spins onto their spin-coupled low- partners. C2 C C2 H2 C2 2 H1C2H2 C 2 CC1 C2 2 C2 H1 C1(inverted)2 C C 2 2 C C CC1H1H1H2C1C2H2C2-3:5
NMR SpectroscopySensitivity enhancement by polarization transferSignal sensitivity enhancement by transferring the greater population differences of high spins onto their spin-coupled low- sed,decoupledINEPT
NMR SpectroscopyRelaxationWhen perturbed, the nuclear spins need to relax to return to their equilibrium distributionE.g. when the sample is put into a magnet, the Boltzmann distribution of spins among the energylevels changes due to a change in the energy of the various levelsE.g. after applying electromagnetic radiation, which induces transitions between energy levels,the system returns to its equilibriumThis process is called relaxation
NMR SpectroscopyLongitudinal Relaxation: Establishing Equilibriumzyxzzyyxxzzxx
NMR SpectroscopyLongitudinal Relaxation: Establishing EquilibriumRecovery of the z-magnetization follows exponential behaviordMzdt (M0-Mz)T1Mz M0 (1-2e-t/T1)where T1 is the longitudinal relaxation time
NMR SpectroscopyLongitudinal Relaxation: Measurementxxzzz180xz yx 90xyxyyxxzz 90xyxyx
NMR SpectroscopyLongitudinal Relaxation: Measurementxx
NMR SpectroscopyLongitudinal Relaxation: Exponential growthMz M0 (1-2e-t/T1)By the end of 5T1 sec, the magnetization has recovered by 99.33%
NMR SpectroscopyLongitudinal Relaxation: optimizing sensitivity
NMR SpectroscopyLongitudinal Relaxation: optimizing sensitivity
NMR SpectroscopyLongitudinal Relaxation: optimizing sensitivityoptimum pulse repetition time when using 90ºQuantitative measurements and integration
NMR SpectroscopyTransverse Relaxation: magnetization loss in the x-y planeyx---yyy xxtimex
NMR SpectroscopyTransverse Relaxation: magnetization loss in the x-y plane 1 T2*
NMR SpectroscopyTransverse Relaxation: Measurementxz z z90x- yyyx xz180y xyzy yxx
NMR SpectroscopyTransverse Relaxation: Measurement
NMR SpectroscopyT1 vs T2 RelaxationT1 T2For small molecules, T1 T2For large molecules, T1 T2Longitudinal relaxation causes loss of energy from the spins (enthalpic)Transverse relaxation occurs by mutual swapping of energy between spins (entropic)
NMR SpectroscopyRelaxation mechanismsNuclear spin relaxation is not a spontaneous process; it requires stimulation bysuitable fluctuating fields to induce the necessary spin transitionsTwo main mechanismsDipole-dipoleChemical shift anisotropy
NMR SpectroscopyRelaxation mechanismsLongitudinal relaxation requires a time-dependent magnetic field fluctuating at the Larmor frequencyThe time-dependence originates in the motions of the molecule (vibration, rotation, diffusion etc)Molecules in solution “tumble”. This “tumbling” can be characterized by a rotational correlation time c c is the time needed for the rmsdeflection of the molecules to be 1radian (60 )
NMR SpectroscopySpectral density functionRotational diffusion in solution occurs at a range of frequencies1/ c rms rotational frequency (radians s-1)The probability function of finding motions at a given angular frequency can be described by thespectral density function J( )
NMR SpectroscopySpectral density functionFrequency distribution of the fluctuating magnetic fields
NMR SpectroscopySpectral density function: Longitudinal relaxationSpins are relaxed by local fields fluctuating at the Larmor frequency 0So, the relaxation rate (R1) will be proportional to the J( 0)1/T1 R1 2 B2 J( 0)Knowing the form of J( ) we can predict the dependence of the spin-lattice relaxation time (T1 1/R1) on the correlation time c for a given NMR frequency 0 0 c 1 ,J( 0) c 1/ 0and T1 is minimum (R1 maximum) 0 c 1 (small molecules), J( 0) 2 c and T1decreases (R1 increases) with increasing c 0 c 1 0 c 1(e.g.by decreasing the temperature) 0 c 1 0 c 1 (large molecules), J( 0) 2/ 02 cand T1 increases (R1 decreases) withincreasing c (e.g. by decreasing thetemperature)
NMR SpectroscopyRelaxation mechanisms: Dipole-dipoleNuclei with non-zero quantum numbers have magnetic dipolesThey behave like small magnets and induce small magnetic fields that affect neighboring nucleiMagnetic field, B , generated by a magnetic dipole
NMR SpectroscopyRelaxation mechanisms: Dipole-dipoleRepresentation of the dipolar magnetic field B , generated by a magnetic dipole lines of forcedensity plotsBμzBμz is zero for 54.7 (magic angle)Bμx
NMR SpectroscopyRelaxation mechanisms: Dipole-dipoleThe z component of their dipole magnetic field will affect the field experienced by theother nucleus and cause splitting sign refers to the quantum number of A ( )XABμThus, the splitting in the spectrum of X isAKAX vary with the distancee.g. KCH is 9000 Hz at 1.5 Å and 30 Hz at 10 Å
NMR SpectroscopyRelaxation mechanisms: Dipole-dipoleSplitting of the AX spectrum depends on In a crystal with fixed distances and angles the dipolar splitting vary with the crystalorientation with respect to the external magnetic field
NMR SpectroscopyRelaxation mechanisms: Dipole-dipoleMolecules in liquids rotate, “tumble” rapidly with typical frequencies between 1012 to108 Hz for small molecules and proteins, respectively.Those frequencies are much larger than typical dipolar couplings (105 Hz)The angular part of the dipolar splitting is averaged over all possible orientation to 0Although they are not directly observed in solution, dipolar couplings play an importantrole in spin relaxationThe local field experienced at one nucleus as a result of its neighbor will fluctuate as themolecule tumbles
NMR SpectroscopyRelaxation mechanisms: Dipole-dipoleR1 depend of the gyromagnetic ratio of the nuclei (e.g. H-H relaxation more efficient than C-H)
NMR SpectroscopyRelaxation mechanisms: Chemical shift anisotropyThe distribution of the electrons about the nucleus is non-sperical- thus, the magnitude of theshielding depends on the relative orientation of the nucleus with respect to the static field.As the molecule tumbles, it creates a fluctuating magneticfield
NMR SpectroscopyNuclear Overhauser Effect (NOE)NOE: change in intensity of one resonance when the spin transitions of another are perturbedfrom their equilibrium populationsperturbation: saturation or inversionThe two spins should “communicate” through dipole-dipole interactionNOE is observed for spin I when spin S is perturbed
NMR SpectroscopyNuclear Overhauser Effect (NOE)Origin of the NOEN- /2 N- SN II SN 0 N /2 II 0 SN /2 N S SISIN /2
NMR SpectroscopyNuclear Overhauser Effect (NOE)Six possible transitions in a two-spin system W1SW1IW2 W0W1IW1S Only single transitions can by observed by NMR (W1)W0 and W2 are cross-relaxation pathways, responsible for the NOE
NMR SpectroscopyNuclear Overhauser Effect (NOE)N- /2 N- SN IN 0 N /2 IS SIISSISISN /2 S W2I0 W0 0 ISI 0 Snegative NOEpositive NOESN /2 0 N 0 I ISI
NMR SpectroscopyNuclear Overhauser Effect (NOE)W1 tends to reduce the magnitude of the NOESaturating for a period of time that is long relative to the relaxation times allows a newsteady-state of populations to arise IS, cross-relaxation rate: dictates the sign of the NOE IS, dipolar longitudinal relaxation rate of spin I: it serves to reduce the magnitudeThus, NOE is related to molecular motion!
NMR SpectroscopyNuclear Overhauser Effect (NOE)1Hat 400 MHzW1 at 400 MHzW2 at 800 MHz (WI WS)- stimulated by rapidly tumbling moleculesW0 at Hz-kHZ ( WI-WS )- stimulated by slowly tumbling moleculesSmall molecules exhibit positive NOEsLarge molecules exhibit negative NOEs
NMR SpectroscopyNuclear Overhauser Effect (NOE) c 1.12Variation in NOE as a function of molecular tumbling rates
NMR SpectroscopyField gradientBgVariation of magnetic field strength along the z axis
NMR SpectroscopyField gradient-!Bg !Bg90º-Bg, !gBg, !g !B-!Bggdefocused(dephased)refocused(rephased)
NMR SpectroscopyField gradientxRFGzstronger gradient
NMR SpectroscopyField gradientxRFGzVariation of the second gradient pulse (90 to 110% of the first)
NMR SpectroscopyDiffusion-ordered spectroscopyBg!!x!!x"!#!!!"!#!G gradient strengthD diffusion coefficient
NMR SpectroscopyDiffusion-ordered spectroscopymobility
NMR SpectroscopyMulti-dimensional NMROne dimensionTwo dimensions
NMR SpectroscopyMulti-dimensional NMRTo generate a spectrum with two frequency domains, f1 and f2, it is necessary to sampledata as a function of two separate time variables, t1 and t2.General scheme for 2D NMR experimentDP: PreparationE: EvolutionM: MixingD: DetectionPEt1Mt2
NMR SpectroscopyMulti-dimensional NMRAhvB
NMR SpectroscopyMulti-dimensional NMR
NMR SpectroscopyCOSY (COrrelated SpectroscopY)Correlation through bonds (J-coupling)
NMR SpectroscopyTOCSY (Total COrrelated SpectroscopY)Correlation through bonds DECCJCDDJDEE
NMR SpectroscopyCOSY vs. TOCSYCorrelation through bonds (J-coupling)COSYTOCSY
NMR SpectroscopyCOSY vs. TOCSYCorrelation through bonds (J-coupling)
NMR SpectroscopyGeneral schemes for 2D NMRRelative nverse)modern
NMR SpectroscopyHeteronuclear Single Quantum Coherence (HSQC)13C1H
NMR SpectroscopyProtein NMR2D NOESY
NMR SpectroscopyProtein NMR2D NOESY
NMR SpectroscopyProtein NMRIsotopically labeled proteins
NMR SpectroscopyProtein NMR1H-15NHSQC (protein’s fingerprint)15N1H
NMR SpectroscopyProtein NMRSignal overlap problem alleviated by 3D & 4D NMR110 ppm120 ppm130 ppm120 ppm130 ppm110 ppm15N15N15N1H1H1H6.5 ppm6.5 ppm6.5 ppm
NMR SpectroscopyProtein NMRSignal overlap problem alleviated by 3D & 4D NMR2D110 ppm3D120 ppm130 ppm120 ppm130 ppm110 ppm15N15N15N1H1H1H6.5 ppm6.5 ppm6.5 ppmF2 (15N)F3 (NH)
NMR SpectroscopyProtein NMRSignal overlap problem alleviated by 3D & 4D NMR
NMR SpectroscopyProtein NMRSignal overlap problem alleviated by 3D & 4D NMR
NMR SpectroscopyProtein NMRAssignment - Triple Resonance ExperimentsHCHNCCHHO3D HNCA
NMR SpectroscopyProtein NMRAssignment - Triple Resonance Experiments
NMR SpectroscopyProtein NMRAssignment - Triple Resonance .56.27.07.21Hppm7.88.58.0ppm
NMR SpectroscopyProtein NMRAssignment - Triple Resonance Experiments
NMR SpectroscopyProtein NMRAssignment - Triple Resonance ExperimentsHNCA130 ppm8.5HN(CO)CA130 ppm8.5i-1HNCA40HN(CO)CA125 ppm125 ppmHNCA40125 ppmHN(CO)CA125 ppm404545455050505555557.57.5i7.57.5i 1
NMR Spectroscopy N.M.R. Nuclear Magnetic Resonance Basic Principles Spectroscopic technique, thus relies on the interaction between material and electromagnetic radiation