Transcription
Supporting InformationAbsolute Configuration and Antibiotic Activity ofPiceamycinYern-Hyerk Shin,† Saeyeon Kang,‡ Woong Sub Byun,† Chang-Wook Jeon,§ Beomkoo Chung,‡Ji Yoon Beom, Suckchang Hong, Jeeyeon Lee, Jongheon Shin,† Youn-Sig Kwak,§ SangKook Lee,† Ki-Bong Oh,‡ Yeo Joon Yoon, and Dong-Chan Oh*,††Natural Products Research Institute, College of Pharmacy, Seoul National University, 1Gwanak-ro, Gwanak-gu, Seoul 08826, Republic of Korea‡Department of Agricultural Biotechnology, College of Agriculture & Life Sciences, SeoulNational University, 1 Gwanak-ro, Gwanak-gu, Seoul 08826, Republic of Korea§Department of Plant Medicine and IALS, Gyeongsang National University, 501 Jinju-daero,Jinju, Gyeongsang Nam-do 52828, Republic of Korea Department of Chemistry and Nanoscience, Ewha Womans University, Seoul 03760,Republic of Korea College of Pharmacy, Seoul National University, 1 Gwanak-ro, Gwanak-gu, Seoul 08826,Republic of KoreaCorresponding Author* D.-C. Oh, Tel: 82-2-880-2491, Fax: 82-2-762-8322, E-mail: dongchanoh@snu.ac.kr.S1
Table of ContentsS2. Table of ContentsS3. Figure S1. 1H NMR spectrum of piceamycin (1) at 500 MHz in DMSO-d6.S4. Figure S2. 13C NMR spectrum of piceamycin (1) at 212.5 MHz in DMSO-d6.S5. Figure S3. COSY NMR spectrum of piceamycin (1) at 500 MHz in DMSO-d6.Figure S4. HSQC NMR spectrum of piceamycin (1) at 500 MHz in DMSO-d6.S6. Figure S5. HMBC NMR spectrum of piceamycin (1) at 500 MHz in DMSO-d6.Figure S6. NOESY NMR spectrum of piceamycin (1) at 850 MHz in DMSO-d6.S7. Figure S7. 1H NMR spectrum of bombyxamycin C (2) at 850 MHz in DMSO-d6.S8. Figure S8. 13C NMR spectrum of bombyxamycin C (2) at 212.5 MHz in DMSO-d6.S9. Figure S9. COSY NMR spectrum of bombyxamycin C (2) at 500 MHz in DMSO-d6.Figure S10. HSQC NMR spectrum of bombyxamycin C (2) at 500 MHz in DMSO-d6.S10. Figure S11. HMBC NMR spectrum of bombyxamycin C (2) at 500 MHz in DMSO-d6.Figure S12. NOESY NMR spectrum of bombyxamycin C (2) at 850 MHz in DMSO-d6.S11. Figure S13. HR-FAB-MS data of 1.Figure S14. HR-FAB-MS data of 2.S12. Figure S15. Comparing the retention times of 3, 5, and S-PGME amide of authentic 2S-3-amino-2methylpropanoic acid.Figure S16. Comparing the retention times of 4, 6, and R-PGME amide of authentic 2S-3-amino-2methylpropanoic acid.S13. Table S1. 1H and 13C NMR data for 3-6 in CD3OD.Figure S17. ΔδS-R values in ppm between PGME amides of 3-amino-2-methylpropanoic acids (3-6).S14. Figure S18. 1H NMR spectrum of S-PGME amide of 2S-3-amino-2-methylpropanoic acid (3)at 850 MHz in CD3OD.Figure S19. 13C NMR spectrum of S-PGME amide of 2S-3-amino-2-methylpropanoic acid (3)at 212.5 MHz in CD3OD.S15. Figure S20. 1H NMR spectrum of R-PGME amide of 2S-3-amino-2-methylpropanoic acid (4)at 850 MHz in CD3OD.Figure S21. 13C NMR spectrum of R-PGME amide of 2S-3-amino-2-methylpropanoic acid (4)at 212.5 MHz in CD3OD.S16. Figure S22. 1H NMR spectrum of S-PGME amide of 2R-3-amino-2-methylpropanoic acid (5)at 850 MHz in CD3OD.Figure S23. 13C NMR spectrum of S-PGME amide of 2R-3-amino-2-methylpropanoic acid (5)at 212.5 MHz in CD3OD.S17. Figure S24. 1H NMR spectrum of R-PGME amide of 2R-3-amino-2-methylpropanoic acid (6)at 850 MHz in CD3OD.Figure S25. 13C NMR spectrum of R-PGME amide of 2S-3-amino-2-methylpropanoic acid (6)at 212.5 MHz in CD3OD.S18. Figure S26. HR-FAB-MS data of 3.Figure S27. HR-FAB-MS data of 4.S19. Figure S28. HR-FAB-MS data of 5.Figure S29. HR-FAB-MS data of 6.S20. Table S2. Energy-minimized modeling of 3S21. Table S3. Energy-minimized modeling of 4S22. Table S4. Energy-minimized modeling of 5S23. Table S5. Energy-minimized modeling of 6S24. Figure S30. Chromatographic analysis of (a) S-PGME and (b) R-PGME amide products of 3-amino-2methylpropanoic acid from 0.2 mg of 1.S25. Table S6. ECD calculation of 1 (8S, 24R)S26. Table S7. ECD calculation of 1 (8R, 24R)S27. Figure S31. NOESY correlations analysis and energy-minimized model of 1.S28. Figure S32. 1H NMR spectrum of S-MTPA ester (2a) of 2 at 850 MHz in CD3OD.Figure S33. COSY NMR spectrum of S-MTPA ester (2a) of 2 at 850 MHz in CD3OD.S29. Figure S34. 1H NMR spectrum of R-MTPA ester (2b) of 2 at 850 MHz in CD3OD.Figure S35. COSY NMR spectrum of R-MTPA ester (2b) of 2 at 850 MHz in CD3OD.S2
Figure S1. 1H NMR spectrum of piceamycin (1) at 500 MHz in DMSO-d6.Piceamycin (1)S3
Figure S2. 13C NMR spectrum of piceamycin (1) at 212.5 MHz in DMSO-d6.Piceamycin (1)S4
Figure S3. COSY NMR spectrum of piceamycin (1) at 500 MHz in DMSO-d6.Figure S4. HSQC NMR spectrum of piceamycin (1) at 500 MHz in DMSO-d6.S5
Figure S5. HMBC NMR spectrum of piceamycin (1) at 500 MHz in DMSO-d6.Figure S6. NOESY NMR spectrum of piceamycin (1) at 850 MHz in DMSO-d6.S6
Figure S7. 1H NMR spectrum of bombyxamycin C (2) at 850 MHz in DMSO-d6.Bombyxamycin C (2)S7
Figure S8. 13C NMR spectrum of bombyxamycin C (2) at 212.5 MHz in DMSO-d6.Bombyxamycin C (2)S8
Figure S9. COSY NMR spectrum of bombyxamycin C (2) at 500 MHz in DMSO-d6.Figure S10. HSQC NMR spectrum of bombyxamycin C (2) at 500 MHz in DMSO-d6.S9
Figure S11. HMBC NMR spectrum of bombyxamycin C (2) at 500 MHz in DMSO-d6.Figure S12. NOESY NMR spectrum of bombyxamycin C (2) at 850 MHz in DMSO-d6.S10
Figure S13. HR-FAB-MS data of 1.Figure S14. HR-FAB-MS data of 2.S11
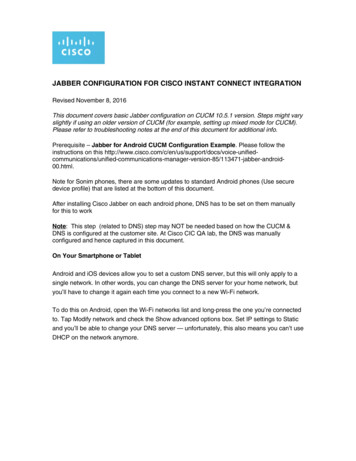
Figure S15. Comparing the retention times of 3, 5, and S-PGME amide of authentic 2S-3amino-2-methylpropanoic acid (ion extraction for [M H] m/z at 251).S-PGME amide of authentic 2S-3-amino-2-methylpropanoic acidrel (%)1000051015203 from S-PGME amides of racemic 3-amino-2-methylpropanoic acidrel (%)1000051015205 from S-PGME amides of racemic 3-amino-2-methylpropanoic acidrel (%)100005101520retention time (min)Figure S16. Comparing the retention times of 4, 6, and R-PGME amide of authentic 2S-3amino-2-methylpropanoic acid (ion extraction for [M H] m/z at 251).R-PGME amide of authentic 2S-3-amino-2-methylpropanoic acidrel (%)1000051015204 from R-PGME amides of racemic 3-amino-2-methylpropanoic acidrel (%)1000051015206 from R-PGME amides of racemic 3-amino-2-methylpropanoic acidrel (%)10000510retention time (min)S121520
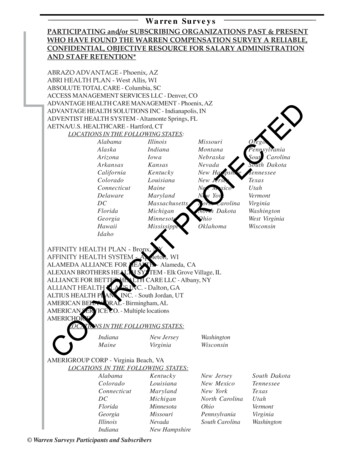
Table S1. 1H and 13C NMR data for 3-6 in CD3OD.3no.δCa, typeδHb, mult, (J in Hz)1a42.9, CH2 3.1548, dd (12.8, 8.2)1b3.0158, dd (12.8, 4.6)238.5, CH2.8757, m316.2, CH3 1.1987, d (7.1)4175.4, C553.2, CH5.5217, s6172.9, C758.2, CH3 3.7186, s8137.2, C9130.0, CH10128.8, CH11129.8, CH7.4025-7.3477, m12128.8 CH13130.0, CHa212.5 MHz, b 850 MHz.δCa, type42.7, CH238.4, CH16.4, CH3175.6, C53.0, CH172.5, C58.3, CH3137.0, C130.0, CH129.0, CH129.8, CH129.0, CH130.0, CH4δHb, mult (J in Hz)3.1472, dd (12.8, 8.2)2.9796, dd (12.8, 4.6)2.8344, m1.3128, d (7.1)5.4939, s3.7078, s7.4090-7.3501, mδCa, type42.7, CH238.4, CH16.4, CH3175.6, C53.0, CH172.5, C58.3, CH3137.0, C130.0, CH129.0, CH129.8, CH129.0, CH130.0, CH5δHb, mult (J in Hz)3.1480, dd (12.8, 8.2)2.9779, dd (12.8, 4.6)2.8363, m1.3114, d (7.1)5.4931, s3.7075, s7.4077-7.3494, mδCa, type42.9, CH238.5, CH16.2, CH3175.4, C53.2, CH172.9, C58.2, CH3137.2, C130.0, CH128.8, CH129.8, CH128.8, CH130.0, CH6δHb, mult (J in Hz)3.1549, dd (12.8, 8.2)3.0183, dd (12.8, 4.6)2.8745, m1.1992, d (7.1)5.5213, s3.7187, s7.4241-7.3442, mFigure S17. ΔδS-R values in ppm between PGME amides of 3-amino-2-methylpropanoicacids (3-6).ΔδS-R5: R S-PGME6: R R-PGMEΔδS-R3: R S-PGME4: R R-PGMES13
Figure S18. 1H NMR spectrum of S-PGME amide of 2S-3-amino-2-methylpropanoic acid (3)at 850 MHz in CD3OD.S-PGME amide of2S-3-amino-2-methylpropanoic acid (3)Figure S19. 13C NMR spectrum of S-PGME amide of 2S-3-amino-2-methylpropanoic acid (3)at 212.5 MHz in CD3OD.S-PGME amide of2S-3-amino-2-methylpropanoic acid (3)S14
Figure S20. 1H NMR spectrum of R-PGME amide of 2S-3-amino-2-methylpropanoic acid (4)at 850 MHz in CD3OD.R-PGME amide of2S-3-amino-2-methylpropanoic acid (4)Figure S21. 13C NMR spectrum of R-PGME amide of 2S-3-amino-2-methylpropanoic acid (4)at 212.5 MHz in CD3OD.R-PGME amide of2S-3-amino-2-methylpropanoic acid (4)S15
Figure S22. 1H NMR spectrum of S-PGME amide of 2R-3-amino-2-methylpropanoic acid (5)at 850 MHz in CD3OD.S-PGME amide of2R-3-amino-2-methylpropanoic acid (5)Figure S23. 13C NMR spectrum of S-PGME amide of 2R-3-amino-2-methylpropanoic acid (5)at 212.5 MHz in CD3OD.S-PGME amide of2R-3-amino-2-methylpropanoic acid (5)S16
Figure S24. 1H NMR spectrum of R-PGME amide of 2R-3-amino-2-methylpropanoic acid (6)at 850 MHz in CD3OD.R-PGME amide of2R-3-amino-2-methylpropanoic acid (6)Figure S25. 13C NMR spectrum of R-PGME amide of 2R-3-amino-2-methylpropanoic acid (6)at 212.5 MHz in CD3OD.R-PGME amide of2R-3-amino-2-methylpropanoic acid (6)S17
Figure S26. HR-FAB-MS data of 3.Figure S27. HR-FAB-MS data of 4.S18
Figure S28. HR-FAB-MS data of 5.Figure S29. HR-FAB-MS data of 6.S19
Table S2. Energy-minimized modeling of 3total energykinetic energypotential energy - 840.68015403485836.36200464106- 1677.04215867591Parameters of Level DFTDFT settings (functional B3-LYP / gridsize m3)Geometry optimization options (Energy 10-6 Hartree, Gradient norm d𝐸/d𝑥𝑦𝑧 10-3 Hartree/Bohr)Energy minimized coordinates of 3 at the basis set 6-31G for all atoms .007622S20
Table S3. Energy-minimized modeling of 4total energykinetic energypotential energy - 840.68024294244836.36777780232- 1677.04802074476Parameters of Level DFTDFT settings (functional B3-LYP / gridsize m3)Geometry optimization options (Energy 10-6 Hartree, Gradient norm d𝐸/d𝑥𝑦𝑧 10-3 Hartree/Bohr)Energy minimized coordinates of 4 at the basis set 6-31G for all atoms -2.35284S21
Table S4. Energy-minimized modeling of 5total energykinetic energypotential energy - 840.68020713328836.36564551297- 1677.04585264625Parameters of Level DFTDFT settings (functional B3-LYP / gridsize m3)Geometry optimization options (Energy 10-6 Hartree, Gradient norm d𝐸/d𝑥𝑦𝑧 10-3 Hartree/Bohr)Energy minimized coordinates of 5 at the basis set 6-31G for all atoms 70682.370722S22
Table S5. Energy-minimized modeling of 6total energykinetic energypotential energy - 840.68014373373836.36796664395- 1677.04811037768Parameters of Level DFTDFT settings (functional B3-LYP / gridsize m3)Geometry optimization options (Energy 10-6 Hartree, Gradient norm d𝐸/d𝑥𝑦𝑧 10-3 Hartree/Bohr)Energy minimized coordinates of 6 at the basis set 6-31G for all atoms 60.394966S23
Figure
College of Pharmacy, Seoul National University, 1 Gwanak-ro, Gwanak-gu, Seoul 08826, Republic of Korea Corresponding Author * D.-C. Oh, Tel: 82-2-880-2491, Fax: 82-2-762-8322, E-mail: dongchanoh@snu.ac.kr. S2 Table of Contents S2. Table of Contents S3. Figure S1. 1H NMR spectrum of piceamycin (1) at 500 MHz in DMSO-d6. S4. Figure S2. 13C NMR spectrum of piceamycin (1) at 212.5