Transcription
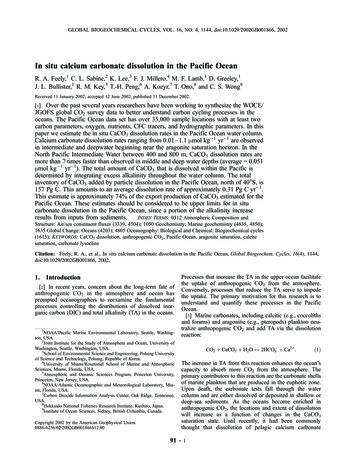
GLOBAL BIOGEOCHEMICAL CYCLES, VOL. 16, NO. 4, 1144, doi:10.1029/2002GB001866, 2002In situ calcium carbonate dissolution in the Pacific OceanR. A. Feely,1 C. L. Sabine,2 K. Lee,3 F. J. Millero,4 M. F. Lamb,1 D. Greeley,1J. L. Bullister,1 R. M. Key,5 T.-H. Peng,6 A. Kozyr,7 T. Ono,8 and C. S. Wong9Received 11 January 2002; accepted 12 June 2002; published 31 December 2002.[1] Over the past several years researchers have been working to synthesize the WOCE/JGOFS global CO2 survey data to better understand carbon cycling processes in theoceans. The Pacific Ocean data set has over 35,000 sample locations with at least twocarbon parameters, oxygen, nutrients, CFC tracers, and hydrographic parameters. In thispaper we estimate the in situ CaCO3 dissolution rates in the Pacific Ocean water column.Calcium carbonate dissolution rates ranging from 0.01–1.1 mmol kg 1 yr 1 are observedin intermediate and deepwater beginning near the aragonite saturation horizon. In theNorth Pacific Intermediate Water between 400 and 800 m, CaCO3 dissolution rates aremore than 7 times faster than observed in middle and deep water depths (average 0.051mmol kg 1 yr 1). The total amount of CaCO3 that is dissolved within the Pacific isdetermined by integrating excess alkalinity throughout the water column. The totalinventory of CaCO3 added by particle dissolution in the Pacific Ocean, north of 40 S, is157 Pg C. This amounts to an average dissolution rate of approximately 0.31 Pg C yr 1.This estimate is approximately 74% of the export production of CaCO3 estimated for thePacific Ocean. These estimates should be considered to be upper limits for in situcarbonate dissolution in the Pacific Ocean, since a portion of the alkalinity increaseINDEX TERMS: 0312 Atmospheric Composition andresults from inputs from sediments.Structure: Air/sea constituent fluxes (3339, 4504); 1050 Geochemistry: Marine geochemistry (4835, 4850);1635 Global Change: Oceans (4203); 4805 Oceanography: Biological and Chemical: Biogeochemical cycles(1615); KEYWORDS: CaCO3 dissolution, anthropogenic CO2, Pacific Ocean, aragonite saturation, calcitesaturation, carbonate lysoclineCitation: Feely, R. A., et al., In situ calcium carbonate dissolution in the Pacific Ocean, Global Biogeochem. Cycles, 16(4), 1144,doi:10.1029/2002GB001866, 2002.1. Introduction[2] In recent years, concern about the long-term fate ofanthropogenic CO2 in the atmosphere and ocean hasprompted oceanographers to reexamine the fundamentalprocesses controlling the distributions of dissolved inorganic carbon (DIC) and total alkalinity (TA) in the oceans.1NOAA/Pacific Marine Environmental Laboratory, Seattle, Washington, USA.2Joint Institute for the Study of Atmosphere and Ocean, University ofWashington, Seattle, Washington, USA.3School of Environmental Science and Engineering, Pohang Universityof Science and Technology, Pohang, Republic of Korea.4University of Miami/Rosenstiel School of Marine and AtmosphericSciences, Miami, Florida, USA.5Atmospheric and Oceanic Sciences Program, Princeton University,Princeton, New Jersey, USA.6NOAA/Atlantic Oceanographic and Meteorological Laboratory, Miami, Florida, USA.7Carbon Dioxide Information Analysis Center, Oak Ridge, Tennessee,USA.8Hokkaido National Fisheries Research Institute, Kushiro, Japan.9Institute of Ocean Sciences, Sidney, British Columbia, Canada.Copyright 2002 by the American Geophysical Union.0886-6236/02/2002GB001866 12.00Processes that increase the TA in the upper ocean facilitatethe uptake of anthropogenic CO2 from the atmosphere.Conversely, processes that reduce the TA serve to impedethe uptake. The primary motivation for this research is tounderstand and quantify these processes in the PacificOcean.[3] Marine carbonates, including calcitic (e.g., coccolithsand forams) and aragonitic (e.g., pteropods) plankton neutralize anthropogenic CO2 and add TA via the dissolutionreaction:2þCO2 þ CaCO3 þ H2 O 2HCO 3 þ Ca :ð1ÞThe increase in TA from this reaction enhances the ocean’scapacity to absorb more CO2 from the atmosphere. Theprimary contributors to this reaction are the carbonate shellsof marine plankton that are produced in the euphotic zone.Upon death, the carbonate tests fall through the watercolumn and are either dissolved or deposited in shallow ordeep-sea sediments. As the oceans become enriched inanthropogenic CO2, the locations and extent of dissolutionwill increase as a function of changes in the CaCO3saturation state. Until recently, it had been commonlythought that dissolution of pelagic calcium carbonate91 - 1
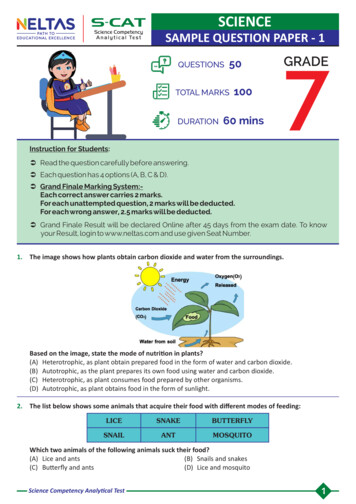
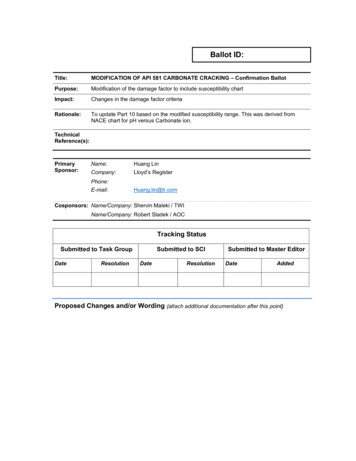
91 - 2FEELY ET AL.: IN SITU CALCIUM CARBONATE DISSOLUTIONFigure 1. Map of the station locations for the international WOCE/JGOFS global CO2 survey in thePacific Ocean (1991 – 1996).particles primarily occurs at great depths below the‘‘carbonate lysocline’’ [Sverdrup et al., 1941; Broecker,1977]. However, recent analyses of the global carbonatebudget and sediment trap data for the global oceans[Milliman, 1993; Milliman and Droxler, 1996; Milliman etal., 1999] have indicated that perhaps as much as 60– 80%of the calcium carbonate that is exported out of the surfaceocean dissolves in the upper 500– 1000 m, well above thecarbonate lysocline. In this paper, we examine the WOCE/JGOFS global CO2 survey data from the Pacific Ocean andprovide new estimates of calcium carbonate dissolutionrates in the water column based upon changes in TA.2. The WOCE/JGOFS Data[4] Between 1991 and 1996, carbon measurements weremade on 24 cruises in the Pacific Ocean. This research wasa collaborative effort between 15 laboratories and fourcountries. Figure 1 shows the nearly 2000 station locationswith carbon measurements in the Pacific. At least twocarbon parameters were measured on all cruises, but thechoice of which carbon system pairs were measured variedbetween cruises. The carbon system measurements aredescribed in detail in Feely et al. [1999]. The quality ofthe carbon data was evaluated by Lamb et al. [2002]. A setof adjustments for certain cruises were recommended basedon many lines of evidence including comparison of calibration techniques, results from certified reference materialanalyses, precision of at-sea replicate analyses, agreementbetween shipboard analyses and replicate shore-based analyses, comparison of deep water values at locations wheretwo or more cruises overlapped or crossed, consistency withother hydrographic parameters, and internal consistencywith multiple carbon parameter measurements. Lamb etal. [2002] estimated that the overall accuracy of the DICdata was 3 mmol kg 1. TA, the second most commoncarbon parameter analyzed, had an overall accuracy of 5 mmol kg 1. The TA was calculated for all cruises whereit was not measured using the carbonate dissociation constants of Merhbach et al. [1973] as refitted by Dickson andMillero [1987] and ancillary constants listed in the programof Lewis and Wallace [1998]. The final data set containedabout 35,000 sample locations with DIC and TA values.[5] The corresponding chlorofluorocarbon (CFC) sampleswere analyzed by the methods of Bullister and Weiss [1988]and the results were compiled and evaluated by the USWOCE CFC consortium. The Pacific synthesis of thechlorofluorocarbon data, led by J. Bullister, examined theoverall quality of the data and ensured that all of the valueswere reported on the same concentration scale. Although noadjustments were made to the final reported CFC values, thedata were carefully flagged based on examination of theentire data set.3. Analysis Method3.1. Anthropogenic CO2[6] Our approach for estimating anthropogenic CO2 in thePacific Ocean is modified from the techniques described byGruber et al. [1996]. Gruber et al. improved the earlierapproaches of Brewer [1978] and Chen and Millero [1979]by developing the DC* method. This method is based on thepremise that the anthropogenic CO2 concentration (Canth)can be isolated from measured DIC values (Cm) by sub-
FEELY ET AL.: IN SITU CALCIUM CARBONATE DISSOLUTIONtracting the contribution of the biological pumps (DCbio),the DIC waters that would have been in equilibrium with apreindustrial atmospheric CO2 concentration of 280 ppm(Ceq280), and a term that corrects for the fact that surfacewaters are not always in equilibrium with the atmosphere(DCdiseq):Canth¼¼Cm DCbio Ceq280 CdiseqDC* DCdiseq ;of water was last in contact with the atmosphere; (2) thechanges in TA resulting from the release of protons duringthe oxidation of organic matter; and (3) the TA added to thewater column via CaCO3 dissolution. In this study, weemployed the TA equation of Sabine et al. [2002] basedon near surface (0 – 60 m) data from the same Pacific dataset used here:ð2ÞTA ¼ 148:7 þ ð61:36 SÞ þ ð0:0941 POÞ ð0:582 qÞwhereCanth anthropogenic carbon concentration;Cm measured total carbon concentration;DCbio change in DIC as a result of biological activity(both organic and inorganic);Ceq280 DIC of waters in equilibrium with an atmosphericCO2 concentration of 280 matm;DCdiseq air-sea difference in CO2 concentration expressedin mmol kg 1 of DIC.[7] The three terms to the right of the first equal signmake up DC*, which can be explicitly calculated for eachsample. The fact that DC* is a quasiconservative tracerhelps remedy some of the mixing concerns arising from theearlier techniques [Sabine et al., 1999; Sabine and Feely,2001]. The DCdiseq term is evaluated over small isopycnalintervals using a water-mass age tracer such as CFCs[Sabine et al., 2002]. The quasiconservative tracer, DC*,is defined as the difference between the measured DICconcentration, corrected for biology and the concentrationthese waters would have at the surface in equilibrium with apreindustrial atmosphere (i.e., DC* Cm DCbio Ceq280). The DC* calculation used here is essentially thesame as that originally defined by Gruber et al. [1996] withtwo small differences: a modification of the preformedalkalinity term based on the new global survey data andthe addition of a denitrification term in the biologicalcorrection [see Sabine et al., 2002, for details].3.2. Calcite and Aragonite Saturation[8] The calcite and aragonite saturation levels were calculated using the program developed by Lewis and Wallace[1998]. The in situ degree of saturation of seawater withrespect to calcite and aragonite is the ion product of theconcentrations of calcium and carbonate ions, at the in situtemperature, salinity and pressure, divided by the stoichiometric solubility product for those conditions: 0¼ Ca2þ Ca2 3 K sp91 - 3ð3Þwhere the calcium concentration is estimated from thesalinity, and the carbonate ion concentration is calculatedfrom the TA data. The pressure effect on the solubility isestimated from the equation of Mucci [1983] that includesthe adjustments to the constants recommended by Millero[1995].3.3. CaCO3 Dissolution[9] The TA has three primary components in the watercolumn: (1) the preformed TA (TA ), fixed when the parcelð4Þwhere S is the salinity, PO O2 RO2/PHPO2 [after4Broecker, 1974], and q is the potential temperature. Thevalue of RO2/P of 170 is used in this work [Anderson andSarmiento, 1994].[10] The organic matter correction of Chen [1978], basedon changes in nitrate, was also adapted for use in this study.The largest component of this correction is from theoxidation of organic nitrogen. However, a coefficient of0.63 was proposed by Kanamori and Ikegami [1982] toinclude contributions from organic phosphorus and sulfur aswell. Rather than attempting to determine preformed nitratevalues, Chen’s equation was converted to apparent oxygenutilization (AOU) using the Anderson and Sarmiento [1994]N/O2 ratio of 16/170. For a given isopycnal surface, thechanges due to CaCO3 dissolution can be evaluated usingwhat we term TA*:TA* ¼ 0:5ðNTA NTA Þ þ 0:63ð0:0941 AOUÞð5Þwhere NTA (TA 35)/S, NTA (TA 35)/S and AOU isthe apparent oxygen utilization. Although this generalapproach has been used successfully for a number of years[e.g., Brewer et al., 1975; Chen, 1978; Chen et al., 1982;Chen, 1990; Sabine et al., 1995], the most commonhistorical notation of DCa is somewhat misleading sincethis calculation does not involve calcium measurements andthere are potential reactions, albeit minor, that could changethis value without changing the dissolved calcium. We feelthat the TA* term, in the spirit of the other star terms foundin the recent literature, is more appropriate [Gruber et al.,1996].4. Results and Interpretation4.1. Distributions of DIC and TA in the Pacific Ocean[11] In the Pacific Ocean the lowest concentrations ofDIC and TA are observed in surface waters. The surfaceconcentrations (DIC range: 1975 – 2200 mmol kg 1; TArange: 2200 – 2400 mmol kg 1) are roughly correlated withsalinity (Figures 2 and 3). DIC concentrations increase inthe intermediate waters to form a large maximum (2325–2375 mmol kg 1) at approximately 1800 – 2200 m in theNorth Pacific. In contrast, TA concentrations show localminima in the Antarctic Intermediate Water (AAIW) to thesouth and in the North Pacific Intermediate Water (NPIW)to the north. Below the North Pacific Intermediate Water,TA concentrations increase to a broad maximum at approximately 2200 – 4000 m (TA concentrations range from2400– 2460 mmol kg 1). The general structure of the DIC
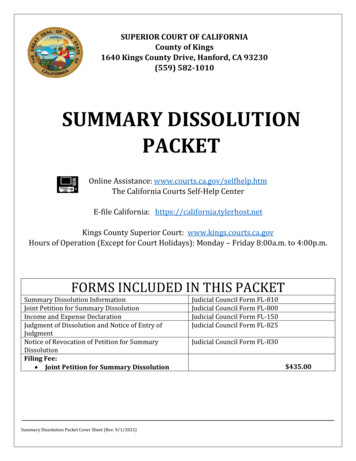
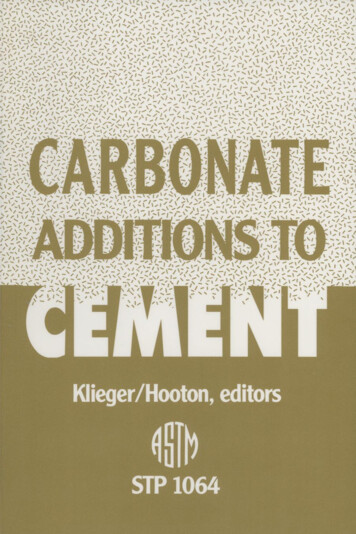
91 - 4FEELY ET AL.: IN SITU CALCIUM CARBONATE DISSOLUTIONFigure 2. Vertical distributions of (a) salinity, (b) DIC in mmol kg 1, (c) TA in mmol kg 1, and (d)potential density, sq, in the WOCE/JGOFS section P15S and P15N along 170 W in the Pacific.and TA fields are similar to the density structure in theupper 1000 m. This similarity is an indication of the strongcontrol that circulation plays in their distributions. Thedifferences between the DIC and TA, particularly in shallowand intermediate waters, are caused by in situ remineralization processes. The DIC maximum is shallower than the TAmaximum because DIC is more strongly influenced by theshallow remineralization of soft tissue organic carbon,whereas the TA is more strongly influenced by the dissolution of calcium carbonate particles deeper in the watercolumn [Chen, 1990]. Except for the region north of 30 N,bottom waters have lower DIC and TA concentrations thanthe waters at midwater depths because the deep and bottomwater circulation goes from south to north with upwardmixing such that the oldest waters are centered at midwaterdepths (e.g., 2000 – 3000 m) of the North Pacific [Stuiver etal., 1983].[12] The zonal DIC and TA isolines shoal from west toeast along 30 N in the P2 section in the North Pacific(Figure 3). Deep ventilation near the Kuroshio Extensionand the subsequent circulation in the subtropical gyregenerates the zonal gradient of DIC and TA in the upper1500 m of the water column. Both DIC and TA concentrations show the deepest ventilation near the coast andunder the Kuroshio Extension west of 160 E. These resultsare consistent with the CFC and anthropogenic CO2 dis-
FEELY ET AL.: IN SITU CALCIUM CARBONATE DISSOLUTION91 - 5Figure 3. Vertical distributions of (a) salinity, (b) DIC in mmol kg 1, (c) TA in mmol kg 1, and (d)potential density, sq, in the WOCE/JGOFS section P2 along 30 N in the North Pacific.tributions in the North Pacific that also indicate strongerventilation processes in the western Pacific [Warner et al.,1996; Sabine et al., 2002].4.2. Aragonite and Calcite Saturation HorizonMigrations[13] The level at which aragonite and calcite are inthermodynamic equilibrium is the saturation depth. Thisdepth is significantly shallower for aragonite than calcitebecause aragonite is more soluble in seawater than calcite(Figure 4). There is a pronounced shoaling of the aragoniteand calcite from south to north and from west to eastbecause of the higher DIC concentrations in northern andeastern regions relative to the TA concentrations (Figure 5;Feely et al., 1984). The general pattern of aragonite andcalcite saturation is consistent with previous results [Takahashi, 1975; Chen et al., 1988; Feely and Chen, 1982; Feelyet al., 1984, 1988; Kleypas et al., 1999].[14] The anthropogenic CO2 concentrations and the calculated aragonite and calcite saturation horizons are plottedfor both present day (dashed line) and preindustrial levels(solid line) for the P15 and P2 sections (Figures 6a and 6b,respectively). The preindustrial levels are calculated bysubtracting the anthropogenic CO2 values [Sabine et al.,
91 - 6FEELY ET AL.: IN SITU CALCIUM CARBONATE DISSOLUTIONFigure 4. Saturation depth in meters for (a) aragonite and (b) calcite estimated from water column DICand TA concentrations.
FEELY ET AL.: IN SITU CALCIUM CARBONATE DISSOLUTION91 - 7Figure 5. East-west section of DIC/TA ratio along 30 N in the North Pacific.2002] from the DIC values presented here. When thepreindustrial saturation horizons are compared to thepresent-day values, several distinct regions of upwardmigrations can be observed. The present-day aragonitesaturation horizon ranges from approximately 200 m to1320 m in the South Pacific with the greatest shoaling in theregion from approximately 30 S to 5 S in the eastern SouthPacific (Figure 4). In the North Pacific, the aragonitesaturation horizon shoals to a minimum of 220 m at about8 N, deepens to a maximum of about 580 m at 28 N, andshoals to its shallowest depth of approximately 120 m northof 50 N. An upward migration of the present-day saturationhorizon relative to the preindustrial saturation horizon southof 38 S is observed to be between 30– 80 m in the SouthPacific and between 30– 100 m in the North Pacific north of3 N. A similar shoaling of the aragonite and calcite saturation horizon is observed in the east-west P2 section(Figure 6b). The west to east shoaling of the aragoniteand calcite saturation horizons are consistent with theshoaling of the TA concentrations shown in Figure 3. Thisshoaling is the result of the deep ventilation and anticyclonic circulation in the North Pacific.[15] The calcite saturation sections in Figures 6a and 6bindicate that the saturation horizon is close to 3000 m in theSouth Pacific and dramatically shoals to about 700 m justnorth of 20 N in the North Pacific. From there, it shoals to aminimum at approximately 250 m north of 50 N. The datasuggest a distinct upward migration of the saturation horizon north of 20 N from the preindustrial period to thepresent ranging between 40 and 100 m. These results,indicating the shoaling of aragonite and calcite saturationhorizons due to the effects of anthropogenic CO2 ventilationin the surface and intermediate waters, imply that there maybe a potential for enhanced dissolution of CaCO3 particlesin the undersaturated waters [Sarma et al., 2002].4.3. CaCO3 Dissolution Rates[16] The WOCE/JGOFS global CO2 survey in the PacificOcean was used for estimating CaCO3 dissolution in thewater column. Figure 7 shows a wedge-like cutout sectionof TA* along 170 W, 30 N, and 150 W. Positive concentrations of TA* are observed in the shallow waters near orslightly above the aragonite saturation horizon. Below thishorizon, TA* concentrations increase rapidly from about10– 40 mmol kg 1. This gradient is primarily located in theIntermediate Waters of the North and South Pacific. Forexample, north of 20 N, the largest increase occurs betweenabout 400 – 1100 m, where the TA* increase is from 10 mmol kg 1 in the North Pacific to values 40 mmolkg 1 north of 40 N. In the South Pacific between 10 S and45 S, where the aragonite and calcite saturation horizons aremuch deeper, the largest gradients are between 800 m to1800 m. Farther south in the South Pacific, the TA* increasebegins at much shallower depths, consistent with the shoaling of the aragonite saturation horizon in these waters.These results suggest that the extent of CaCO3 dissolutionis somehow related to the degree of aragonite saturation.[17] Combining the above results with the apparent CFC11 age data from the WOCE global survey data on isopycnalsurface allows us to calculate the CaCO3 dissolution rates by
91 - 8FEELY ET AL.: IN SITU CALCIUM CARBONATE DISSOLUTIONFigure 6. Vertical distributions of anthropogenic CO2 concentrations in mmol kg 1 and thesupersaturation/undersaturation horizons for aragonite and calcite along (a) WOCE/JGOFS sectionP15S and P15N, and (b) WOCE/JGOFS section P2 in the Pacific Ocean.plotting TA* versus apparent CFC-11 ages (Figure 8). Theslope of the line gives a value for the average CaCO3dissolution rate along the isopycnal surface. The method islimited to surface and intermediate waters where the apparentCFC ages are less than about 30– 35 years due to mixing anddilution problems in the deeper waters. CaCO3 dissolutionrates calculated in this manner range from 0 in near-surfacewaters to a maximum exceeding 0.5 mmol kg 1 yr 1 in theintermediate waters (Figure 9). Lower rates are observedbelow the intermediate waters. The highest dissolution ratesin the South Pacific were at depths between 1000 and 1800 m(sq range: 27.3 – 27.6). In the North Pacific, the maximumdissolution rates were between 600 and 900 m (sq range:26.4 – 26.8).[18] Since the CFC-age method is limited to water massages less than about 30– 35 years, we used the natural 14Cages from samples collected on the same cruises toestimate CaCO3 dissolution rates in deeper waters. The14C decay rate of 1% every 83 years makes this isotopea good age tracer for dissolution processes in the deep sea.For waters 1500 m the mean CaCO3 dissolution rate inthe Pacific Deep Water was determined to be 0.051 mmolkg 1 yr 1, based on 853 data points. To define the spatialvariability of the deep-water dissolution rates these datawere subsetted by basin and examined on isopycnalsurfaces in a manner similar to the shallow dissolutionstudy. The dissolution rates were significantly lower thanthe shallow rates, ranging from 0.01 to 0.06 mmol kg 1yr 1. The highest rates were observed at a sq of 40.4(Figure 10). In contrast to the shallow analysis, the SouthPacific showed higher dissolution rates than the NorthPacific. It is possible that the more corrosive waters of theNorth Pacific result in less carbonate particles actuallyreaching the deep waters. Contamination from bomb 14Cprevents us from carrying the analysis to depths muchshallower than 1000 m.
FEELY ET AL.: IN SITU CALCIUM CARBONATE DISSOLUTION91 - 9Figure 7. Wedge-like cutout section of TA* in mmol kg 1 along 170 W, 30 N, and 135 W in the PacificOcean.[19] One can get a sense of the dissolution throughout thewater column from a plot of the average TA* as a functionof depth (Figure 11). The maximum signal is near 1100 m,just below the average depth of the aragonite saturationhorizon and well above the old southward return flow. Asecond local maximum is observed near 3800 m, just belowthe calcite saturation depth. A third maximum is observed inthe bottom-waters. This could be a benthic dissolutionFigure 8. Plot of TA* versus CFC-11 age for datacollected along the 26.65 sq surface in the North PacificIntermediate Water.Figure 9. In situ calcium carbon dissolution rates plottedas a function of potential density in the Pacific Ocean.
91 - 10FEELY ET AL.: IN SITU CALCIUM CARBONATE DISSOLUTIONFigure 10. Vertical profiles of average deepwater CaCO3dissolution rates in the North and South Pacific plotted as afunction of s3.signal. Although the waters at all levels intersect the bottom,by far the largest area of bottom is associated with watersdeeper than 4500 m.values (10 – 40 mmol kg 1) for depths between 300 and1200 m as that shown in Figure 7 for the 170 W sectionbased on the WOCE alkalinity measurements. Since theCFC-11 ages on isopycnal surfaces are very similar between170 W and 150 W in the North Pacific [Warner et al.,1996], the CaCO3 dissolution rates would also be verysimilar. Additional direct comparisons of the CaCO3 dissolution rates are given in Table 1, which compares the newresults from the WOCE survey with the results from earlierexpeditions and methods [Honjo, 1977; Honjo et al., 1995;Chen, 1990]. In shallow waters (200– 1300 m), the meanCaCO3 dissolution rate from the WOCE results, 0.36 mmolkg 1 yr 1, is within the range of estimates from the sedimentflux losses (0.005 – 1.83 mmol kg 1 yr 1) from the equatorial,tropical, and subpolar North Pacific. The results are somewhat lower than the global average sediment trap flux lossesgiven in Milliman et al. [1999], but significantly higher thanthe average for waters deeper than 1500 m. For waters 1500m the mean CaCO3 dissolution rate (0.051 mmol kg 1 yr 1) isnear the middle of the range of estimates from the previouswork (0.01– 0.11 mmol kg 1 yr 1) based on dissolved Ca andalkalinity data and deep water sediment trap flux losses.[21] The average TA* concentrations are highest at intermediate depths (Figure 11) because the dissolution rate inthe shallow waters of the North Pacific is approximately 7times faster than the deep-water dissolution rates. There areseveral possible mechanisms for the higher dissolution rates5. Discussion[20] The in situ TA* values and estimated dissolutionrates presented here can be directly compared with otherdata on shallow and deep water dissolution of CaCO3particles in the Pacific. Recent estimates of excess Ca basedon dissolved Ca measurements reported by Chen [2002] fora section along 150 W in the North Pacific give very similarTable 1. In Situ Calcium Carbonate Dissolution Rates in thePacific OceanStudyReferenceDepth Range,kmDeep Water ColumnLi et al. [1969] 1Tsunogai [1972] 1Tsunogai et al. [1973] 4Edmond [1974] 5Fiadeiro [1980] 1Tsunogai and Watanabe [1981] 1Feely et al. [1986] 1(TA and Ca data)Chen [1983, 1990] 2Chen [1983] (TA data) 2Chen [1983] (Ca data) 2This study (TA data) 1.0CaCO3 DissolutionRate, mmol kg 1 yr 10.090.0480.04 and 0.110.0480.060.0570.06Deep Sediment Trap StudiesTsunogai and Noriki [1991]0.5 – 11–22–33–44–55 NEQ12 SFigure 11. Plot of the average vertical profile of TA* inunits of mmol kg 1 for the Pacific Ocean.Equatorial Pacific [Honjo et al., 1995]2.2 – 3.92.3 – 3.61.3 – 3.6Shallow Water DissolutionHonjo et al. [1995] Traps(spring)0.1 – 1Betzer et al. [1984]0.1 – 1Rodier and LeBorgne [1997]0.1 – 0.32Floating trapsMilliman et al. [1999]0.35 – 0.5This Study (TA data)0.2 – 0051.830.120.681.560.36
FEELY ET AL.: IN SITU CALCIUM CARBONATE DISSOLUTIONat the shallower depths, including (1) dissolution of CaCO3particles in the guts of zooplankton [Takahashi, 1975;Bishop et al., 1980, 1986; Harris, 1994; Van der Wal etal., 1995; Pond et al., 1995]; (2) dissolution of CaCO3particles in microenvironments where bacterial oxidation oforganic matter can enhance the dissolution process [Jansenand Wolf-Gladrow, 2001]; and (3) dissolution of the moresoluble forms of CaCO3 in shallow waters, includingpteropods and high-Mg calcite [Byrne et al., 1984; Morseand Mackenzie, 1990]. Recent modeling efforts by Jansenand Wolf-Gladrow [2001] for copepods grazing on coccolithophorids indicate that dissolution of calcite in copepodguts ‘‘does not account for the majority of the observedcarbonate loss in the water column but may contribute asignificant portion.’’ On the other hand, the sharp increasein TA* near or below the aragonite saturation horizon in theNorth and South Pacific suggests that the more solublecarbonate phases may dissolve quite readily, and that theleast soluble carbonates remain preserved during transit todeeper levels. This is in agreement with the earlier in vitroexperiments by Byrne and colleagues [Byrne et al., 1984;Feely et al., 1988], showing that pteropod shells undergosignificant dissolution below the saturation horizon. Consequently, there is probably more than one mechanism thatcontributes to the increased alkalinity at shallow waterdepths.[22] The total amount of CaCO3 that has dissolved inPacific waters can be determined by integrating TA*throughout the water column. To remove the contributionfrom dissolution outside of the Pacific basin then transported in with the deep and intermediate waters, all valueswere normalized to the average concentrations at 40– 50 S.The total inventory of CaCO3 dissolution in the Pacificnorth of 40 S is 157 Pg C. This should be considered to bean upper limit, since some of the alkalinity input may haveoriginated from the sediments [Chen, 2002]. If one takes anaverage Pacific waters residence time of 500 yr [Stuiver etal., 1983], this would give an average dissolution rate ofapproximately 0.31 Pg C yr 1. This number is not exactsince the residence time and dissolution rates vary withdepth, but this at least provides a first order estimate of theoverall dissolution rate. This estimate is approximately 74%of the export production of CaCO3 estimated by Lee [2001]for the Pacific Ocean.6. Conclusions[23] Measurements from the WOCE/JGOFS/DOE/NOAAglobal CO2 survey in the Pacific Ocean indicate that watercolumn dissolution of CaCO3 in shallow waters 1500 maccounts for as much as 50% of the total water columndissolution. This is consistent with the reanalysis of thesediment trap data by Milliman et al. [1999]. These resultsimply that the resupply of alkalinity to the surface watersvia shallow water remineralization processes occur at muchfaster rates than in the deeper waters. The integrated effectin the Pacific is that up to approximately 0.31 Pg C yr 1 areremineralized in the water column. The measurable upwardmigration of the calcite and aragonite saturation horizonssince the preindustrial period suggest that the long-term91 - 11impacts of CaCO3 dissolution on the ocean’s ability toneutralize anthropogenic CO2 need to be considered infuture biogeochemical models.[24] Acknowledgments. We wish to acknowledge all of those whocontributed to the Pacific Ocean data set compiled for this project, includingthose responsible for the carbon measurements, the CFC measurements,and the Chief Scientists. This work was funded by NSF gr
were reported on the same concentration scale. Although no adjustments were made to the final reported CFC values, the data were carefully flagged based on examination of the entire data set. 3. Analysis Method 3.1. Anthropogenic CO 2 [6] Our approach for estimating anthropogenic CO 2 in the Pacific Ocean is modified from the techniques .