Transcription
Key PerformanceIndicators in the ClaimsManagement ProcessPresented by: David HenshawManager of National AccountsPractice Insight1
Session Description This session will focus on helping youunderstand how fast your claims are beingpaid, the rate of clean claims and denials byprocedure code as KPIs to improve financialperformance. We will introduce a program for qualifiedpractices to participate. This 3 month programwill focus on improving KPIs and includeexposure to tools designed to assist inmanaging these KPIs.2
Reporting mentProcessingElectronicPaymentProcessingERA DenialManager100% ox Servicesand AutomatedPayment Solutions3
Key Performance Indicators - examples Clean Claim Rates % of Claims Denied How fast are you being paid? Percent of AR Greater than 90 days Average Days in Accounts Receivable Billed amount vs. value at time of charge capture Gap between date-of-service and date billed Percentage of claims denied due to front-end edits vs.due to coding oversights Percentage of claims denied due toauthorization/referral, insurance information oreligibility oversight Blah blah blah4
Key Performance Indicators Focus Project will focus on: How fast your claims are being paid The rate of clean claims Denials by procedure code5
KPI #1 - Clean Claim Rate Definition – a claim that was accurately processed andreimbursed the first time it was submitted tothe payer. Submitting more clean claims and reducingdenial rates can be challenging due tocomplex and changing payerreimbursement policies and procedures The average U.S. provider has a cleanclaims rate ranging from about 75-85%.6
KPI #1 - Clean Claim Rate Why Important? Claims get paid faster Optimize reimbursement- The average monthly underpaymentis 889* ICD-10 readiness Less expense fixing claims- It costs up to 25 to resubmit a claim*7
KPI #1 - Clean Claim Rate Practice Insight Tools General Claim Scrubbing Use of custom edits Clinical Claim Scrubbing Denied Claims8
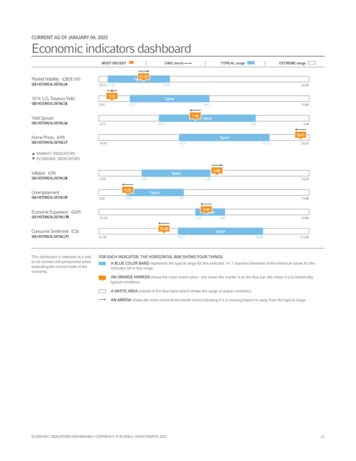
Clinical Claim ScrubbingAlpha II Claimstaker Fully Integrated with Practice Insight Scrubs both institutional and professionalclaims Custom edits can be created with an advanced“edit wizard”9
Clinical Claim Scrub Edits Physicians QualityReporting System (PQRS) Correct Coding Initiative(CCI) CPT, ICD, and modifier Date Demographics Evaluation andManagement (E/M) Medical Necessity(LCD/NCD, commercial,proprietary) POS Provider Reimbursement Units10
Clinical Claim Scrubbing - example11
KPI #2 - How Fast Are you Being Paid? Definition The time it takes from Date of Service toDate Claim Submitted (and Accepted)toInsurance Payer. Claims flagged with status to find claims invarious status, INVALID, REJECTED, ACCEPTED, PAID,DENIED, others12
KPI #2 - How Fast Are you Being Paid? Why Important? Faster turnaround time on your money Increased Cash FloW 13
KPI #2 - How Fast Are you Being Paid? Practice Insight Tools: Task Manager Reporting and Dashboards Workflow analysis Clinical Claim Scrubbing14
Task Manager ToolPowerful tool to create workflows for all team members that are working claims. Youcan get as details as you need to assign claim types to employees. Managers caneasily see what items team members have outstanding that need to be worked.Common Tasks Invalid &Rejected Denied Claims Unpaid claims Pended or AppealedclaimsAll tasks can be setup bypayer, providers, alpharange or much more!15
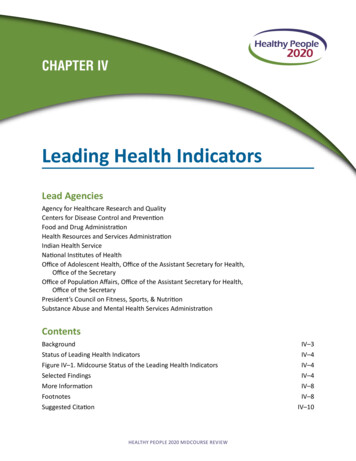
Powerful REPORTING Tools DASHBOARDSCLEAN CLAIM REPORTSDATAMINERICD 10 ANALYSISStaff ProductivityClaim Aging ReportReports can scheduled to runautomatically as well!Billing Summit 201516
Clean Claim Report04/20/15Billing Summit 201517
KPI #3 - Denials by Procedure Code HIPAA EDI ANSI Standard Codes. Examine reasons for insurance denials. Denial Reasons give you an explanation fordenial. Examining will help determine whatand how to correct. Fix the front end so youdon’t have to deal with on the back end.18
KPI #3 - Denials by Procedure Code Why important: less time spent on denials and follow up get paid faster.19
KPI #3 - Denials by Procedure Code Practice Insight Tools: Reports Dashboards Task Manager Workflow Assessment ERA and Denial Manager20
Powerful REPORTING Tools DASHBOARDSCLEAN CLAIM REPORTSDATAMINERICD 10 ANALYSISStaff ProductivityClaim Aging ReportReports can scheduled to runautomatically as well!Billing Summit 201521
Task Manager ToolPowerful tool to create workflows for all team members that are working claims. Youcan get as details as you need to assign claim types to employees. Managers caneasily see what items team members have outstanding that need to be worked.Common Tasks Invalid &Rejected Denied Claims Unpaid claims Pended or AppealedclaimsAll tasks can be setup bypayer, providers, alpharange or much more!22
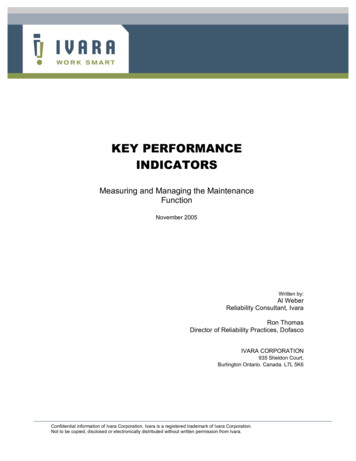
Denial RATES BY Procedure23
ERA and Denial Manager24
Practice Insight/MicroMD KPI ImprovementProjectThis program will focus on the three KPIs inorder to maximize reimbursement. Perform Analysis of Practice – focus on KPIs Determine Strategies to Improve KPIs. Plan and implement PI Tools Training and Orientation Monthly check up At end of period (3 months) – Review benchmarksfrom beginning of program and compare to end.25
Practice Insight/MicroMD KPI ImprovementProject - KPIIP Practice Must: Use Practice Insight and MicroMD Must agree to participate in the program Must be able to devote resource toimplement strategies Tools will be provided at no cost for 3 monthprogram. Other requirements 4 initial practices as a pilot26
Questions?27
reimbursed the first time it was submitted to the payer. Submitting more clean claims and reducing denial rates can be challenging due to complex and changing payer reimbursement policies and procedures The average U.S. provider has a clean claims rate ranging from about 75-85%. KPI #1 - Clean Claim Rate