Transcription
SouthCarolinaIndustryAnalysisAn examination ofinformation on SouthCarolina’s Industries2016
South Carolina Department of Employment and Workforce1South Carolina 2016 Industry Analysis
South Carolina Department of Employment and WorkforceThe Business Intelligence Department (BID) of the South Carolina Department of Employmentand Workforce (SCDEW) publishes the 2016 South Carolina Industry Analysis. Data collectedfrom sources throughout South Carolina and the United States form the basis of the informationand analyses provided in this publication.About SCDEW and BID:The Business Intelligence Department compiles and publishes employment statistics, jobforecasts, wage data, demographics, and other labor market information to help public andprivate organizations, researchers, and others better understand today’s complex workforce.The Business Intelligence Department produced this report under the leadership of:Executive Director - Cheryl StantonSouth Carolina Department of Employment and Workforce1550 Gadsden Street Columbia, South Carolina 29201(803) h Carolina 2016 Industry Analysis
South Carolina Department of Employment and Workforce3South Carolina 2016 Industry Analysis
South Carolina Department of Employment and WorkforceTable of ContentsExecutive Summary . 6Introduction . 7Industry Gross Domestic Product (GDP) . 8South Carolina Real GDP by Industry . 8South Carolina Industry Change in Real GDP . 8Industry Employment and Wages . 12Industry Location Quotients . 12Characteristics of Industry by Firm Size . 12Comparison of Industry Employment, Turnover, and Earnings . 13Industry Employment Projections . 13Top Occupations by Industry Sector . 13Regional Industry Projections . 21Selected Industry Descriptions . 24Construction: NAICS 23 . 24Manufacturing: NAICS 31-33 . 24Real Estate and Rental and Leasing: NAICS 53 . 25Professional, Scientific, and Technical Services: NAICS 54 . 25Administrative and Support and Waste Management and Remediation Services: NAICS 56. 25Other Services (except Public Administration): NAICS 81 . 26Required Language. 264South Carolina 2016 Industry Analysis
South Carolina Department of Employment and WorkforceList of FiguresFigure 1- United States and South Carolina Gross Domestic Product (GDP) . 9Figure 2 - South Carolina Industry Real Gross Domestic Product . 10Figure 3 - South Carolina Industry Real GDP Annual Percent Change . 11Figure 4 - South Carolina Employment and Wages, 2015 . 14Figure 5 - South Carolina Industry Location Quotients. 15Figure 6 - South Carolina Average Beginning of Quarter Employment by Firm Size. 16Figure 7 - South Carolina Industry Employment Turnover . 17Figure 8 - South Carolina Industry Average Monthly Earnings . 187Figure 9 - South Carolina Industry Average Quarterly Employment . 18Figure 10 - South Carolina Industry Employment Projections, 2014-2024 . 19Figure 11 - South Carolina's Top Five Occupations by Industry Sector . 20Figure 12 – South Carolina Region Map . 231Figure 13 – South Carolina Industry Employment Projections by Region, 2012-2022 . .235South Carolina 2016 Industry Analysis
South Carolina Department of Employment and WorkforceExecutive SummarySouth Carolina’s Gross Domestic Product (GDP) reached 198.7 billion in 2015 compared to theU.S. figure of 17.8 trillion. The top three industry sectors in the state in GDP terms areManufacturing; Finance, Insurance and Real Estate; and Professional and Business Services. Thestate’s economy grew from 161 billion in 2009 to 177 billion in 2015 in real dollars. Industrygrowth was mixed over the period, but Health Care and Social Assistance; Accommodation andFood Services; and Wholesale Trade trended upward.The average annual salary for South Carolina’s wage and salary workers in 2015 was 42,001with the Utilities industry having the highest average annual salary. Industries having acompetitive advantage in the state with strong location quotients include Manufacturing andAccommodation and Food Services. Over half of jobs in a 4-quarter period spanning 2014 and2015 were in firms with over 500 or more employees and 18 percent were in firms with fewerthan 20 employees. A comparison of employment turnover and earnings shows that highturnover and low wages go together in some industries.South Carolina’s economy is projected to grow by 169,000 jobs or 8.26 percent in the 10-yearperiod from 2014 to 2024. These latest industry projections show that Health Care and SocialAssistance is estimated to expand by nearly 40,000 jobs, while Administrative and Support andWaste Management is anticipated to grow over 26,000 jobs. All major private industry sectorsare expected to gain, while Government is expected to shrink slightly.Top occupations in terms of employment for each industry give insight into the actual workactivities being performed. For example, Team Assemblers and Machinists compose toppositions in the Manufacturing industry. Customer Service Representatives are among the topoccupations in seven industry sectors.Industry employment projections on a regional level show that the Upstate region should havethe largest future employment, followed by the Central region. Construction and Health Care andSocial Assistance are expected to have strong growth in every region. Manufacturing in theUpstate is projected to remain the largest single industry sector in any region.6South Carolina 2016 Industry Analysis
South Carolina Department of Employment and WorkforceIntroductionSouth Carolina’s economy has rebounded well since the depths of the Great Recession.Interestingly, Mark Vitner, Wells Fargo’s Senior Economist, gives a reason why. “The economicgood fortune is largely due to an astonishing run of economic development that helped drawthousands of high-paying manufacturing jobs to the state. Much of this industrial developmenthas come from overseas.”1Mr. Vitner’s report highlights the progress of the state’s Manufacturing industry. This report willhighlight the state’s overall economy, emphasizing the major industrial sectors from severalperspectives. First is an examination of the state’s industry GDP in current dollars. Next,industry trends in real dollar terms are discussed. Industry employment, wages, and locationquotients as well as characteristics of industries by firm size follow. Then, a comparison ofindustry employment, turnover, and earnings gives additional insight into the state’s economy.Employment projections and top industry occupations present more detail. A breakdown ofindustry projections by region shows how the state is expected to grow from a geographical pointof view. Finally, selected industry descriptions explain work activities for specific sectors.1Mark Vitner, Wells Fargo Securities, “South Carolina in the Spotlight: February sc-economicupdate-02162016.pdf, accessed August 16, 2016.7South Carolina 2016 Industry Analysis
South Carolina Department of Employment and WorkforceIndustry Gross Domestic ProductGross Domestic Product is defined as the total market value of goods and services produced inthe country. This metric is the primary means by which economists judge the strength of theeconomy. It is measured using two data elements -- current dollars or not inflation-adjusted andreal dollars or inflation-adjusted dollars. In 2015, the nation’s GDP in current dollars was 17.8trillion, and South Carolina’s GDP was 198.7 billion as shown in Figure 1. This statistic isoften quoted in the media when it is stated that the U.S. has a 17 trillion economy.The private sector is responsible for the vast majority of output at well over 80 percent for thenation and the state. In terms of industry breakdown for the nation, the Finance, Insurance andReal Estate sector leads in size at 20.4 percent, followed by Professional and Business Servicesat 12.3 percent, and Manufacturing at 12.2 percent. For South Carolina, the top three industriesare Manufacturing and Finance, Insurance and Real Estate each at 16.8 percent and Professionaland Business Services at 10.4 percent. Government represents 12.4 percent of the economy inthe nation, and 15.6 percent in the state.South Carolina Real GDP by IndustryEconomists use real GDP, being adjusted for inflation, to analyze the trends in the economy overtime. The table in Figure 2 presents South Carolina’s real GDP by industry sector from 2009 to2015 in 2009 dollars along with trend charts for each industry. The year 2009 was the low pointfor the state’s economy overall in the recent past as South Carolina has grown in real terms everyyear since. The state had a 177 billion economy in 2015 in real dollars, growing from 161billion in 2009.Some of the state’s industries have been trending upward, such as Health Care and SocialAssistance; Accommodations and Food Services; and Wholesale Trade, while the progress forothers have been mixed, like Construction and Manufacturing. The Durable Goods segment ofManufacturing has seen strong growth, while the Nondurable Goods segment was lower in 2015than in 2009.South Carolina Industry Change in Real GDPAnother way to analyze the trends in the economy is to view the percent annual change byindustry as presented in Figure 3. As can be observed, the state’s industries’ real output fell by3.7 percent from 2008 to 2009, but it increased thereafter. The percent change perspective makesit easier to see how up and down the recovery has been in the state. Only the Health Care andSocial Assistance industry segment did not see negative change over the period from 2008forward, carrying the Education and Health Care sector. Some of the swings from one year to thenext have been great. For example, the Finance and Insurance industry grew by 18.3 percentfrom 2008 to 2009 but fell by over five percent the next year. The Administrative and Waste8South Carolina 2016 Industry Analysis
South Carolina Department of Employment and WorkforceServices industry trended in the opposite direction over the same timeframe as the Finance andInsurance industry by falling 6.0 percent in 2009 and growing by 16.3 percent in 2010.Figure 1United States and South Carolina Gross Domestic Product (GDP), 2015United StatesPercent ofTotal 17,830,307100.0% 198,714100.0% 15,623,40687.6% 167,70584.4%Agriculture, forestry, fishing, and hunting 196,0091.1% 1,3020.7%Mining 304,8881.7% 2680.1%Utilities 288,3331.6% 4,6622.3%Construction 716,9174.0% 8,9494.5% 2,167,75712.2% 33,44416.8% 1,175,3276.6% 19,7339.9% 992,4305.6% 13,7116.9%Wholesale trade 1,080,4296.1% 11,6775.9%Retail trade 1,049,6985.9% 14,6247.4%Transportation and warehousing 527,6563.0% 4,7342.4%Information 868,0084.9% 5,2162.6% 3,635,58820.4% 33,39116.8%Finance and insurance 1,275,4517.2% 8,4934.3%Real estate and rental and leasing 2,360,13713.2% 24,89812.5% 2,192,40712.3% 20,61810.4% 1,269,8237.1% 10,0675.1%Management of companies and enterprises 360,9362.0% 1,8000.9%Administrative and waste management services 561,6483.1% 8,7514.4% 1,491,8828.4% 14,7707.4% 200,2521.1% 1,4040.7% 1,291,6317.2% 13,3666.7%Arts, entertainment, recreation, accommodation, and food services 703,8113.9% 9,0134.5%IndustryAll industry totalPrivate industriesManufacturingDurable goods manufacturingNondurable goods manufacturingFinance, insurance, real estate, rental, and leasingProfessional and business servicesProfessional, scientific, and technical servicesEducational services, health care, and social assistanceEducational servicesHealth care and social assistancePercent ofTotalArts, entertainment, and recreation 183,3431.0% 1,4410.7%Accommodation and food services 520,4692.9% 7,5723.8%Other services, except government 400,0202.2% 5,0352.5% 2,206,90112.4% 31,00915.6%GovernmentSource: U.S. Bureau of Economic AnalysisNote: Amounts in millions of current dollars9SouthCarolinaSouth Carolina 2016 Industry Analysis
South Carolina Department of Employment and WorkforceFigure 2South Carolina Industry Real Gross Domestic Product (GDP), 2009-2015Real GDP in millions of chained 2009 dollarsIndustryAll industry totalTrend Chart2009201020112012201320142015 161,045 163,968 167,352 167,708 169,493 173,785 177,141Private industries 133,183 136,950 140,166 140,190 142,472 146,841 149,970Agriculture, forestry, fishing, and hunting 1,192 1,160 839 932 1,143 959 1,073 279 211 205 194 226 254 247Utilities 4,347 4,890 4,941 4,459 4,464 4,318 4,060Construction 7,870 7,242 6,904 7,152 7,368 7,396 7,728 25,240 27,204 28,662 28,655 28,203 29,501 29,468Durable goods manufacturing 13,487 14,762 16,583 17,440 17,253 17,897 18,044Nondurable goods manufacturing 11,753 12,445 12,137 11,344 11,085 11,732 11,564 8,736 8,852 9,038 9,271 9,605 10,106 10,567 11,915 12,063 12,032 12,087 12,488 12,953 13,333Transportation and warehousing 3,474 3,670 3,820 3,880 3,916 4,030 4,071Information 4,466 4,456 4,372 4,377 4,819 5,031 5,322 28,204 28,233 28,993 28,194 28,671 29,219 29,576 8,162 7,727 7,570 7,039 6,984 6,963 7,058 20,043 20,517 21,452 21,206 21,754 22,338 22,600 15,101 16,313 17,237 17,515 17,538 18,379 18,983Professional, scientific, and technical services 7,540 7,741 8,243 8,361 8,410 8,725 9,136Management of companies and enterprises 1,415 1,431 1,517 1,614 1,683 1,754 1,759Administrative and waste management services 6,146 7,145 7,480 7,543 7,448 7,904 8,086 11,600 11,771 12,051 12,131 12,429 12,893 13,438 1,118 1,127 1,145 1,159 1,135 1,165 1,172 10,482 10,644 10,906 10,972 11,296 11,731 12,273 6,718 6,921 7,208 7,351 7,464 7,660 7,885Arts, entertainment, and recreation 1,088 1,128 1,184 1,195 1,219 1,250 1,326Accommodation and food services 5,630 5,793 6,023 6,156 6,244 6,410 6,561Other services, except government 4,041 3,983 3,979 4,042 4,114 4,187 4,278 27,862 27,033 27,212 27,538 27,057 26,996 27,231MiningManufacturingWholesale tradeRetail tradeFinance, insurance, real estate, rental, and leasingFinance and insuranceReal estate and rental and leasingProfessional and business servicesEducational services, health care, and social assistanceEducational servicesHealth care and social assistanceArts, entertainment, recreation, accommodation, and food servicesGovernmentSOURCE: U.S. Bureau of Economic Analysis10South Carolina 2016 Industry Analysis
South Carolina Department of Employment and WorkforceFigure 3South Carolina Industry Real Gross Domestic Product (GDP) Annual Percent Change, 2009-2015IndustryTrend Chart2008-2009 2009-2010 2010-2011 2011-2012 2012-2013 2013-2014 2014-2015All industry griculture, forestry, fishing, and .8-1.4-16.71.32.12.63.65.24.6Retail trade-3.21.2-0.30.53.33.72.9Transportation and 1.60.14.83.3Professional, scientific, and technical services-5.72.76.51.40.63.74.7Management of companies and enterprises-8.71.16.06.44.34.20.3Administrative and waste management 4.2Educational services4.40.81.61.2-2.12.60.6Health care and social 2.9Arts, entertainment, and recreation-7.03.75.00.92.02.56.1Accommodation and food services-7.12.94.02.21.42.72.4Other services, except .7-0.20.9Private industriesConstructionManufacturingDurable goods manufacturingNondurable goods manufacturingWholesale tradeFinance, insurance, real estate, rental, and leasingFinance and insuranceReal estate and rental and leasingProfessional and business servicesEducational services, health care, and social assistanceArts, entertainment, recreation, accommodation, and food servicesGovernmentSOURCE: U.S. Bureau of Economic AnalysisThe Construction industry fell from 2008 to 2011 but has rebounded with strong growth. Severalindustries have recovered well since the bottom of the recession in 2009, including WholesaleTrade; Professional, Scientific, and Technical Services; and Arts, Entertainment, Recreation,Accommodations, and Food Services.11South Carolina 2016 Industry Analysis
South Carolina Department of Employment and WorkforceIndustry Employment and WagesOther metrics used in analyzing the state’s economy are the employment and wages of workersin the various industries. Figure 4 highlights these statistics for the year 2015, and it shows thatSouth Carolina had 1.950 million jobs covered by the state’s unemployment insurance programwith an average salary of 42,001 overall. Total wages for those jobs in 2015 reached nearly 82billion. The Government sector had the most jobs at 343,000, followed by Retail Trade with242,000, and Manufacturing with 236,000 jobs. The Utilities industry had the highest averagesalaries at 88,950 in 2015, followed by Management of Companies at 71,577, and Mining at 68,370.Industry Location QuotientsA location quotient (LQ) indicates how an industry’s concentration of employment in a statecompares to its concentration in the nation. For example, an LQ of 2.0 for one of SouthCarolina’s industries means that the industry has twice the concentration of employment in thestate as it does in the nation. Economic developers use this statistic to help understand whichindustries have a competitive advantage in an area. Figure 5 presents the LQs for the state’sindustry sectors in 2015.South Carolina has five industries that have LQs greater than 1.0. The leading sector is theUtilities industry with an LQ of 1.60, followed by Manufacturing with an LQ of 1.37, andAdministrative and Waste Services with an LQ of 1.28. Accommodation and Food Services hasan LQ of 1.16, while Retail Trade’s location quotient is 1.11. These figures support the notion ofSouth Carolina having a strong manufacturing and tourist economy.Characteristics of Industry by Firm SizeAnalyzing the number of jobs by firm size gives a deeper dive into the characteristics of thestate’s industries. Figure 6 presents a table of private sector industry employment by fivecategories of firm size for the one-year period starting in the third quarter of 2014 throughsecond quarter of 2015. Overall, there were 1.568 million jobs with 51 percent or 803,000 in the500 Employee category and 18 percent or 284,000 in the 0-19 Employee category.The top three industries having the most jobs in the smallest size firm category are Retail Tradewith 37,316 positions, Accommodation and Food Services with 37,226, and Construction with33,459. On the opposite end of the spectrum, Retail Trade had the most jobs in the largestcategory with 158,604. Manufacturing had 156,306 jobs, and Administrative and Support andWaste Management had 95,473.The top three industries having the most employees on a percent basis in the largest size firmcategory are Utilities with 77 percent of jobs, Information at 75 percent, and Management ofCompanies at 74 percent. The Other Services industry has the highest percent of jobs in the12South Carolina 2016 Industry Analysis
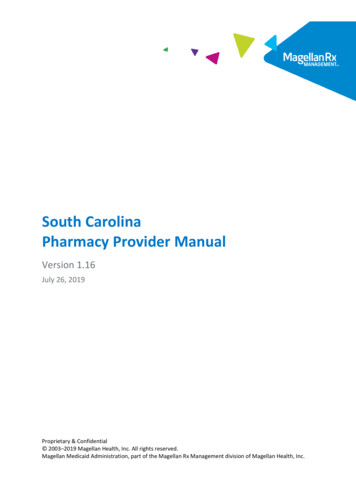
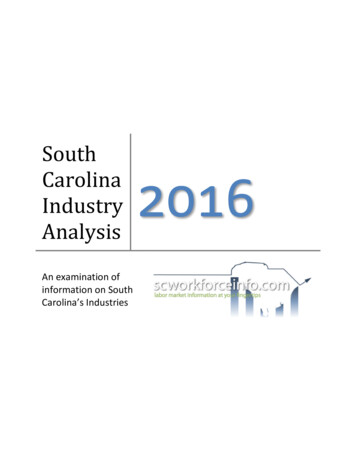
South Carolina Department of Employment and Workforcesmallest size category at 53 percent, followed by Agriculture, Forestry, Fishing, and Hunting at46 percent, and Construction at 40 percent.Comparison of Industry Employment, Turnover, and EarningsExamining South Carolina’s employment turnover, average monthly earnings, and employmentlevels by industry reveals interesting information. Figures 7, 8, and 9 illustrate these dataelements in a bar chart. Administrative and Support and Waste Management has the highestemployee turnover rate at over 18 percent in a 4-quarter period, shown in Figure 7. This industrysupports the Manufacturing sector, among others, with the Temporary Help subsector, whichleads to higher turnover. Accommodation and Food Services; Arts, Entertainment, andRecreation; and Retail Trade each had turnover rates over 11 percent. Not coincidentally, thesethree industries had the lowest average monthly earnings as illustrated in Figure 8. In addition,three of the four previously mentioned industries are among the leaders in level of employmentas well. This analysis highlights the nature of the tourist sector to a large degree. High levels ofemployment with low wages and high turnover are typical in this seasonal industry cluster.Industry Employment ProjectionsSouth Carolina’s economy is projected to grow by 169,456 jobs or 8.26 percent in the 10-yearperiod 2014 to 2024 according to SCDEW’s latest statewide industry employment projections,shown in Figure 10. The top three industries in terms of numeric growth are Health Care andSocial Assistance with an additional 39,408 jobs, Administrative and Support and WasteManagement growing by 26,530, and Accommodation and Food Services with 20,004 in jobgrowth. On a percent basis, the Administrative and Support and Waste Management industry hasthe most growth at 17.40 percent, followed by Health Care and Social Assistance at 16.71percent, and Construction at 13.79 percent. All industries are projected to grow with theexception of Government, which is estimated to decline slightly.Top Occupations by Industry SectorOccupational employment for industries gives insight into the actual work being performed ineach sector. Figure 11 illustrates the top five occupations by employment level for each of the20 industry sectors. The Administrative and Support sector gives support to other industriesthrough the Temporary Help subsector. Team Assemblers and Laborers, found in theManufacturing industry, are top occupations in this sector.13South Carolina 2016 Industry Analysis
South Carolina Department of Employment and WorkforceFigure 4South Carolina Employment and Wages, 2015IndustryCodeIndustryAverageWeeklyWageAverage Percent of Percent ofAnnualTotalTotalPayEmployment ,779 363,758,387 649 33,7460.6%0.4%Total Wages11Agriculture, forestry, fishing and hunting21Mining, quarrying, and oil and gas extraction1151,238 84,647,312 1,315 68,3700.1%0.1%22Utilities25112,345 1,098,114,724 1,711 88,9500.6%1.3%23Construction10,90786,933 4,178,484,830 924 48,0654.5%5.1%235,824 13,349,739,574 1,089 56,60912.1%16.3%31-3342Manufacturing5,423Wholesale trade8,42070,820 4,519,637,218 1,227 63,8183.6%5.5%17,776241,760 6,310,421,315 502 26,10212.4%7.7%44-45Retail trade48-49Transportation and warehousing2,98458,355 2,374,392,855 782 40,6893.0%2.9%51Information2,08126,948 1,541,540,824 1,100 57,2051.4%1.9%52Finance and insurance7,02966,881 4,181,996,499 1,202 62,5293.4%5.1%53Real estate and rental and leasing4,74528,183 1,157,224,377 790 41,0611.4%1.4%54Professional and technical services15,17288,315 5,853,981,382 1,275 66,2854.5%7.1%55Management of companies and enterprises71216,662 1,192,623,206 1,376 71,5770.9%1.5%56Administrative and waste services7,719157,088 5,164,128,170 632 32,8748.1%6.3%61Educational services1,38024,342 858,938,252 679 35,2861.2%1.0%62Health care and social assistance9,641190,988 8,576,619,668 864 44,9079.8%10.5%71Arts, entertainment, and recreation1,79728,810 553,488,103 369 19,2121.5%0.7%72Accommodation and food services10,088210,103 3,493,637,913 320 16,62810.8%4.3%81Other services, except public administration11,47450,584 1,575,243,043 599 31,1412.6%1.9%92Government342,842 15,465,887,556 868 45,11117.6%18.9% 808 42,001100.0%100.0%Total4,039122,8131,949,802 81,894,505,208Source: U.S. Bureau of Labor Statistics (BLS), Quarterly Census of Employment and Wages (QCEW). Only includes jobs covered by unemploymentinsurance laws.14South Carolina 2016 Industry Analysis
South Carolina Department of Employment and WorkforceFigure 5South Carolina Industry Location Quotients, 2015IndustryCodeIndustryLocationQuotient (LQ)11Agriculture, forestry, fishing and hunting0.6221Mining, quarrying, and oil and gas ufacturing1.37Wholesale trade0.8644-45Retail trade1.1148-49Transportation and warehousing0.9151Information0.7052Finance and insurance0.8353Real estate and rental and leasing0.9654Professional and technical services0.7355Management of companies and enterprises0.5456Administrative and waste services1.2861Educational services0.6462Health care and social assistance0.7471Arts, entertainment, and recreation0.9572Accommodation and food services1.1681Other services, except public administration0.8431-3342Source: U.S. Bureau of Labor Statistics (BLS), Quarterly Census of Employment andWages (QCEW).15South Carolina 2016 Industry Analysis
South Carolina Department of Employment and WorkforceFigure 6South Carolina Average Beginning of Quarter Employment, 2014 Quarter 3 - 2015 Quarter 2Firm SizeIndustry CodeIndustry0All NAICS Sectors11Agriculture, Forestry, Fishing and Hunting210-1920-4950-249250-499500 Employees Employees Employees Employees EmployeesAll 834,8812,0661,2381,1831,34310,711Mining, Quarrying, and Oil and Gas 90156,306235,089Wholesale Trade12,7587,91411,0995,27732,41269,46044-45Retail nsportation and mation2,0891,3562,46596920,36627,24452Finance and Insurance9,5452,5147,7113,87944,79968,44853Real Estate and Rental and al, Scientific, and Technical ment of Companies and ative and Support and Waste cational Services3,5053,0084,9731,84110,76224,08762Health Care and Social ts, Entertainment, and dation and Food er Services (except Public 3342Source: U.S. Census Bureau, Longitudinal Employer-Household Dynamics (LEHD) Program16South Carolina 2016 Industry Analysis
South Carolina Department of Employment and WorkforceFigure 7Figure 817South Carolina 2016 Industry Analysis
South Carolina Department of Employment and WorkforceFigure 918South Carolina 2016 Industry Analysis
South Carolina Department of Employment and WorkforceFigure 10South Carolina Industry Employment Projections, jectedEmployment EmploymentTotal Employment, All Agriculture, forestry, fishing, and hunting210000Mining, quarrying, and oil and gas ing230,154238,3178,1633.55420000Wholesale trade68,18971,6293,4405.04440000Retail Trade236,872248,52211,6504.92480000Transportation and 26,45026,9965462.06520000Finance and insurance66,66969,8243,1554.73530000Real estate and rental and leasing27,26129,0971,8366.73540000Professional, scientific, and technical services84,97795,57310,59612.47550000Management of companies and enterprises17,00517,7707654.50560000Administrative and support and waste management and nal servic
South Carolina Department of Employment and Workforce 6 South Carolina 2016 Industry Analysis Executive Summary South Carolina's Gross Domestic Product (GDP) reached 198.7 billion in 2015 compared to the