Transcription
A Local Clean Energy Future for NorthCarolinaMarch 29, 2016Bill Powers, P.E.Powers EngineeringPrepared for NC WARN1
Challenge: customers want local clean energy, state policy isclean energy, yet much of what is built is gas-fired power andconventional transmission infrastructuresource: CEC, Pio Pico Energy Center – Final Staff Assessment, cover photo, May 2012.2
[YOUR UTILITY HERE] is focused primarily on expandingconventional infrastructure – big rate increases, slowerprogress on local green power Investor-owned private utility focused onmaximizing shareholder value. Maximum profit realized by buildingtransmission lines. Example - Seventeen Midwest 345 kVtransmission projects: many billions,ostensibly to move wind power fromGreat Plains to urban centers east ofMississippi River (or could be gas-firedpower, or mix). Locating renewables outside of localreliability area (LCA) increases need formore gas-fired generation inside LCA.3
Local Capacity Areas (LCA) – California Examplesource: ICF Jones & Stokes, Electric Grid Reliability Impacts for Regulation of Once-Through Cooling in California, April 2008, Figure 1.4
Sample Local Capacity Area (LCA) in North Carolinasource: Carolina Country Magazine, 2013; red circle around DEP West added by B. Powers.5
New natural gas-fired power plants are single most dominantsource of new supplysource: Greentech Media, Solar Jumps to 22% of New US Generation Capacity in 2013, April 8, 2014.6
California seen as clean energy leader, yet state built about 60percent of all gas-fired capacity installed nationwide in 2013 –North Carolina followed same pattern that yearsource: Greentech Media, Solar Jumps to 22% of New US Generation Capacity in 2013, April 8, 2014.7
Reason given by [YOUR UTILITY HERE] for proposing XYZgas-fired project – local reliability and addressingintermittent renewable energysource: 1) AES, Alamitos Energy Center Application for Certification – Section 1.0 Executive Summary CEC Docket 13-AFC-01, February3, 2014, p. 1-1, and 2) Section 2.0 Project Description, p. 2-1. [YOUR UTILITY HERE] has identified a need for power generationfacilities in the western sub-area of the ABC Local Reliability Area toreplace the coal-fired plants that are expected to retire as a result of[YOUR STATE HERE] clean energy targets. As [YOUR STATE HERE]’s intermittent renewable energy portfoliocontinues to grow, operating in either load following or partial shutdownmode will become necessary to maintain electrical grid reliability, thusplacing an increased importance upon the rapid startup, high turndown,steep ramp rate, and superior heat rate of the configuration employedat the XYZ gas-fired power plant.8
Solar and wind output is very predictable, do not needfast-start gas turbines to address variabilitysource: CAISO homepage graphic, April 29, 2013, 9 pm. yellow available resources; solid blue actual demand; light bluedashed hour-ahead demand forecast; purple dashed day-ahead demand forecast.9
Local reliability – meeting demand underextreme conditions in “load pockets” 1-in-10 year extreme demand peak hour load. Loss of largest single transmission line or generator (federalstandard). Must have sufficient local resources, in addition to remainingavailable transmission lines, to meet peak demand.10
“Steady peak demand growth means [YOUR UTILITY HERE]must build now.” Reality – no peak load growth on grid in adecade, and probably none in the future – driven by appliancestandardssource: CAISO OASIS database, actual Southern California Edison 1-hour peak 052006200720082009201020112012201320142015Year11
Excellent state energy strategy - local distributed (smallscale) energy, predominantly green powersource: CEC 2007 Integrated Energy Policy Report, December 2007, p. 155.12
Electricity supply loading order “preferredresources” – order in which state must meet newdemandsource: CPUC, Decision 14-03-004, Decision Authorizing Long-Term Procurement for Local Capacity Requirements Due to Permanent Retirement of theSan Onofre Nuclear Generations Stations, March 13, 2014, pp. 13-14. Energy efficiency & demand response Renewable energy Combined heat & power(local small-scale, high efficiency natural gas-fired) Conventional utility-scale natural gas-fired13
Climate action and energy security the right way– cheaper, better, faster, no environmentalimpactssource: California Energy Efficiency Strategic Plan (2008, 2011) Energy efficiency & demand response & rooftop solar(net zero energy buildings: energy efficiency rooftop solar) All new residential homes net zero by 2020 All new commercial buildings net zero by 2030 25% of existing residential net zero by 2020 50% of existing commercial net zero by 2030 30 – 40% reduction in existing building electricity demand via energyefficiency measures Reduce air conditioning loads by 50% by 202014
The key is customer-owned rooftop solarsources: B. Powers , Powers Engineering Comment Letter on Draft DRECP NEPA/CEQA, February 23, 2015. 1,940 MW to 5,256 MW by 2017. California 2013 law mandates big increase in customer-ownedrooftop solar target for investor-owned utilities Result - accelerating rooftop solar installation rates in California:should reach target by mid-2016 at current installation rates:– 2013: 1,000 MW installed– 2014: 1,300 MW installed Should reach 5,256 MW target by mid-2016 at current rooftopinstallation rates. Utilities working hard to derail further rooftop solar expansion.15
The right solution – rooftop solar and battery powersources:: 1) CPUC D.13-10-040, Decision Adopting Energy Storage Procurement Framework and Design Program, October 17,2013, Table 2, p. 15, 2) CPUC D. 13-02-015, Decision Authorizing Long-Term Procurement for Local Capacity Requirements,February 13, 2013, p. 131, and 3) Southern California Edison, Application A.14-11-012, before California Public UtilitiesCommission, November 24, 2014. California utilities required to install 1,325 MW of energystorage. Must be under contract by 2020. California utilities already identifying battery storage as morecost-effective than peaking gas-fired power plants.16
Energy security benefit of local power: riding-out theunexpected when the grid goes downsource: Discover Magazine, Blackout of the Century, February 2016.17
Blackout, September 8, 2011- reliability of SoCalutilities in doubt , despite all the transmission lines &gas turbinessource: FERC, Arizona-Southern California Outages on September 8, 2011, cover photo, April 27, 2012.18
Taking control of local clean energy initiativessource of photos: B. Powers19
Residential battery systems can compete economicallywith new peaking gas turbines if paid the same forcapacitysource: San Diego Gas & Electric July 2014 customer bill insert, impact on rates of 600 MW Carlsbad Energy Center; a) battery costestimates by B. Powers (sealed lead-acid gas mat) and Mobile Solar (wet lead-acid forklift batteries converted for home energyapplication. Ratepayers pay 220 per kilowatt-year for new peaking gas turbine capacity– insurance policy for day when supplies are tight. Home battery system cost (retail): 4,000 - 6,000 for 30 kilowatt-hours orwhich 24 kilowatt-hours available if necessary. Residential system can send 8 kilowatts to grid for up to three hours. Residential system can send 8 kilowatts to grid for up to three hours. If paid same utility pays for peaking power, residential system earns 1,800per year. Simple payback of the batteries, for this purpose alone, is 2 to 3 years. Batteries guaranteed for 7-10 years.20
Politics and Power Five (5) utility commissioners, appointed by Governor Approved by the state senate, lots of utility interest Commission decides what hardware gets built, constantly lobbied Union Project Labor Agreements – “PLAs” – make utility-scale gas-fired andrenewable energy projects very formidable politically Community choice energy alternative – sometimes political ball bouncesagainst status quo:– Option in numerous states: Illinois, Massachusetts, California, others– City or County takes control of electricity supply to residents– Lots of momentum behind this option in California due to frustration withutilities.21
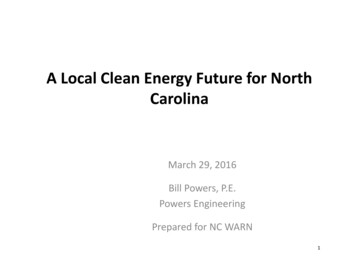
WHAT IS CCA?Established by State law, CCA allows cities and counties to pool their residential, businessand municipal electricity loads, and to purchase power (and/or generate it*) on theirbehalf. Energy transmission, distribution, repair and customer service functions remainwith the incumbent utility. *Where allowed by state CCA lawUtility
Reasons California counties and cities are transitioningto community choice energy Local control of electricity supply Ability to focus on local economic development Potential to reduce rates Authority to accelerate development of local clean power Provides competition to incumbent utility City of San Diego mandated target – 100% clean energy by2035, vehicle of choice is community energy structure23
Conclusions Utility claims that more gas-fired power plants and associatedtransmission infrastructure is needed ring hollow underscrutiny. More rigorous appliance standards primarily responsible for flatand declining peak loads and energy usage. Local solar power with batteries is the long-term clean powerand energy security solution and it is ready for prime time. Local community control of energy supply is the best model fora rapid transition to local clean energy.24
Carolina March 29, 2016 Bill Powers, P.E. Powers Engineering . Sample Local Capacity Area (LCA) in North Carolina source: Carolina Country Magazine, 2013; red circle around DEP West added by B. Powers. 5. . Discover Magazine, Blackout of the Century , February 2016. 17. Blackout, September 8, 2011-reliability of SoCal .