Transcription
A Multivariate Timeseries Modeling Approach to Severity of Illness Assessmentand Forecasting in ICU with Sparse, Heterogeneous Clinical DataMarzyeh GhassemiMarco A.F. Pimentel Tristan NaumannComputer ScienceMITCambridge, MA 02139 USAmghassem@mit.eduEngineering ScienceUniversity of OxfordOxford, UKmarco.pimentel@eng.ox.ac.ukComputer ScienceMITCambridge, MAtjn@mit.eduThomas BrennanDavid A. CliftonEngineering ScienceHealth Science TechnologyUniversity of OxfordMITOxford, UKCambridge, MAdavidc@robots.ox.ac.uktpb@mit.eduAbstractThe ability to determine patient acuity (or severity ofillness) has immediate practical use for clinicians. Weevaluate the use of multivariate timeseries modelingwith the multi-task Gaussian process (GP) models usingnoisy, incomplete, sparse, heterogeneous and unevenlysampled clinical data, including both physiological signals and clinical notes. The learned multi-task GP(MTGP) hyperparameters are then used to assess andforecast patient acuity. Experiments were conductedwith two real clinical data sets acquired from ICU patients: firstly, estimating cerebrovascular pressure reactivity, an important indicator of secondary damage fortraumatic brain injury patients, by learning the interactions between intracranial pressure and mean arterialblood pressure signals, and secondly, mortality prediction using clinical progress notes. In both cases, MTGPsprovided improved results: an MTGP model providedbetter results than single-task GP models for signal interpolation and forecasting (0.91 vs 0.69 RMSE), andthe use of MTGP hyperparameters obtained improvedresults when used as additional classification features(0.812 vs 0.788 AUC).1IntroductionMotivation Decisions in the intensive care unit (ICU) arefrequently made in settings with a high degree of uncertaintybased on a wide variety of data sources, such as vital signs,clinical notes, fluids, medications, etc. Clinical data collection is rapidly expanding, but these data are often sparse andirregularly sampled, and contaminated by a variety of noiseinterference and human error. The ICU is playing an expanding role in acute hospital care (Vincent 2013), and in suchdata-heavy settings, a more concise representation of patientrecords would help clinical staff to quickly assess patientstate and plan care. The first two authors contributed equally on this work.Corresponding author.Copyright c 2015, Association for the Advancement of ArtificialIntelligence (www.aaai.org). All rights reserved.†Peter SzolovitsMengling Feng †Computer ScienceMITCambridge, MApsz@mit.eduHealth Science TechnologyMITCambridge, MAmfeng@mit.eduGoal High quality clinical care depends on the ability tocombine heterogeneous clinical data to understand the severity of illness (acuity) in patients. Clinical research oftenuses risk of mortality as a surrogate for patient acuity, oftenevaluated at a single end point, such as after 28-days postdischarge. Most acuity scores rely on static snapshots of apatient and do not incorporate evolving clinical informationsuch as new notes, lab values, etc. Our goal is to providea concise representation of these multiple related timeseriesso that they can be compared and assessed.Challenge The general issue of comparing signals that arenot aligned and irregularly sampled has been considered before (see 2.2). Establishing similarity metrics among timeseries data is an important part of many learning tasks andoften is achieved using a variety of summarization methods.However, many modeling methods fail when applied to irregularly sampled data unless strong assumptions are madeabout the functional form present in the underlying datasource. Furthermore, in cases where such methods work,data imputation is often necessary, which can introduce additional sources of error and bias. Finally, many methodswork on a single timeseries, but fail to generalize to (or takeadvantage of) other related time-series data. In the remainder of this paper, we refer to noisy, sparse, heterogeneous,irregularly sampled data as ”irregularly-sampled” data.Solution Our proposed technique transforms a variety ofirregularly-sampled clinical data into a new latent space using the hyperparameters of multi-task GP (MTGP) models.Patients are compared based on their similarity in the newhyperparameter space. Our work differs from other workin that it: 1) uses the correlation between and within multiple time-series to estimate parameters instead of consideringeach timeseries separately; 2) infers a compact latent representation of the source data, rather than finding patterns thatare common within different timeseries; and 3) leverages theinformation contained in the inferred model hyperparameters for supervised learning, whereas others use the predictedmean function of the GP as a pre-processing or smoothingstep (see 2.3).
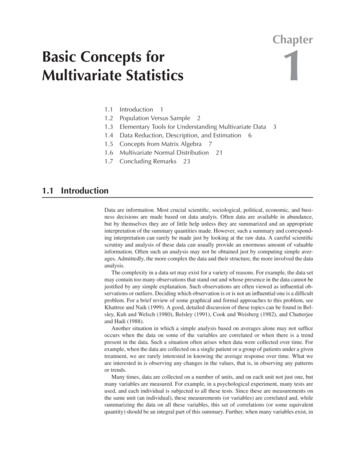
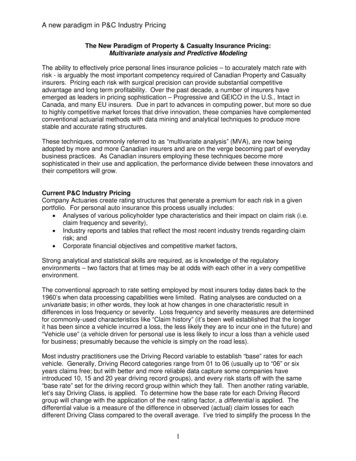
Contributions This paper makes the following contributions: We propose a method using MTGP for forecasting patientacuity based on irregularly sampled heterogeneous clinical data. We propose a new latent space for representing multidimensional timeseries using inferred MTGP hyperparameters. We evaluate our approach in two ways: 1) estimating andforecasting a cerebrovascular autoregulation index fromnoisy physiological time-series data in patients who suffered a traumatic brain injury and 2) transforming irregular ICU patient clinical notes into timeseries, and usingMTGP hyperparameters from these timeseries as featuresto predict mortality probability.22.1Related WorkClinical AssessmentIn the clinical world, there are practical examples of databeing used to infer patient acuity in the form of ICU scoring systems. ICU scoring systems such as SAPS (simplifiedacute physiology score) use physiologic and other clinicaldata for acuity assessment. However, in 2012 scoring systems were used in only 10% to 15% of US ICUs (Breslowand Badawi 2012). Recent work has focused on feature engineering for mortality prediction. This is usually accomplished by windowing or aggregating the structured numerical data so that a single feature matrix can be fed into astructured deterministic classifier (Hug and Szolovits 2009;Lehman et al. 2012; Joshi and Szolovits 2012; Ghassemi etal. 2014).2.2Timeseries AbstractionThe timeseries abstraction/summarization literature dealsmore directly with the time-varying nature of data. Dynamic time warping measures similarity between two temporal sequences that may vary in time or speed (Li andClifford 2012). Another approach is time-series symbolization, which involves discretizing timeseries into sequencesof symbols and attaching meaning to the groupings of thesymbols (Lin et al. 2007; Saeed and Mark 2006; Syed andGuttag 2011). These approaches rely on some known regularity underlying a signal (e.g. ECG signals), and are often unsuitable for irregularly sampled timeseries. Full latent variable models have been applied to abstracting signals into higher level representations. For example, Foxet al. used beta processes to model multiple related timeseries (Fox et al. 2011), and Marlin et al. used Gaussian mixture models on the first 24 hours of monitor-signals data withhourly-discretization (Marlin et al. 2012). Nevertheless, latent variable approaches are unable to cope with missingand unevenly-sampled data as is, and require either strongassumptions about observations when they change asynchronously, or the computationally expensive approach ofmodeling time between observations directly as another latent variable.Figure 1: Graphical model for (a) m single-task Gaussianprocesses with m sets of: inputs X i , temporal covariancehyperparameters θti , estimated functions f i , noise terms σ i ,and outcomes y i ; and (b) a multi-task Gaussian processwhich relates m tasks through all prior variables, with thetasks’ labels l and similarity matrix θc .2.3Gaussian ProcessesGaussian processes (GP) form the basis for a Bayesian modeling technique that has been used for various machinelearning tasks (Rasmussen and Williams 2006). Most commonly, GPs are used to predict a single output (denoted hereas “task”) based on one or more input timeseries. We referto this model as a single-task GP (STGP). Lasko et al. attempted to use Gaussian process regression as a smoothingfunction of irregularly-sampled signals (Lasko, Denny, andLevy 2013). This is a common usage model for GPs on clinical timeseries: GPs are used to model observed data throughthe predicted mean function of the timeseries. Clifton et al.used GPs as a framework for coping with data artifacts andincompleteness in mobile sensor data (Clifton et al. 2013b).In a related work (Clifton et al. 2013a), a functional version of extreme value statistics was proposed for physiological data in order to compare different timeseries. Similarly,GPs were used for robust regression of noisy heart rate data(Stegle et al. 2008). The remainder of the related work hasused STGP models to predict a single output based on oneor more input variables.3MethodsIn the present study, we explore the potential of a novel approach using MTGP models (Bonilla, Chai, and Williams2007) to learn the correlation between and within timeseries, and obtain a concise representation of time-varyingphysiological and clinical data based on the inferred hyperparameters.Here, we motivate the use of MTGPs and describe themethod (source code is available on-line1 ) that we haveadapted for hyperparameter construction (Durichen et al.2014).1http://www.robots.ox.ac.uk/ davidc/publications MTGP.php
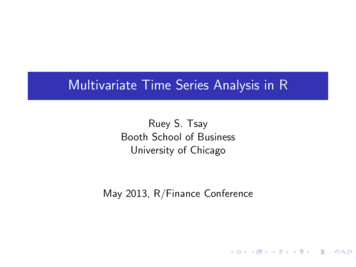
Figure 2: (a) A sample function with 4 tasks; (b) Single-task GP (STGP) and (c) multi-task GP (MTGP) predictions on alltasks. The dots represent observations, while dashed lines and colored areas represent the predictive mean and 95% confidenceinterval, respectively. The line on the bottom represents the mean absolute error (over the 4 tasks) between the predictions andthe correspondent reference values. We observe that the overall error obtained in (c) is lower than that in (b), which suggeststhat the use of MTGP yielded better predictions by taking into account the correlation between the different tasks.3.1Multi-Task Gaussian Process ModelsThe general STGP framework may be extended to the problem of modeling m tasks simultaneously where each modeluses the same index set x (e.g., physiological or clinicaltimeseries). A naı̈ve approach is to train a STGP model independently for each task, as illustrated in Figure 1(a). Weintroduce instead an extension to multi-task GP models proposed in (Bonilla, Chai, and Williams 2007), which makesuse of the covariance in related tasks to reduce uncertaintyin the inferred signal.Let Xn {xji j 1, ., m, i 1, ., nj } andYn {yij j 1, ., m, i 1, ., nj , } be the training indices and observations for the m tasks, where task jhas nj number of training data. We consider the regressionmodel yn g( xn ) , in which g(x) represents the latent function and N (0, σn2 ) is a noise term. GP modelsassume that the function g( xn ) can be interpreted as a probability distribution over functions such that ỹn g( xn ) GP m( xn ), k( xn , x0n ) , where m( xn ) is the mean functionof the process (assumed 0) and k( xn , x0n ) is a covariance function describing the coupling among the independent variables xn as a function of their kernel distance. Tospecify the affiliation of index xji and observation yij to taskj, a label lj j is added as an additional input to the model,as shown in Figure 1(b). To model the correlation betweentasks as well as the temporal behaviour of the tasks within aunified GP model, two independent covariance functions areassumed, and the covariance matrix KM T for all m taskscan be writtenKM T (Xn , l, θ c , θ t ) Kc (l, θ c ) Kt (Xn , θ t )(1)where is the Kronecker product, l {j j 1, ., m},Kc and Kt represent the correlation and temporal covariance functions, and θ c and θ t are vectors containing hyperparameters for Kc and Kt , respectively. Within geostatistics, this approach is also known as the intrinsic correlationmodel (Wackernagel 2003).By modifying the temporal covariance function we canencode our prior knowledge concerning the functional be-havior of the tasks that we wish to model. The mostfrequently-used example is the squared-exponential covariance function (Rasmussen and Williams 2006):Kt 2θAk x x0 k2exp 22θL ,(2)where θ t {θA , θL }, and θA and θL are hyperparametersmodeling the y-scaling and x-scaling (or time-scale if thedata are timeseries) of the covariance function, respectively.To construct a valid positive semidefinite correlation covariance function Kc , we used the Cholesky decompositionand the “free-form” parameterization of the elements of thelower triangular matrix L proposed in (Bonilla, Chai, andWilliams 2007), such asθc,1θc,2.θc,3θc,k m 2θc,k m 2 Kc LL , L 0. 00 . . θc,k(3)where k i 1 i is the number of correlation hyperparameters.Identically to STGPs, the hyperparameters θ for aMTGP may be optimized by minimizing the negative logmarginal likelihood via gradient descent (Rasmussen andWilliams 2006), and predictions for test indices {x p , l p }can be made by computing the conditional probabilityp(yp x p , lp , xn , ln , yn ).Figure 2 shows an example of STGPs and an MTGPapplied to a simple synthetic dataset with 4 sample tasks.Tasks 1 and 2 were correlated, task 1 and task 2 wereboth anti-correlated with task 4, and task 3 was uncorrelated with all other tasks. For this, 4 tasks were sampledfrom a MTGP model with the following hyperparameters:θL θA θc,1 θc,2 θc,3 θc,6 θc,10 1,θc,4 θc,5 θc,0 0, and θc,7 θc,8 1. Artificialgaps were then randomly created in different tasks at different time points and with different durations. The STGPPm
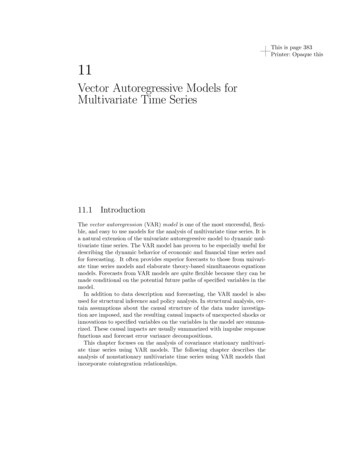
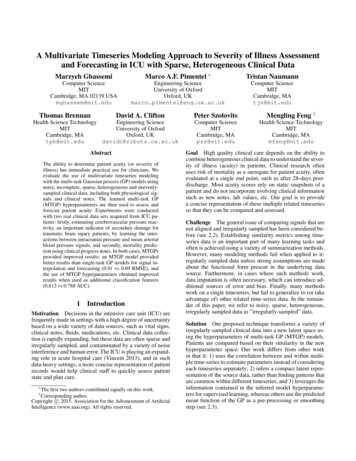
Intracranial PressuremmHgMean Arterial Pressure(a)Time (minutes)(b)(c)Time (minutes)(d)Figure 3: An example of a single-task GP (STGP) and multi-task GP (MTGP) applied to intracranial pressure (ICP) and meanarterial blood pressure (ABP) signals from a traumatic brain injury patient. (a) and (c) show the performance of STGP, whereas(b) and (d) show the improved performance of MTGP, which takes into account the correlation between ICP and ABP. Dotsrepresent observations, crosses represent missing observations (test observations), the dotted line shows the function mean andthe shaded area show the 95% confidence interval. We note that the timescale parameter “selected” by the MTGP, which takesinto account the correlation between the tasks, is shorter than the one selected by the STGP, which yields to higher likelihoodof the test observations (crosses).(Figure 2(b)), applied to each task independently, fails to adequately represent the functions, particularly where data arenot available. Figure 2(c) shows that the MTGP improvesthe predictions in all 4 tasks by capturing the relationshipsbetween them.The MTGP has several useful properties as compared tothe traditional GP: We can allow task-specific training indices nj ; i.e., training data may be observed at different times for differenttasks (Figure 2); The correlations within and between tasks are automatically learned from the data by fitting the covariance function in Equation 1; and The framework assumes that the tasks have similar temporal characteristics and hyperparameters θt .A limitation of the MTGP is computational cost:O(m3 n3 ) compared with m O(n3 ) for STGPs. This limitation is not as relevant for our application, given that weare not dealing with densely-sampled time-series data, butdata which is sparse and irregular. Another limitation of theMTGP is that the number of hyperparameters can increaserapidly for an increasing number of tasks, which can lead toa multi-modal parameter space.3.2Signal Representation via HyperparametersWe propose using the inferred MTGP hyperparameters θthat describe the temporal correlation within and betweentasks as features that represent our set of observations: θAand θL which respectively govern each output scale of ourfunctions and the input, or time, scale, and θc,i that correspond to the correlation between the different tasks (outputs)modelled. In effect, θ provides a new latent search space toexamine and evaluate the similarity of any two given multidimensional functions. Importantly, these parameters are:1. a means of representing the functional behavior a set ofobservations { yn , xn };2. learned directly from data; and3. generalizable to any type of longitudinal data, includingcategorical and numerical types.4Experiment 1: From Multiple NoisyTime-Series Data to Acuity AssessmentIn this experiment, we use physiological signals from Traumatic Brain Injury (TBI) patients to test the MTGP’s ability to assess and forecast multiple related signals. We examine two noisy timeseries: the intracranial pressure (ICP) andmean arterial blood pressure (ABP). Continuous monitoring of ICP and ABP has become a standard in neurologicalICUs. Cerebrovascular autoregulation is an important mechanism to sustain adequate cerebral blood flow (Werner andEngelhard 2007), and impairment of this mechanism indicates an increased risk to secondary brain damage and mortality (Hlatky, Valadka, and Robertson 2005).Cerebrovascular autoregulation is most commonly assessed based on the Pressure-Reactivity Index (PRx), whichis defined as a sliding window Pearson’s correlation betweenthe ICP and ABP (Czosnyka et al. 1997). However, the ICPand ABP timeseries are often contaminated by artifacts andmissing data, and PRx can no longer be calculated in thesesituations. Although methods have been proposed to detectand remove artifacts (Feng et al. 2011), the artifact removalprocess still creates gaps of missing data in the timeseries.In this experiment, we demonstrate how the proposedMTGP model can be applied to interpolate the incompletedata in ICP and ABP signals and, more importantly, to accurately estimate PRx.4.1DataThe ICP and ABP data were collected from 35 TBI patientswho were monitored for more than 24-hours in a Neuro-ICUof a tertiary care hospital between January 2009 and December 2010. The continuously monitored physiological readings were sampled and recorded every 10 seconds. For experimental evaluation, we selected 30 ten-minute windowsfrom each patient recording, where ICP and ABP signals
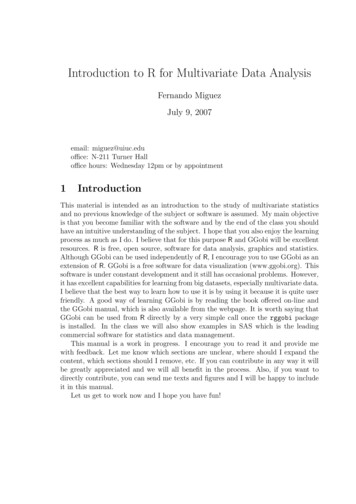
were free from artifacts and missing values. We then randomly introduced artificial gaps in both signals as shownin Figure 3. We evaluated the PRx estimation accuracy, andwe further compared the performance of MTGP to that ofSTGP, which models each signal independently. For implementation, priors over the hyperparameters were selected after 100 random initializations for each case.4.2ResultsThe quality of predictions are evaluated using the squarederror loss, where we compute the squared residual (y ŷ )2between the mean prediction (ŷ ) and the target (y ) at eachtest point, and the squared root of the average over the testset to produce the root mean squared error (RMSE). As theRMSE is sensitive to the overall scale of the target values,we additionally evaluate the negative log probability of thetarget under the model, by defining the mean standardizedlog loss (MSLL) aspMSLL(ŷ , y ) 1 X log p(ŷi f, x i )p i 1 log p(ŷi m(yn ), var(yn ), x i ,where the first term is the log likelihood of ŷi given ourlatent function f and the test index x i . This probability isnormalized by the second term, the log likelihood of ŷi under a trivial model that predicts using a Gaussian with meanm(yn ) and variance var(yn ) of the training ble 1: Performance of single-task GP (STGP) and multitask GP (MTGP). PRx-PRx* refers to the difference between the reference PRx (Pearson correlation coefficient ofICP and ABP for a given window) and PRx*, the estimatedPRx index (posterior MTGP hyperparameter that measuresthe interaction between the two tasks).Table 1 shows the overall performance of our approach.We note that the MTGP was able to estimate the correlationbetween the ICP and ABP signals – PRx – accurately evenwith incomplete data. The average RMSE between the truecorrelation coefficients and the MTGP estimated ones withthe incomplete data was 0.09 (Table 1). This suggests thatthe posterior hyperparameter of MTGP, which measures theinteractions between ICP and ABP, may be used as an indexto model the cerebrovascular autoregulation mechanism andthus the risk of secondary brain injury.We note that the scale of ICP values is normally between 1to 20 mmHg, and the specific ICP value determines whetherthe achieved reduction in RMSE is clinically significant. Ifthe ICP has already elevated to somewhere near 20 mmHg,any slight increase in ICP may result in secondary damageto the brain. In this case, even small reductions to RMSE aremore desirable to guide the medical interventions.We also observe that the MTGP provides a significant improvement in interpolating values for both signals, as thecorrelation between the two physiological variables is takeninto account. Particularly, in periods of incomplete data (seeFigure 3), the predictions are much more accurate comparedto STGP. This shows that the proposed MTGP model canalso be used for accurate interpolation and forecasting ofICP and ABP timeseries in the applications of advancedalarming and physiological trajectory analysis.5Experiment 2: From Heterogenous ClinicalData to ICU Acuity ForecastingTo demonstrate the effectiveness of the proposed MTGPmodel on features inferred from sparse, irregularly sampled timeseries, we applied MTGPs to clinical notes fromthe ICU for mortality prediction as summarized in Figure4. Gold-standard clinical models typically use populationbased acuity scores, such as SAPS-I (Le Gall et al. 1984),based on snapshots of the patient’s status during their stay inthe ICU. These scores are inherently limited because patientstate (or severity of illness) constantly evolves.5.1DataWe used 2001–2006 ICU data from the open-access MIMICII 2.6 database (Saeed et al. 2011), which includes electronicmedical records (EMRs) for 26, 870 ICU patients at the BethIsrael Deaconess Medical Center (BIDMC).For each patient we extracted the SAPS-I score, calculated from clinical variables over a patient’s first 24-hoursin the ICU. We used all notes from nursing, physicians,labs, and radiology recorded prior to the patient’s first discharge from ICU. Discharge summaries were excluded because they typically state the patient’s outcome explicitly.Patients were excluded if their notes had fewer than 100words, fewer than 6 total notes in their record, or were underthe age of 18. Patient mortality outcomes were measured athospital discharge and 1 year post-discharge.The final cohort consisted of 10,202 patients with 313,461notes. A random 30% of the patients (3,040) were held backas a test set. The remaining 70% of patients (7,162) wereused to train topic models and mortality predictors. The testset contained 93,411 notes, and the training set had 220,005.5.2Clinical Note Decomposition to TimeseriesBeginning from sparse, irregularly sampled clinical notes,we first performed topic modeling as a form of dimensionality reduction as described in (Ghassemi et al. 2014). Topicsinference was performed on notes using T 50 topics overthe words (W ) in our vocabulary (Blei, Ng, and Jordan 2003;Griffiths and Steyvers 2004). We normalized hyperparameters on the Dirichlet priors for the topic distributions (α) and200the topic-word distributions (β) as α 50T , and β W .The topic inference resulted in a 50-dimensional vector oftopic proportions for each note in every patient’s record. We
SurvivalIn-hospital Mortalityidentified topics (matrix q), and (3) the inferred MTGP hyperparameters across the nine topic vectors from q. Importantly, the admitting SAPS-I score and mean topic members (1 and 2) are both static measures. SAPS-I collapsesdata from the first 24 hours of the record, while the averagetopic membership collapses the entire per-note timeseriesfor each patient’s record into an aggregate measure. Our proposed MTGP hyperparameters (3) complement these measures with information about the per-note timeseries.Figure 4: 1) We perform a pre-projection step where clinicalnotes are transformed into timeseries using Latent Dirichlet Allocation; 2) the new set of topic proportion timeseriesare fitted using the MTGPs; 3) inferred hyperparametersθL , θA , θc,1 , . . . , θc,6 are derived, projecting into the new latent space; 4) latent features (hyperparameters) are used asfeatures in combination with topic proportions and the SAPSacuity score to 5) forecast patient mortality.concatenated topic vectors into a matrix q where the elementqnk was the proportion of topic k in the nth note.5.3Hyperparameter ConstructionOnce notes were transformed into multi-dimensional numeric vectors, we used the MTGPs to model the per-notechange in topic membership over a patient’s stay. This iscritical for comparing two patients’ records given that patients have different lengths of stay and note taking intervalsdepend on staff, clinical condition, and other factors.From the topic enrichment measure (φ), we chose the topics with a posterior likelihood above or below 5% of the population baseline likelihood across topics. This yielded ninetopics (see Table 5.3 for a summary of the chosen topics,and the Appendix for more details). We employed MTGP tolearn the temporal correlation between the nine topics andthe overall temporal variability of the multiple timeseries.From the available data sources, we formed a set of threefeature matrices: (1) the admitting SAPS-I score for every patient, (2) the average topic membership for the nineTop Five Wordsliver, renal, hepatic, ascites,dialysisthick, secretions, vent, trach,respremains, family, gtt, line,mapincreased, temp, hr, pt, ccintubated, vent, ett, secretions, propofolname, family, neuro, care,notedcabg, pain, ct, artery, coronarychest, pneumothorax, tube,reason, clippain, co, denies, oriented,neuroPossible TopicRenal FailureRespiratory infectionSystematic organfailureMultiple physiological changesRespiratory failureDiscussion of endof-life careCardio-vascularsurgeryResponsive patientTable 2: Top five words in chosen topics (enriched for inhospital mortality/survival).5.4Outcome ClassificationWe considered five feature prediction regimes that combinedsubsets of the feature matrices 1, 2, and 3 as an aggregatefeature matrix. We trained two supervised classifiers thatwere identical in the five feature sets used, but provided different objective functions for optimization: Lasso logistic regression and L2 linear kernel SVM.Classifiers were trained to create classification boundaries for two clinical outcomes: in-hospital mortality and 1year post-discharge mortality. All outcomes had large classimbalance (e.g., in-hospital mortality rates of 10.9%). Toaddress this issue, we randomly sub-sampled the negativeclass in the training set to produce a minimum 70%/30%ratio between the negative and positive classes. Test set distributions were not modified, and reported performance reflects those distributions. Due to space constraints, we onlyreported results on a completely held out test set. We performed 5-fold cross-validation on the remaining data, andcross-validation results were similar to those obtained on thecompletely held-out test set.We evaluated the performance of all classifiers usingthe area under the Receiver Operating Characteristic curve(AUC) on the held-out test set. Table 3 reports results fromthe Lasso model. Results obtained using the L2 linear kernelSVM were not statistically different.
FeaturesSAPS-IAve. TopicsSAPS-I MTGPAve. Topics MTGPSAPS-I Ave. Topics arMortality0.5000.6530.6240.6730.686Table 3: Prediction results of hospital and 1-year mortality,AUC for various feature combinations.5.5ResultsSAPS-I had the poorest predictive power, which is understandable given that it is only an initial snapshot (24hours) of the severity of illness. We used the static SAPSI score due to its status as the gold-standard in clinicalscoring, and our argument in the second experiment is thatthe MTGP hyper-parameter space complements this clinicalscore, rather than competes with it. The average value of themost significant topics significantly improved upon that predictive power. The performance of MTGP Hyperparameterson their own was similar to that of the Topics: AUC of 0.749and 0.624 for in-hospital and 1 year mortality, respectively.Given that the hyperparameters were optimized from pernote topic features (that are themselves the output of anunstructured learning problem), it is most sensible that thetopics information should be used in combination with theMTGP hyperparameters to describe patient state. We obtained improved predictive performance for both mortality outcomes when combining both MTGP hyperparameterswith SAPS-I and the significant topics. This is likely because the hyperparameters provide complementary information to both SAPS-I and the significant topics. Both SAPS-Iand the topic features capture a single aggregate measureof membership in certain latent dimensions related to outcome, while the MTGP hyperparameters capture movementover the course of a hospital stay within those dimensions.The best predictive performance occurred when all featureswere combined, e.g. SAPS-I significant topics MTGPhyperparameters.6ConclusionThe ability to determine on-going patient acuity has immediate clinical use. But clinical data are often noisy, sparseand irregularly sampled. The secondary nature of medicaldata is also true in other domains of application such as social media, online retailers, and online content distributors(e.g., Yelp reviews, Twitter tweets, Ama
tent variable models have been applied to abstracting sig-nals into higher level representations. For example, Fox et al. used beta processes to model multiple related time-series (Fox et al. 2011), and Marlin et al. used Gaussian mix-ture models on the first 24 hours of monitor-signals data with hourly-discretization (Marlin et al. 2012).