Transcription
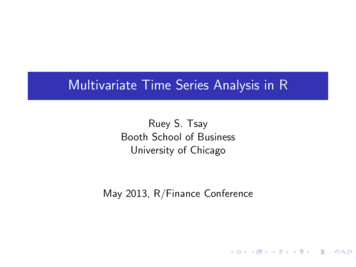
A new paradigm in P&C Industry PricingThe New Paradigm of Property & Casualty Insurance Pricing:Multivariate analysis and Predictive ModelingThe ability to effectively price personal lines insurance policies – to accurately match rate withrisk - is arguably the most important competency required of Canadian Property and Casualtyinsurers. Pricing each risk with surgical precision can provide substantial competitiveadvantage and long term profitability. Over the past decade, a number of insurers haveemerged as leaders in pricing sophistication – Progressive and GEICO in the U.S., Intact inCanada, and many EU insurers. Due in part to advances in computing power, but more so dueto highly competitive market forces that drive innovation, these companies have complementedconventional actuarial methods with data mining and analytical techniques to produce morestable and accurate rating structures.These techniques, commonly referred to as “multivariate analysis” (MVA), are now beingadopted by more and more Canadian insurers and are on the verge becoming part of everydaybusiness practices. As Canadian insurers employing these techniques become moresophisticated in their use and application, the performance divide between these innovators andtheir competitors will grow.Current P&C Industry PricingCompany Actuaries create rating structures that generate a premium for each risk in a givenportfolio. For personal auto insurance this process usually includes: Analyses of various policyholder type characteristics and their impact on claim risk (i.e.claim frequency and severity), Industry reports and tables that reflect the most recent industry trends regarding claimrisk; and Corporate financial objectives and competitive market factors,Strong analytical and statistical skills are required, as is knowledge of the regulatoryenvironments – two factors that at times may be at odds with each other in a very competitiveenvironment.The conventional approach to rate setting employed by most insurers today dates back to the1960’s when data processing capabilities were limited. Rating analyses are conducted on aunivariate basis; in other words, they look at how changes in one characteristic result indifferences in loss frequency or severity. Loss frequency and severity measures are determinedfor commonly-used characteristics like “Claim history” (it’s been well established that the longerit has been since a vehicle incurred a loss, the less likely they are to incur one in the future) and“Vehicle use” (a vehicle driven for personal use is less likely to incur a loss than a vehicle usedfor business; presumably because the vehicle is simply on the road less).Most industry practitioners use the Driving Record variable to establish “base” rates for eachvehicle. Generally, Driving Record categories range from 01 to 06 (usually up to “06” or sixyears claims free; but with better and more reliable data capture some companies haveintroduced 10, 15 and 20 year driving record groups), and every risk starts off with the same“base rate” set for the driving record group within which they fall. Then another rating variable,let’s say Driving Class, is applied. To determine how the base rate for each Driving Recordgroup will change with the application of the next rating factor, a differential is applied. Thedifferential value is a measure of the difference in observed (actual) claim losses for eachdifferent Driving Class compared to the overall average. I’ve tried to simplify the process In the1
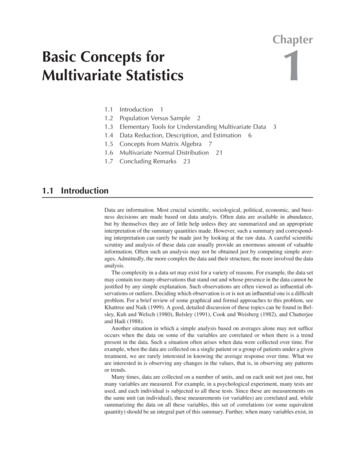
A new paradigm in P&C Industry Pricingfollowing example for Collision coverage. You can see how the premium charged for thevehicle changes as the different rating characteristics are combined:See Table 1 below for example:Table 1In this simplified example, there are only two Driving Class groups – 01 (Personal use only) and02 (Business use only). As each rating variable is added (e.g. Years Licensed, FSA location,Vehicle Rate Group, etc.) differentials for the variable are used to repeatedly adjust the vehiclepremium to reflect the risk represented by the values of each rating characteristic or factor usedby the insurer to determine the premium for the risk. Each risk in a portfolio falls into a smallgroup/profile that best reflects the losses anticipated by that profile.It is the use of these cross tab type reports that determine the variation of premium betweenpolicy holders. As more factors or variables are introduced into the cross tab reports, weobserve more groups and a lesser number of policyholders within each group. In effect, theinformation becomes more granular resulting in many different possible premium values acrossthe policyholder base. This increase in the number of risk groups or categories results inincreased granularity, greater discrimination between risks and more accurate pricing.Ultimately however the number of different possible premium levels will be restricted by thenumber of groups that are included in the analysis.Multivariate Analysis and Predictive ModelingMultivariate analytical techniques made possible by advances in computing, take a differentapproach to predicting risk by focusing on individual level data, so the estimate of risk is more granular and,2
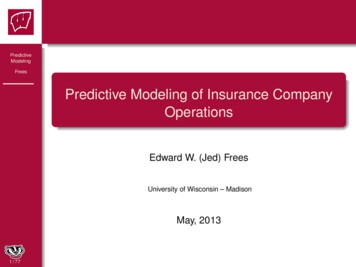
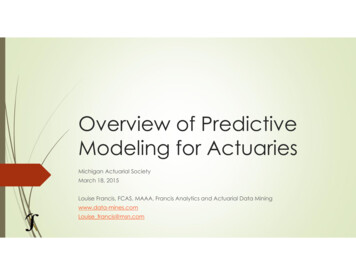
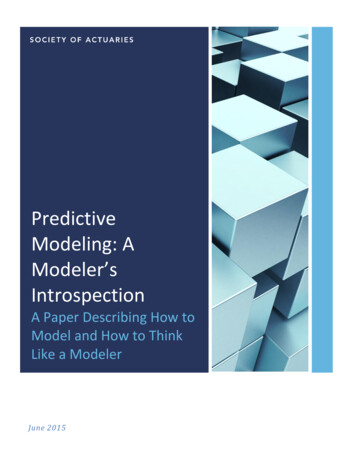
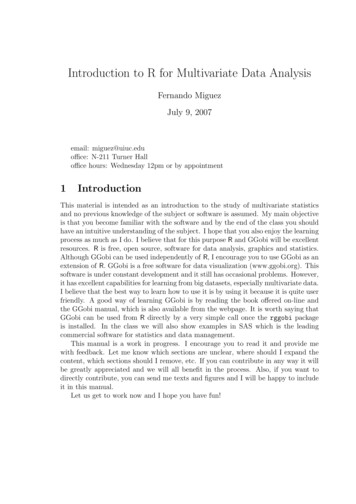
A new paradigm in P&C Industry Pricing taking into account the effects (interactions) that many different characteristics(variables) of a risk have on one another (thus the term “multivariate” approach vs the“univariate” approach typically employed by most insurers today)These techniques have been mastered by data miners across academic (e.g. scientificresearch) and business (e.g. marketing and risk management) environments as way to predictbehaviour. Many companies use Predictive Modeling (a form of multivariate analysis) to createmeasures of the likelihood that a customer will purchase a particular product (e.g. magazinesubscriptions); Banks use these tools to create measures (e.g. credit scores) of whether a clientwill be able to meet lending obligations for a loan or mortgage.Similarly, P&C insurers can use predictive models to predict claim behavior. Essentially,predictive models identify the characteristics that best predict risk; produce a scoring equation that can be maintained and updated; calculate a score that represents the expected losses for each risk in the portfolio;Chart 1Highest RiskExpectedLossesLowest RiskThe Scoring model or mathematical equation is comprised of the fewest number ofcharacteristics (variables) possible (usually 10 to 15), each of which are responsible for adiscrete “amount” of the expected loss behavior that when added together account for 100% ofthe expected losses for the risk.A simple way of looking at this approach is to consider each characteristic in a model equationlike a different piece of a pie where the pie represents the total “expected loss” amount. InChart 2 below the pieces (characteristics of a auto insurance risk identified by the model) fittogether to form a whole, perfectly shaped pie; in other words, the set of variables in theequation are the optimal combination that provides the most accurate measure of the expectedlosses. Whereas it may appear that by adding more information (ie. another piece to the pie)one could generate an even more accurate assessment of the risk, the statistical processesaccount for the relationships between different characteristics such that the addition of another3
A new paradigm in P&C Industry Pricingcharacteristic to the pie would only distort its shape, and not add any additional value inaccurately measuring risk.Chart 2It is our experience that multivariate or predictive modeling techniques provide even moregranularity and better understanding of the differences between individual risks thanconventional approaches used by most insurers today. This is achieved as risk measuresproduced by predictive modeling outcomes are produced for each individual risk rather than bygroup differentials. In essence, the techniques enable more accurate matching of rate with risk.Those relatively few insurers in Canada employing these methods are able to acquire businessby offering lower rates for risks that the general market is overpricing, and have higher prices toavoid taking on risks that the general market is underpricing. The overall benefits of this resultinclude: Better risk selection and pricing Reduced underwriting expenses Improved underwriting results4
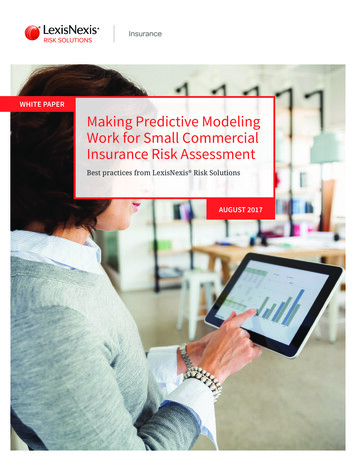
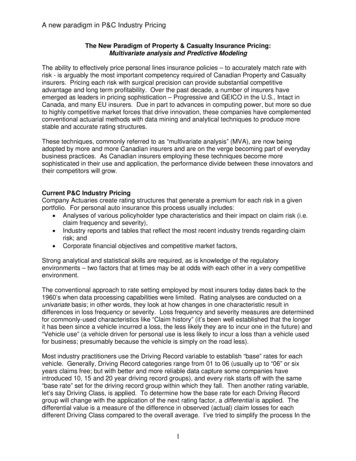
A new paradigm in P&C Industry PricingResults from Case StudiesWhether the application of multivariate analytical techniques can improve upon the ratingaccuracy is ultimately determined by how much better these measures predict losses comparedto the premium assigned to a risk (vehicle or property) using conventional rate-setting paradigm.Presented below is an example of actual observed results for a portfolio of homeowner’spolicies: A “Homeowners” Claims Risk Scoring model was produced for a Canadian insurer Each policy in the portfolio was scored at its effective date. The score represented theexpected losses on the policy in the policy year. Each policy was ranked from highest risk (score) to lowest risk (score).Chart 2 – Homeowners Property Insurance ModelHighest ScoresLowest Scores The Line Chart depicts the percentage of actual losses on policies in the portfolio thatoccurred after the policy effective dateo Based on the model’s prediction of losses, policies with the highest 20% ofscores generated 46% of total losses while those policies in the lowest 20% ofscores accounted for only 6.8% of losseso Based on the premium charged for each policy, the policies with the highest 20%of premium produced 32% of all losses and those policies with the lowest 20% ofpremium produced 15.2% of losses The shaded area represents the “lift” or increased accuracy in loss prediction producedby the model over the insurer’s current rating structure, essentially representing lossesnot accounted for by existing rates.Conclusion5
A new paradigm in P&C Industry PricingThe application of data mining tools and multivariate modeling techniques can substantiallyimprove current rating structures for Property and Casualty insurers. Because of this capabilitymultivariate modeling techniques are gaining traction and becoming an industry standard. Theprimary challenge is to effectively action these tools; Insurers must become more familiar withthese techniques and adopt them as a daily part of doing business. “Data Miner’s” familiar withthese tools can provide critical assistance to company Actuaries in this regard.This incremental level of accuracy in predicting losses enables insurers to price policies moreaccurately than competitors, improve portfolio profitability and provide substantial long termcompetitive advantage.6
behaviour. Many companies use Predictive Modeling (a form of multivariate analysis) to create measures of the likelihood that a customer will purchase a particular product (e.g. magazine subscriptions); Banks use these tools to create measures (e.g. credit scores) of whether a client will be