Transcription
Failure and Reliability Analysis of a SiC PowerModule Based on Stress Comparison to a SiDeviceBorong Hu, Jose Ortiz Gonzalez, Li Ran, Hai Ren, Zheng Zeng, Wei Lai, Bing Gao, OlayiwolaAlatise, Hua Lu, Christopher Bailey, Phil Mawby Abstract—The superior electro-thermal properties of SiCpower devices permit higher temperature of operation and enablehigher power density compared with silicon devices. Nevertheless,the reliability of SiC power modules has been identified as a majorarea of uncertainty in applications which require high reliability.Traditional power module packaging methods developed forsilicon chips have been adopted for SiC and the differentthermomechanical properties cause different fatigue stresses onthe solder layer of the chip. In this paper a 2-D Finite Element (FE)model has been developed to evaluate the stress performance andlifetime of the solder layer for Si devices, which has been validatedusing accelerated power cycling tests on Si IGBTs. The proposedmodel was extrapolated for SiC devices of the same voltage andcurrent rating using the same solder material and the results showthat under the same cyclic power loss profile the induced stressand strain energy in the die attach layer is much higher andconcentrates on the die/solder interfacial area for SiC chips. Usingthe validated stress-based model, the lifetime can be quantifiedwhen SiC chips are used. This ability to extrapolate the availablepower cycling and lifetime data of silicon chips to silicon carbidechips would be a key element for developing reliable packagingmethods for SiC devices.Index Terms— Stress comparison, silicon carbide, failureanalysis, power cycling, life predictionI. INTRODUCTIONTHE superior properties of silicon carbide (SiC) powerdevices, including higher blocking voltage, lowerswitching and conduction losses, and high-temperatureoperation ability, with respect to silicon devices [1] arefundamental assets of the wide bandgap technology. SiC powerdevices are now widely and commercially available, afteraddressing different issues related to the manufacturingprocess: gate dielectric instability, large leakage current due towafer defects [2,3] and poor long-term chip tolerance at hightemperatures [4,5]. Considerable progress has been made toThis work was supported by The National Key R&D Program of China(2017YFB0102303), National Natural Science Foundation of China(51607016), graduate scientific research and innovation foundation ofChongqing (CYB17008) and the UK EPSRC under Grant EP/K036327/1 andthrough the Underpinning Power Electronics Components Theme under GrantEP/K034804/1.B. Hu, L. Ran, H. Ren, Z. Zeng, W. Lai and B. Gao are with the State KeyLaboratory of Power Transmission Equipment & System Security and Newovercome these issues: Gate oxide reliability can now beimproved by e.g. annealing in nitric oxide (NO) after oxidationto reduce oxide layer traps and ensure high effective barrierheight at high temperatures. Step-controlled epitaxial growthand new trench structure can reduce the effect of materialdefects, thus the performance of the devices can be alsoimproved [6, 7].Despite of the aforementioned improvements on thefabrication of the devices, there are still concerns about theperformance of the packaging system used for SiC devices. Dueto direct contact of materials with different coefficients ofthermal expansion (CTE), the elements of the packaging aresubjected to thermomechanical stresses, caused by the variationof temperature during normal operation of the devices. Thethermomechanical stresses will cause degradation of the weakerelements of the packaging system, leading to device failure [8].Given that traditional packaging methods were developedand tested for silicon chips, the reliability of the packagingsystems for SiC devices has appeared as a major concernbecause of the different thermomechanical properties of SiCcompared to silicon. Although the CTE of SiC is closer to thatof copper or aluminum, the higher thermal conductivity andYoung’s modulus of SiC may cause higher stresses on the dieattach solder layer during power cycling [9]. In someapplications, SiC devices may be used at higher temperatureswhile suffering higher temperature cycling [10, 11]. Despite theaforementioned superior electrical properties, the limitedreliability of SiC power devices hinders their application in theareas like more electric aircrafts and DC grids, where a veryhigh reliability is required.Standard power cycling tests are used to evaluate theperformance of a packaging system [2]. Power cycling can beclassified as fast and slow cycling, depending on the durationof the temperature cycles. Fast power cycling is mainlyconducted to estimate the reliability of the die-attach solderlayer [12], while the slow cycling is carried out to produceTechnology, School of Electrical Engineering, Chongqing University,Chongqing 400044, China.J. O. Gonzalez, O. Alatise and P. Mawby are with the School of Engineering,University of Warwick, Coventry CV4 7AL, U.K. L. Ran is also with theSchool of Engineering, University of Warwick, Coventry CV4 7AL, U.K.H. Lu and C. Bailey are with School of Computing and MathematicalSciences, University of Greenwich, London SE10 9LS, U.K.
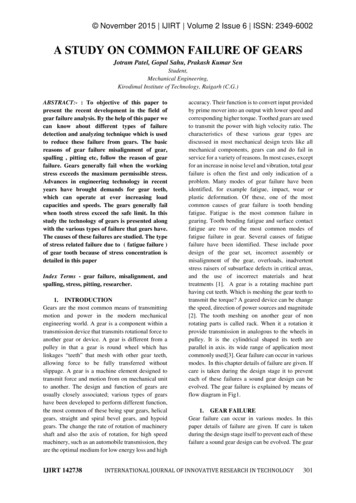
fatigue on the baseplate solder layer. In this study, the mainconcern of reliability is the die-attach solder layer so fast powercycling has been selected. Using this power cycling strategy,the die-attach solder layer undergoes frequent temperaturecycling with sizable value of temperature fluctuation [13]. Ageddie-attach solder layer impedes the heat extraction from thechip, hence increasing the thermal impedance and junctiontemperature. Generally, the die-attach solder layer will degradeearlier than other failure mechanism appearing during powercycling - bond wire lift-off [14], but it is not the subject of studyin this paper.Solder fatigue is caused by the plastic strain and creep duringcycling [15-17]. While the SiC chip is suitable to operate at hightemperatures, it can cause significant thermal stress on thesolder layer leading to substantial fatigue [17-19]. Experimentalresults from different samples reveal that the shear stress in aSiC die-attach is higher than that in a Si device [20], and strainenergy density tends to concentrate at the chip edge where thedifference is 1.5 times between the SiC and Si devices undercomparable conditions [9]. It is considered that the in-servicelifetime of SiC solder layer is only a third of the benchmark Sidevice. In [21], cracks and voids are observed on the solderedges of the Si IGBTs and SiC diodes after power cycling.Due to the low reliability of SiC die-attach in package,double-side cooling and direct liquid cooling are suggested toenhance the capability of heat dissipating and reduce thethermal stress [22, 23]. New solder materials, such asSnAg3Cu0.5, AuGe12, ZnAl5Ge0.1 and nano-silver sintering,could also provide higher reliability than the usual SnPb5[17,20,24-26]. However, it is necessary to further investigateand understand the effect of the material properties of SiC itselfon the thermomechanical stresses. Previous research onlyconsidered the static stress under certain load conditions, butthe lifetime characteristic of the SiC device under dynamic andrealistic operating conditions is yet to be investigated.This paper analyzes the fatigue stress caused by the CTEmismatch between the chip and solder layer during powercycling, which causes creep strain accumulation in the solderlayer when the device is operated at elevated temperature for asustained period of time. Power cycling test is a time consumingtask, even with accelerated test conditions; and the timerequired to obtain meaningful data is a major drawback. In thecase of SiC chips, given the higher price of the devicescompared with their silicon counterparts, it is a more expensiveexercise. However, as the lifetime of the solder is dependent ofthe creep strain, using the resultant creep strain obtained whena SiC chip is used, an estimation of the lifetime can be obtained.This study attempts to extrapolate the lifetime test results fromSi devices to SiC with the same solder material. This requires aphysics-of failure lifetime model which can be validated usingexperimental power cycling results on silicon devices.The paper is organized as follows. In section II, the 2-DFinite Element (FE) model used to analyze the fatigue of thedie-attach for a silicon chip is defined and validated usingexperimental power cycling results of Si IGBTs. The thermalmechanical properties and dimensions of a SiC chip arecompared with the Si devices in section III. Using a lifetimemodel for the solder, based on creep energy, the extrapolationof the lifetime of the die-attach solder under power cycling testswhen SiC chips are used is then presented in section IV, wherethe fatigue performance of the die-attach is compared in termsof thermal stress, creep strain and creep energy density for Siand SiC chips. Section V concludes the paper.II. FINITE ELEMENT MODELING AND ACCELERATED LIFETIMETEST FOR SI DEVICESPower cycling test is an effective and feasible tool widelyused to evaluate the lifetime of power modules and devices. Incase of Si power modules, there are large amounts of availablelifetime data extracted from power cycling tests based onmatured techniques both in cycling strategy and junctiontemperature monitoring. In the case of SiC power modules,considering the large quantity of samples required to obtainenough data to ensure the accurate prediction of lifetime, itwould be more expensive due to the difference in price betweensilicon and silicon carbide power modules.The different thermomechanical properties of Si and SiCchips have been suggested as the cause of the different powercycling capabilities of their modules. The failure process ofsolder layer is only related to the stress performance of soldermaterial and considering that the standard commerciallyavailable Si and SiC power modules have the similar packagingmaterials, it would be possible to establish a stress comparisonbetween Si and SiC devices to estimate the lifetime of SiC dieattach solder layer.Given the time consumed by the power cycling tests, it wouldbe beneficial that the power cycling capability of SiC devicescould be obtained as soon as possible, especially from the pointof view of the packaging design. Well-known physical lifetimemodels for the solder die-attach are based on fatigue stress andstrain. Due to the difficulty of measuring the stress or strain inthe solder layers directly, Finite Element (FE) model is adoptedto evaluate the stress [27].A. Finite Element ModelingThe test vehicle proposed for the evaluation of the stresseson the solder consists of an Al2O3 Direct Bonded Copper (DBC)[28] substrate of dimensions 11 mm by 11 mm with thicknessesof 300 μm/ 630 μm/ 300 μm for the Cu/ Al2O3/Cu layers, wherethe die is attached to the substrate using a layer of SnAg3Cu0.5(SAC305) solder with a thickness of 120 μm. The selected chipis a 1200 V/50 A silicon IGBT, with datasheet referenceSIGC41T120R3E. A 3D view and a cross-section of the testvehicle are shown in Fig. 1.The dimensions and materials of chip, die-attach solder layerand DBC layer selected for FE model are the same as the IGBTmodule selected for the later experimental accelerated tests. Thedimensions of the chips are presented in Table I, where theprincipal thermomechanical properties are also identified,together with the dimensions and thermomechanical propertiesof the die-attach solder and DBC substrate.All materials, except the solder are considered to have elasticproperties. The solder layer is modeled using the Anand’svisco-plastic material model. This model is widely used for the
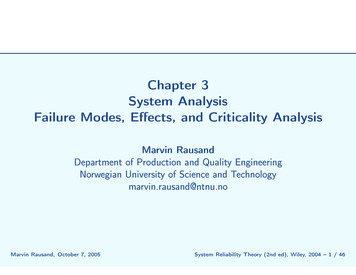
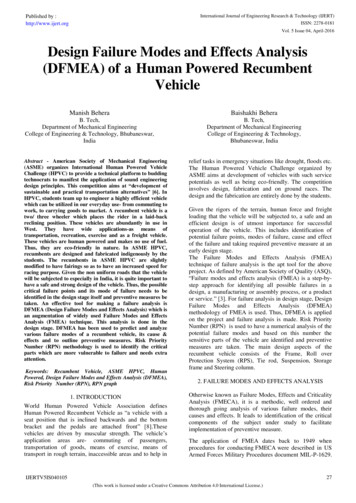
evaluation of the stresses on the solder layer involving strainand temperature effect, assuming that plastic flow occurs at allnonzero stress value. This model accounts for the physicalphenomenon of strain-rate, strain hardening or softeningcharacteristics, crystalline texture and its evolution, and it doesnot require an explicit yield condition [29].the 3D model presented can be simplified to a 2-D model, as itis shown in Fig. 1. The 2D sections were obtained by cuttingfrom the symmetric centerline plane along the direction of thelonger side of the chip. The calculation method of 2D modelingin COMSOL is an approximation that the 2D model has athickness in depth as a “cube”. The 2D section then should beselected in symmetric centerline, which will be more realisticin the dimensions of the test vehicles when it is assumed as a“cube” in FE calculation, rather than in diagonal. Thethermomechanical performance is also symmetrical in the 2Dsymmetry section of the cutting plane obtained for modeling.This simplification has been verified more than 90% accuracyas compared with a 3D model when used for calculation ofstrain energy in FE model, and can be representative of a 3Dfatigue analysis of the solder layer [30]. The 2D symmetric FEmodel in COMSOL Multiphysics software built for this studyis presented in Fig. 2.Fig. 1. The test vehicle for SiTABLE ISI DEVICE AND PACKAGING MATERIAL PARAMETERSParametersArea(mm x oisson’sRatio (1)ThermalConductivity(W/(m x K))ThermalCapacity(J/(kg x K))Si ChipCopperAl2O3SAC3056.5 x 6.810 x 1011 x 11As 1304003550700385730150The material properties of the solder layer for the Anand’smodel are shown in Table II, where s0 is the initial deformationresistance, Q/R the ratio of activation energy to Boltzmann’sconstant, A pre-exponential factor, the stress multiplier, m0 andŋ the strain rate sensitivity of stress and strain rate sensitivity ofthe saturation value, h0 the hardening/softening constant, s thecoefficient for the saturation value of deformation resistanceand a the strain rate sensitivity of the hardening/softening.TABLE IIANAND’S PARAMETERS DEFINITIONParameterss0(MPa)Q/R(K)A(s-1) (MPa) aSolder1378.9513.790.071.3The centers of each layer of the material are coincident andFig. 2. 2D symmetry FE modeling and defined boundary conditionsThe higher stresses are concentrated on the edges of thedie/solder interface [31], hence a finer mesh is utilized for thisarea, in order to evaluate in more detail and with higherprecision the thermal stress and strain. The fixed number ofmesh elements distributed on the die/ solder interface is 60elements for Si model, and the mesh number distributed on thesolder edge is fixed as 10 elements. The boundary conditions ofFE modeling are set as follows: the whole chip is the powersource of heat defined by general source distributed in the chipvolume homogenously; the bottom of DBC is the roller fixed(the normal displacement is fixed); convective heat flux isdefined to emulate the heat dissipation of forced water-cooling(plate length is 0.5 m and fluid velocity is 3 m/s) on the bottomcopper surface of DBC ; the left-hand side edge of the model(as shown in Fig. 2) is the symmetrical boundary; the rest of theopen surfaces are set as free-to-move without constraints andthey are also set as thermal insulation to reduce the interferencefactors.A detail of the area of interest is shown in Fig. 3. The stress,strain and lifetime distribution on solder layer will be evaluatedlater for this area, confined by four points: Point A is at thecorner of the top surface on the solder layer, point B is at thecorner of bottom surface, and points C and D are on the bottomand top interface respectively. The distance from point C (D) topoint B (A) is 0.2mm, and the distance from A (D) to B (C) is
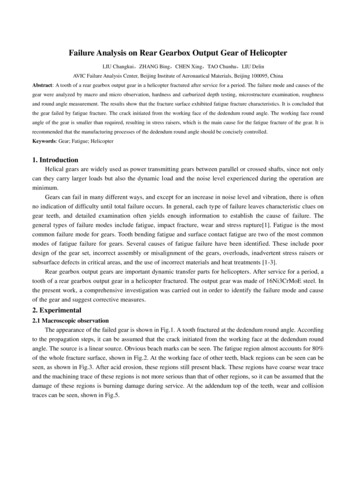
the thickness of the solder layer.In this FE model coupled physics between heat transfer andsolid mechanics are used. When the heat source is consideredfor the thermal analysis, the differential equation for thetemperature calculation of the element in each layer is given by[32] k T Qv c T t(1)where k is the thermal conductivity, T the temperature, Qv theheat source per unit volume, the density and c the specificheat.Fig. 3. Finer mesh on the edge area of die-attach solder layerConsidering the particular properties of semiconductor chip,the mechanical behavior of chip/die-attach system on the 2-Dsection will be analyzed in detail here. With the simulatedtemperature T, the CTE mismatch between the materials on theinterface would lead to unequal thermal expansion strain amongthese materials. As the material layers are bonded in rigidconnection, they will remain at the same length when thetemperature changes causing a tendency of deformation.Assuming that the length of chip and solder both are L0 initiallyand LT is the length at a defined temperature T, equation (2) canbe used for calculating the constrained strain of each layer [33].L L0(2) T Tref TL0where is the constrained strain of the layer of interest, theCTE of the material and Tref the reference temperature. Theresidual stress/strain from the manufacturing process isassumed to be zero at ambient temperature 20 ⁰C, so that Tref isset at 293.15 K in the thermo-mechanical analysis module inCOMSOL software. The first term of equation (2) is theunconstrained strain while the second term refers to the actualstrain at the changed temperature T. The constrained strain willinduce thermal stress in each material. For example, when thechip temperature increases, the chip with a lower CTE than thesolder constrains the thermal expansion of the solder interface,thus the solder will be under compression and chip will be undertension.The stress of the concerned layer due to the constraint of CTEmismatch is given by equation (3), where E is the Young’smodulus [34] of the material. E (3)According to Newton’s third law, the stress of the chip andsolder would be equal, hence using equation (2) the stress in thesolder can be obtained as solder Esolder T1 Esolder Echip(4)where solder is the solder stress, Esolder and Echip are Young’sModulus of the solder and chip respectively, stands for thevalue of CTE mismatch between solder and chip, and T is thetemperature swing from the reference Tref.The impact of the material properties on the stress on thesolder is determined by the Young’s modulus of the materialand the CTE mismatch, as shown in equation (4), hence theimpact of the semiconductor material on the stress on the solder.In the case of SiC, the Young’s modulus and thermalconductivity are all approximately 3 times higher and theirinfluences on the temperature, stress and lifetime will beevaluated in section III and IV.The creep energy accumulated in one cycle will be used asthe fatigue indicator to estimate the solder layer lifetime.Morrow model [35, 36] proposed an exponential relationbetween the fatigue life and the cyclic plastic strain energy andhas later been modified to estimate the lifetime of solder layerdepending on creep strain energy. Given the accumulatedenergy for one cycle, the number of cycles to failure can beobtained from: Wc W f 2 N f m(5)where Nf is the number of cycles to failure, Wc the creepenergy accumulated in one cycle which can be obtained fromsimulation, Wf the fatigue energy coefficient of the soldermaterial and m the fatigue energy index. For solderSnAg3Cu0.5 used in this study, the values of Wf and m are givenin Table III.TABLE IIIMORROW MODEL PARAMETERS FOR SNAG3CU0.5 SOLDERParametersSolderWf (J/m3)55x106m-0.69B. Power cycling tests for Si devicesIn [12] power cycling tests were performed on silicon IGBTpower modules and the lifetime of the solder for differentjunction temperature excursions and mean temperatures wasobtained. The experimental setup is shown in Fig. 4 in which itis possible to test 22 IGBT devices simultaneously. The IGBTdevices are permanently turned on and the heating current iscontrolled by an auxiliary switch to heat up the devices. Whenthe heating current is switched off, the devices enter the coolingphase, where the thermal resistance, used as an indicator ofdegradation of the solder layer, is measured in each cycle bysensing the junction temperature, case temperature and powerlosses. The junction temperature is measured using the forwardvoltage at low currents (Isense 100 mA) as a TemperatureSensitive Electrical Parameter (TSEP) [37] after the maincontrol switch is switched off.In the experimental accelerated tests the single-chip IGBTmodules of model SKM50GB123D (rating voltage/current:1200V/50A) with the solder material SnAg3Cu0.5 were tested
under two groups of power cycling conditions: 1) 9 deviceswere set at an average junction temperature Tj,mean 90 C andjunction temperature variation Tj 90 C, and 2) 17 deviceswere set at a Tj,mean 90 C and a junction temperature variation Tj 120 C. The thermal resistance of an IGBT module ismonitored during power cycling test as shown in Fig. 5, with anincrease of 20 % of the nominal value considered an indicatorof failure.Fig. 4. Power cycling aging test circuitin solder layer in the FE model [38]. Although the divergenceof thermomechanical performance among these DUTs is alsoinevitable considering the semiconductor fabrication andpackaging process, the statistical results extracted from the testscould still demonstrate an evident trend of lifetimes Si modulearound Tj,mean 90 C as shown in Fig. 6.TABLE IVPOWER CYCLING RESULTS OF ALL POWER MODULES UNDER TESTNo. Tj( C)Tj,mean( C)Cyclestofailure( 96.106248No.ΔTj( C)Tj,mean1Fig. 5. The normalized thermal resistance of an IGBT module during powercycling testThe lifetime results and temperature profiles for the 17 IGBTmodules subjected to power cycling are summarized in TableIV. It should be mentioned that the differences of electrical andthermal characteristics caused by fabrication andmanufacturing process among these devices under test (DUTs)are inevitable. When the DUTs connected in series in the testplatform, the single current will cause varying power losses oneach device during power cycling test. As all the DUTs are allmounted on one water-cooling heatsink, the device mountednear the input of cooling water has a better heat dissipationperformance as compared with the one at rear position of theheatsink. These will cause minor errors of Tj,mean swing a fewdegree Celsius from 90 C as shown in Table IV, while thissmall swing only has limited influence on failure processaccording to Coffin-Manson model.The lifetime criterion of accelerated aging experiment is 20%thermal resistance increase corresponding to 23% crack lengthFig. 6. The lifetime results of Si modules in power cycling testsThe model presented in the previous section will be validatedusing these experimental results, hence the same temperatureprofile as in the accelerated tests has been selected. The valueof the mean junction temperature has been defined asTj,mean 90 C, with temperature excursions Tj of 90, 100, 110,120, 130 and 140 C. For these simulations, the junctiontemperature is defined as the temperature at the left-side cornerof the top surface of the chip in the 2-D symmetry model asshown in Fig. 2.The experimental results closely distributed around theresults from FE simulation with a goodness-of-fit higher than97% as shown in Fig. 7, which infers that the these results areable to validate the FE model under Tj,mean 90 C.According to the results presented in Fig. 7, the FE modelgives a good estimation and can show a clear trend of the
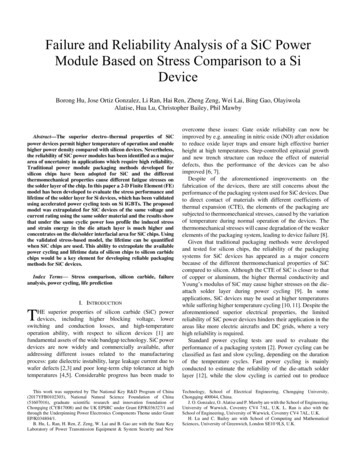
lifetime of the solder under power cycling condition when a Sichip is used. The result of Morrow’s model is only based on thethermomechanical behavior of the solder material, hence if thecreep energy on the solder is calculated when a SiC chip is usedthe lifetime of the same solder material can be estimated. As thedifferent properties of SiC seem to contribute the higher fatiguein its die-attach solder layer, it is necessary to understand theimpact of the chip material on the temperature distribution andstresses on the solder during power cycling before extrapolatingthe lifetime of SiC.inferred that the solder stress when a SiC chip is used will behigher.TABLE VSIC & SI CHIP MATERIAL PARAMETERSParametersArea(mm x mm)Thickness (μm)CTE(10-6/K)Young’s Modulus (GPa)Poisson’s Ratio (1)Thermal Conductivity (W/(m x K))Thermal Capacity (J/(kg x K))Si ChipSiC chip6.5 x 6.83.1 x 3.3614018033.41620.281307005010.45370690Fig. 7. The lifetime results of Si modules in Tj,mean 90 C power cycling testsand simulationIII. FINITE ELEMENT MODELING OF SIC DEVICE ANDTEMPERATURE PROFILE OF POWER CYCLINGThe FE modeling method for lifetime evaluation of the solderlayer was validated using accelerated lifetime tests using SiIGBTs. The model is based on the creep energy on the solder,hence if the same solder material is used for both Si and SiCchip, the lifetime of the solder as a function of the chip materialcan be investigated. However, it is first necessary to understandand evaluate how the change of the chip material affects thestresses on the solder.The test vehicle used for the study of the impact of thesemiconductor material on the stresses in the solder is the samethat was used in section II, just replacing the semiconductorchip, SiC in this case. A 1200 V/50 A SiC MOSFET withdatasheet reference of CPM2-1200-0080B, with the samecurrent and voltage rating as for the silicon IGBT evaluated inthe previous section, has been selected. Fig. 8 shows the testvehicle for SiC, where the difference in chip size is clearlyobserved as compared with Si in Fig. 1. The area of the SiC chipis approximately one quarter of the Si chip, while the thicknessis around 28 % higher.The dimensions and principal thermomechanical propertiesof Si and SiC chips are contrasted in Table V.Equation (4) indicates that the semiconductor materialproperties which determine the stresses on the solder are theYoung’s modulus (Echip) and the mismatch of CTE ( withthe solder. Although for SiC (19.6 10-6/K) is slightlysmaller than for Si (20 10-6/K), the increase of Echip dominatesthe stress on the solder, as the Young’s Modulus of SiC (501GPa) is much higher than that of Si (162 GPa), hence it can beFig. 8. The test vehicle for SiCIn order to compare the different stresses during powercycling of a Si chip and a SiC chip for reliability evaluation,both chips are subjected to the same junction temperatureprofiles, which will cause different thermomechanical stressesbecause of the different thermomechanical properties.Given the different thermal properties and dimensions of Siand SiC, the pulsed power load applied has to be adjusted toobtain the same temperature profile during the power cyclingtest simulations for both materials. Considering a test conditionof Tj,mean 90 C and Tj 120 C, in the case of the silicon chip apulsed power load with an amplitude of 2.75x10¹⁰ W/m3 (178Won the whole chip) is applied uniformly on the whole chip. Inthe case of the SiC chip, given its smaller size, the pulse powerload is adjusted to 3.24x10¹⁰ W/m3 (65.8W on the whole chip)for obtaining the same junction temperature profile.The period of the pulsed power load is 2s and the duty cycleis 50%, as shown in Fig. 9, where the pulsed power andresulting junction temperature excursion are shown for eachchip.The temperature distribution for both Si and SiC models,coincident with the instant when the maximum junctiontemperature Tj,MAX is reached on the models are shown in Fig.10. The chip, die-attach and part of the copper of the DBC underthe chip suffer higher thermal fatigue than the bottom of theDBC. This indicates that the fast power cycling mainly stressesthe die-attach solder layer instead of the baseplate solder layer.
According to (3), the temperature swing determines the fatiguestress caused by CTE mismatch and the high temperature canlead to more stresses on the die-attach. By using this powercycling condition and boundary conditions the models aresuitable to be used to evaluate the mechanical fatigue of dieattach solder layer.of the solder.(a) Chip top surfaceFig. 9. Power density cycle and resulting junction temperature profiles(b) Solder layer interfacesFig. 11. Temperature distribution on each interface(a) Si modelIV. STRESS AND LIFETIME COMPARISON(b) SiC modelFig. 10. Temperature distribution on the model at instant Tj,MAX is reachedThe temperature distributions on these stressed parts of themodel are as shown in Fig. 11 for the top surface of the chip,interface of die/solder and the interface of solder/DBC copper.The distance is the position on each surface to the center of themodel.The temperature of the SiC and Si chip center is both 150 Cextracted as the junction temperature Tj. Considering a quarterchip area and 2 times higher thermal conductivity of the SiC togive better heat dissipation performance as compared to Si, thetemperature on the interface of both chip and solder in the SiCmodel is lower than those in the Si model. However, in the SiCmodel, the temperature on the edge of chip surface and thetemperature on the edge of the solder top surface are both higherthan those in the Si model.In addition to the different temperature profiles on the solderand the dimensions of the chip, the different thermomechanicalproperties of the semiconductor material will cause differentstresses on the solder, resulting in a different lifetime accordingto the models presented previously. The next section of thispaper characterizes the stresses on the solder as a funct
results from different samples reveal that the shear stress in a SiC die-attach is higher than that in a Si device [20], and strain energy density tends to concentrate at the chip edge where the difference is 1.5 times between the SiC and Si devices under comparable conditions [9]. It is considered that the in-service