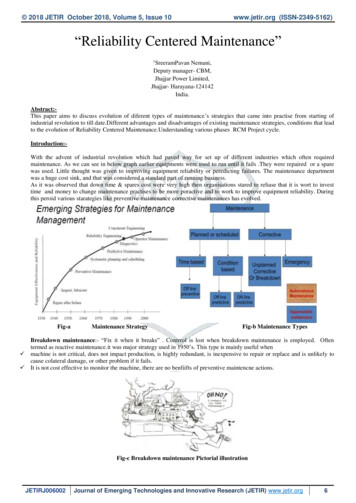
Transcription
RELIABILITY CENTERED MAINTENANCEEquations of RCMby Lyn n w o o d Ya t e s , C M R P, R i c h a r d O v e r m a n , CMRP & David Nelson, CMRPReliability Centered Maintenance(RCM) is an analytical process usedto identify policies and strategies thatmust be implemented to preserve thefunction of a physical asset. The selectedpolicy or strategy must achieve a tolerable probability of failure for failuremodes with safety and environmentalconsequences or must be cost effectivefor failure modes with operational andnon-operational consequences.As an analytical process, RCM relieson various equations to identify possiblefunction preservation strategies that aretechnically feasible and worth doing.The set of equations used depend on theconsequences of failure. The equationsfor each scheduled function preservation strategy are shown below and arefollowed by an alphabetical listing ofthe terms used.An important word of caution is inorder. These equations cannot be usedby rote. The analyst must understandwhat the equations are doing and makesure they apply to the situation. If theequation gives an answer that does notmake sense, it may not apply.On-Condition EquationsOn-condition (OC) tasks apply tofailure modes that have both safety/environmental as well as operational/nonoperational consequences. For failuremodes with safety/environmental consequences, the task interval must be shortenough to ensure that the probabilityof missing a potential failure is reducedto the tolerable level (Ptol). For failuremodes with operational/non-operationalconsequences, the SM task must be costeffective. In either case, it is necessary toidentify or estimate the interval betweenpotential and functional failure (PF).PF Interval CalculationThe PF interval can be determinedby the following methods in order ofpreference:1.2.3.4.Experimental dataDegradation analysisEngineering judgmentEstimated from an existing taskinterval using Equation 1 and 2.If method 1, 2, or 3 is used, the PFinterval is put directly into the othercalculations and the source of the number is documented in the RCM analysis.However, in conducting RCM wherethere are existing maintenance tasks,the analyst can estimate the PF intervalusing method 4 based on the intervalestablished for the existing task and theeffectiveness of the task.Equation 1It is noted that the existing task effectiveness (Taskeff) can either be estimatedand entered directly into the equationor calculated from Equation 2.Equation 1 is an estimate and therefore has some significant limitations thatthe analyst must be aware of when usingthe equations. First, the value for thetaΘ must be based on a good estimate ofthe capabilities and limitations of thetask to detect a potential failure. A highΘ coupled with an observed value forTaskeff that is significantly lower than Θwill result in an artificially high valuefor the estimate of the PF interval.Good data regarding the number of observed potential and functional failuresare also essential. Finally, the estimateshould be evaluated by personnel familiar with the operation — maintenanceand engineering individuals associatedwith the failure mode in question — toensure that the estimate is reasonable.If it does not appear reasonable, thedata may be indicating that a particularfailure mode’s characteristics do notfollow a progression from potential tofunctional failure or that the failure isnot a function of time.Note: The PF interval is solely a function of the failure mode. The equationsabove only estimate a value for PF basedon the observed results of an existingscheduled maintenance task. The valuesfor Task, Θ, and the existing on-condition interval (EOCI) only apply to thespecific inspection that was used whenthe data was collected. If evaluation of adifferent inspection is desired, then newvalues must be estimated or new datacollected.Safety/EnvironmentalEquation 2Once the PF interval is established,scheduled monitoring intervals forVolume 12, Issue 2 RELIABILITY Magazine13
failure modes with safety or environmental consequences canbe established using Equation 3.SMI PF/nEquation 3Equation 4Where: Note that if the failure mode is evident, Ppdf 1. If thefailure mode is hidden, Ppdf must be provided.operational/non-operational consequences, the SR task mustbe cost effective. Cost effectiveness is based on the cost benefitratio calculated with Equation 7. The key variables of Equation7 are the scheduled removal task interval (SRI), the mean timebetween failures of those that fail before the scheduled removal(k), and the percentage that survive to the scheduled removalinterval (s). These three terms are related in that when SRIincreases, “k” increases, and “s” decreases. In practice, SRI isinitially set as the wear-out age and the associated “k” and “s”are used to see if the task at the wear-out age is cost effective.If the cost benefit ratio (CBR) is less than one, the task is costeffective, if it is greater than or equal to one, it is not. If thetask is not cost-effective at the wear-out age, a longer age canbe evaluated keeping in mind that “k” and “s” must reflect theinterval being used.Operational/non-operationalFor operational and non-operational consequences, theinspection interval is based on a cost analysis. To perform thiscost analysis the value for n is calculated using Equation 5 andthe inspection interval is then calculated from Equation 3.Equation 7To complete the RCM analysis for scheduled removal tasks,it is necessary to calculate the cost per unit time of the SRoption using the numerator of Equation 7. The cost analysis isnot used to determine the technical feasibility of the task butto compare the SR option with other options to determinewhich technically feasible option is worth doing.Equation 5Failure Finding Equations — For Hidden FailuresTo complete the RCM analysis for scheduled monitoringtasks, it is necessary to calculate the cost per unit time of theOC option using Equation 6. The cost analysis is not used todetermine the technical feasibility of the task but to comparethe OC option with other options to determine which techni-A failure finding task (FF) is used to identify when a hiddenfunction is in a failed state. The goal is to determine the interval at which the combined probability that the protective andprotected functions are in a failed state at the same time is lessthan tolerable. This is reflected in Equation 8. These probabilities can be statistically determined or determined by the meantime between failures (MTBF) of the respective systems.cally feasible option is worth doing.Equation 6Scheduled Removal Equations — Rapid Wear-outMust Be DemonstratedScheduled removal (SR) tasks apply to failure modes thathave both safety/environmental and operational/non-operational consequences. For failure modes with safety/environmental consequences, the task interval must be short enoughto ensure that the probability of failure is reduced to the tolerable level (Ptol). This is determined statistically based on thefailure distribution of the component. For failure modes with14RELIABILITY Magazine Volume 12, Issue 2Equation 8Equations 9 and 10 are used to determine the probabilitiesusing the MTBFs and assuming a random failure distribution.Equation 9 is the general probability equation for a randomdistribution. Equation 10 substitutes Equation 9 into the righthand side of Equation 8 for the probability of failure for theprotected and protective functions over a specified failurefinding task interval and sets them equal to the probability ofmultiple failure.
Trust The ExpertiseWe Provide Accurate, repeatable results Market competitive pricesManitoba Hydro’s OILTRACKTMprogram offers high-quality, timelyand affordable oil testing services.Electrical Insulating Oil PCB detection Fault gas Furans & inhibitors Quick turn around times Familiarity with industrialenvironments Professional & friendlystaffWe’re UpFor The TestLubricating Oil Lubricant condition Oil analysis for predictivemaintenance of equipmentWhy test with Oiltrack? Extend the life of electricaland mechanical equipment. Prevent failures through earlydetection. Make informed decisionsto optimize maintenancefrequency and schedulingof equipment repair andreplacementTests That MeetYour Needs SF6 gas Soil and water analysis Asbestos, metals, fuels,oils & moreA full service laboratory, with several locationsin southern Manitoba, Manitoba HydroLaboratories has more than 45 yearsexperience serving specializedtesting needs.For more information,please visit www.oiltrack.ca,or contact Joaquin Carneiro,Chief Chemist, at 1-204-782-3317Volume 12, Issue 2 RELIABILITY Magazine15
Top 10 Reliability Solution ProvidersReliabilityShopperExcellence inMaintenance & Reliability Services1Leading the World in ing Maintenance, Delivering Reliability843-744-7110www.LCE.com2Maximizing the Return on Asset xperts in Making Reliability Inc.Root Cause Analysis804-458-0645www.reliability.comReliability Software, Training & Engineering Services509.928.5083 / 5084www.reliabilityusa.com78910Masters of Reliability Process Implementation952-882-8122www.rmgmpls.comImproving People, Process & Technology Performance770-717-2737www.pcaconsulting.comRCM, Lean, Six Sigma, Asset cm.htmlInfrared Inspection Windows and Installation Services800-281-0650www.infraredwindow.comTo learn more about theseTop 10 Maintenance & Reliability Solution Providers please visitwww.reliabilityshopper.com
Equation 9Equation 10In practice Ptol is set equal to Pmf as shown in Equation 11. Thisrequires an iterative solution to find the failure finding task interval (FFI) that provides the equality. The FFI that providesEquation 11Equation 11 provides the interval that achieves the tolerableprobability of failure within the scheduled failure finding taskinterval. This can be more conservative than necessary since thegoal is to reduce the probability of failure to the tolerable levelover the remaining useful life of the item. To determine thescheduled failure finding task interval that achieves this goal,it is necessary to find the tolerable MTBF using Equation 12.Equation 13 can then be iterated to find the FFI that reduces theprobability of failure to the tolerable level over the remaininguseful life.Equation 12Equation 13To complete the RCM analysis for FF tasks, it is necessary tocalculate the cost per unit time of the FF option using Equation 14. The cost analysis is not used to determine the technicalfeasibility of the task but to compare the FF option with otheroptions to determine which technically feasible option is worthdoing.Equation 14Volume 12, Issue 2 RELIABILITY Magazine17
Top 10 Reliability Software ce Software1Capturing Workplace Expertise to ImproveEquipment Performance1-877-746-3787 www.ivara.com3a n i n t e g r y s c o m p a nyLarge Enough to Lead. Smart Enough to Listen.864-458-3333www.assetpoint.com52Maintenance Development Strategy and Spares OptimizationUSA: 508-359-1966Asia/Pacific: 61 3 9455 2211www.strategicorp.com4PROACT. Eliminating Problems. Eliminating Stress.804-458-0645www.reliability.com /proact/proact.htm6The Sensible Approach to Maintenance ManagaementMalaysia 603 8656 9041US nc.Asset Intelligence At Your Fingertips1-888-AVANTIS or 905-632-6015www.avantis.net8RCM Software & Training Video408-365-1975www.jmssoft.com9A Simpler CMMS360-678-8358www.benchmate.com10MIMOSA-based Maintenance Intelligence Software866-247-2122www.mtelligence.netRELIABILITY Magazine Volume 12, Issue 2Gold Standard in Asset Management813-621-6463www.pdma.comTo learn more about theseTop 10 Maintenance & Reliability Software Providers please visitwww.reliabilityshopper.com
TermsCost benefit ratio (CBR) – This is a measure of thecost effectiveness of a task.Cost of repairing a functional failure (CFF)– When a failure occurs, it must be repaired or thefunction replaced. This cost includes the cost of the timeand materials necessary to repair the failure. The costof any down-time needed to perform the repair and thecost of repairing any collateral damage may also beincluded.Cost of repairing a potential failure (CPF) – Thisis the cost of repairing a potential failure condition thatis found by a SM task. This cost includes the cost of thetime and materials necessary to perform the repair. Thecost of any down-time needed to affect the repair mayalso be included.Cost of scheduled failure finding task (CSFF)– This is the cost of performing one SFF task. This costincludes the cost of the time and materials necessary toperform the SFF task. The cost of any down-time neededto perform the task may also be included.Cost of the scheduled monitoring task (COC)– This is the cost of performing one OC task. This costincludes the cost of the time and materials necessary toperform the OC task. The cost of any down-time neededto perform the inspection may also be included.Cost of the scheduled removal task (CSR) – Thisis the cost of performing one SR task. This cost includesthe cost of the time and materials necessary to performthe SR task. The cost of any down-time needed to replace the component or system may also be included.Functional failures not found by existing task(EFF) – The number of times that the system or component exhibited a functional failure between or not foundby SM tasks.Potential failures found by the existing task(EPF) – When there is an existing SM, the number oftimes that the existing SM found a potential failure condition is identified.Existing on-condition task effectiveness(Taskeff) – This is a measure of the quality of the existing scheduled monitoring task. It is either estimatedin terms of a percentage (i.e. the task finds potentialfailures 80% of the time and allows functional failures20% of the time so the task effectiveness is 0.8 or canbe calculated from the EPF and EFF.Initial task interval (I) – In some cases it is reasonable to delay implementing a SM task until some of thelife is used. For example, a structural member may notneed to be checked for a crack from the first day it isput into service. In these cases, an initial inspection interval is established. Once the initial interval is reached,the SM task is performed according to the SMI. In thestructural example, I might be 1,000 operating hoursand SMI might be 100 operating hours. Hence, the SMtask will not be performed until the item reaches 1,000operating hours and then performed every 100 operating hours.Total design life (L) – As the name implies, this is thetotal amount of time the item was designed to be used.It can also be interpreted to mean the total amount oftime the user intends to use the item from the first day itenters service. It is possible that the users intended lifeis less than the actual design life or the design life isshorter than the desired life. In either case, use the shortest measure of the two times. This should be notated asthe lesser of the two numbers.Average life of failures before interval (k)– This is used when there are operational or non-operational consequences and the SR interval is set such thatsome items may fail before the prescribed interval. The“k” factor is the mean time between failures of the itemsthat fail prior to the SR interval as a percentage of theSR interval.Mean time between failures without anyscheduled task in place (MTBFnsm) – The meantime between failures when the system or component isnot being protected by a scheduled maintenance task.This is normally calculated as the population operating time over a specific period of time divided by thenumber of functional failures (or estimated number ofexpected functional failures) over the same period oftime.Mean time between failure of the protectedfunction (MTBFpdf) – This is the mean time betweenfailure of the function that is being protected by the protective device. In other words, this is the mean time thatthe protective device’s services will be needed.Mean time between failure of the protectivefunction (MTBFpvf) – This is the mean time betweenfailure of the item that is performing the protective function. Looked at another way, this is the mean time thatthe protective device will enter into a failed state.Volume 12, Issue 2 RELIABILITY Magazine19
Tolerable mean time between failure (MTBFtol)–This is the mean time between failure that is required tobe achieved by performing the failure finding task. Thiscan be viewed as the tolerable MTBF that the item willbe in a failed condition at the time that it is needed.Number of inspections within the PF interval(n) – This is the number of times that the scheduled monitoring task is to be performed within the PF interval.This number is based on the tolerable probability offailure for safety or environmental consequences and oncost for operational or non-operational consequences.Interval between potential and functional failure (PF) – The amount of time (however defined) thesystem or component will operate between the development of a potential failure condition and achievingfunctional failure. The PF interval can be a calculatedvalue based on relevant data or an estimate based onknowledge and experience.Probability of failure of multiple functions (Pmf)– For hidden failures where there is a protective device,this is the probability that the protected function and thefunction that protects it (the protective function) will be ina failed state at the same time. It is the quotient of theprobability of failure of each of the functions.Probability of failure of the protected function(Ppdf) – For hidden failures where there is a protectivedevice, this is the probability that the protected functionwill fail and the protective device will be needed. In thecase of items that are designed to warn of a particularcondition (e.g. fire detectors), this is the probability thatthe condition will occur within a specific period of time.Probability of failure of the protective function(Ppvf) - For hidden failures where there is a protectivedevice, this is the probability that the protective functionwill fail and will not be available when needed.Tolerable probability of failure (Ptol) – This is theprobability that is considered to be the highest acceptable probability that the failure mode will occur in aspecific unit of time. The probability varies depending onthe consequences of failure. This term is generally usedfor safety and environmental consequences. While it isnot typically used for operational and non-operationalconsequences, there are situations where it could beused. As used in RCM, this term more precisely describesthe probability that a particular task will fail. That is thatthe task will not detect a condition or prevent a failure itis designed to prevent.20RELIABILITY Magazine Volume 12, Issue 2Remaining useful life (RUL) – The remaining usefullife is the amount of time the user intends to use the itemfrom a specified date. It can be calculated as the designlife (L) minus the life already used.Percentage of items that survive to a SR interval (s) – This is used when there are operational or nonoperational consequences and the SR interval is set suchthat some items may fail before the prescribed interval.This is the percentage (expressed as a decimal) of itemsthat will fail prior to the prescribed interval.Failure finding task (FF) – This is a task that isperformed at regular intervals to determine if a hiddenfunction is in a failed state.Failure finding task interval (FFI) – The time atwhich a component or system is tested to determinewhether it can perform its required function.Failure finding option (FFop) – This is the analysis ofthe option of using a scheduled failure finding task as thefunction preservation strategy.On-condition task (OC) – A task developed to lookfor a specific potential failure condition and the actionthat is taken is based on the condition in which the component or system is found. This is also known as predictive maintenance (PdM), on-condition task, continuousmonitoring, or a scheduled inspection.Scheduled removal (SR) – A schedule removal taskis implemented as a specific point in time (however timeis defined). When a system or component reaches thespecified time (life) the component or system is removedand replaced with a new or overhauled component orsystem.Scheduled removal interval (SRI) – The time atwhich a component or system is removed from serviceregardless of its condition. This interval is based on a statistical determination of the component or system exhibiting a wear-out failure characteristic.Scheduled removal option (SRop) – This is theanalysis of the option of using a scheduled removal taskas the function preservation strategy.Time (t) – Any period of time. Time can be measuredin clock hours, days, operating hours, landings, or anyother appropriate usage measurement.Probability of detecting a potential failure (Θ)– Theta is the probability that a potential failure will bedetected with one inspection given that the potential fai-
ure condition exists. This is a measureof the quality of the inspection task.Existing on-condition (EOCI) – Thisis the interval of an existing OC.On-condition interval (OCI) – Thisis the time between scheduled monitoring inspections. The interval can beas short as micro-seconds (for continuously monitored systems) to very longperiods of time.On-condition option (OCop) – Thisis the analysis of the option of using ascheduled monitoring task as the function preservation strategy.Challenge Yourself With ThisExample Problem!You have been assigned to perform anRCM analysis of a system. The systemcontains a pump and you are ready to analyze an internal failure of the pump whichis one of the failure modes of the system.There is no back-up pump; so when thepump fails, the system is down. When researching the data you learn that the pumphas been in service for 21,900 operatinghours and it is intended to be used for anadditional 70,000 operating hours. Thepump runs an average of 20 hours eachday. There are 10 pumps in service in theplant that do the same job. A sister planthas the same pumps doing the same jobbut does not do any scheduled maintenance on the pumps. They report that onthe average, they have a pump failure onceevery two years. They also have 10 pumpsthat have been in service for an average of21,900 hours (three years) each.A vibration analysis is performed onthe pump once a month. Over the lastfive years, the vibration analysis has found20 pumps in the process of failing. Five pumps have failed in service without being identified as bad by the vibration analysis.It takes two man-hours to perform the vibration analysis. There are no other costs to perform the task. When the vibrationanalysis finds a bad pump it is replaced with an overhauled pump and sent to the shop for overhaul. The replacement pump cost 2,000 and it takes 3 man-hours to replace the pump. The system is down for a total of one hour. At your request, a quick studywas performed where a pump with a known defect was tested by every vibration analyst. The defect was found 90% of the time.A Weibull analysis has a beta of 5.67 which is indicative of a wear-out characteristic. For safety consequences, the pump hasa 1X10⁻⁶ probability of failure after one year. It can also be shown that there is a linear relationship between the SRI, “s”, and“k.” That means that for every percent the SRI is decreased, “s” increases by 1% and “k” decreases by 1%. At five years, “s” is0.95 and “k” is 0.9.If the pump fails, it is damaged to the point that it cannot be repaired. A new pump costs 10,000. The catastrophic loss of flow inthe system causes other problems. Therefore, it takes 10 man-hours to perform the repair and the system is down for five hours.Volume 12, Issue 2 RELIABILITY Magazine21
IFSubscribe to UptimeYou are reading this.Your job depends onequipment running.You have anything to do withMaintenance or Reliability.You manage a PdM/CBM team.Uptime is the only publicationdedicating 100% of its coverageto Predictive Maintenance andCondition Based Monitoring.For your FREE subscription go towww.uptimemagazine.com
From the ground rules and assumptions, you learn that an hourof down time costs the company 5,000 and a standard man-hourrate of 75.00 has been established. The Ptol is 1X10⁻⁶ for safetyconsequences and 1X10⁻⁴ for operational consequences.With the above information, calculate the scheduledmaintenance option for safety consequences and operationalconsequences that is technically feasible and worth doing.You can find the answer on the RELIABILITY Magazine website at http://www.reliability-magazine.com.ConclusionThe formulas derived for RCM are robust and well proven.As with any calculation, however, the quality of the inputsdetermines the accuracy of the output. Caution should be usedto avoid a rote usage and always tempered with good engineeringjudgment. The limitations of the equations must be clearly understood. Using a quantified approach to RCM, even if it involvesbest estimates and assumptions, provides meaningful results thatmake the analysis more understandable and believable. The costdata is clear and useful for putting the results of the analysis interms that management can grasp and relate to their decisionmaking processes.About the AuthorsLynnwood Yates is a Certified Maintenance & Reliability Professional and is a Senior RCM Engineer for Wyle Laboratories, Inc.He has oversight for all Air Force RCM efforts within the company.Contact information: Lynnwood E. Yates, CMRP Principle RCMEngineer Wyle Laboratories, Inc. 813 Park Drive Warner Robins, GA31088 866-922-4314 (office toll free) 478-923-0500 (office local)478-923-0240 (fax) 478-290-9142 (cell) lynnwood.yates@wylelabs.com.Richard Overman is a Certified Maintenance & Reliability Professional and is the former Chief Engineer for Wyle Laboratories, Inc.He is the author of numerous articles on RCM and conducts RCMtraining for practitioners and managers.David Nelson, CMRP, works at Wyle Laboratories as a SeniorRCM Engineer.This article was part of a presentation done at RCM 2006 – TheReliability Centered Maintenance Managers’ Forum held March8-10, 2006 in Las Vegas, Nevada, sponsored by Reliabilityweb.com.ReferencesNaval Air Systems Command Reliability-CenteredMaintenance Management Manual (NAVAIR 00-25-403)web-site - 03.pdf RCM II (second edition), 1997 by JohnMoubray.Volume 12, Issue 2 RELIABILITY Magazine23
RELIABILITY Magazine LLCPO Box 34040Knoxville TN 37930Tel: 888-575-1245 x6 Fax: 865-381-0506RELIABILITY Magazine Subscription FormMove ahead with other RELIABILITY Magazine readers bysubscribing now at http://www.reliability-magazine.com orcomplete this form and return it to the address above.Subscription DetailsNameTitleCompanyAddressCity, State, ZipCountryPhoneFaxEmailCredit Card DetailsAMEXMCVISAUSA 3 Years (18 issues) 2972 Years (12 issues) 1981 Year (6 issues) 99International 3 Years (18 issues) 2972 Years (12 issues) 1981 Year (6 issues) 99(circle one)Card NumberName on CardEx DateBilling Address (this is the address where the credit card statements are delivered)AddressCity, State, ZipCountrySignatureTHE MAGAZINE FOR IMPROVED PLANT PRODUCTIVITY
Volume 12, Issue 2 RELIABILITY Magazine 13 RELIABILITY CENTERED MAINTENANCE Equations of RCM by Lynnwood Yates, CMRP, Richard Overman, CMRP & David Nelson, CMRP Reliability Centered Maintenance (RCM) is an analytical process used to identify policies and strategies that must be implemented t