Transcription
Aly and Dimitrijevic Journal of Engineering and Applied 2022) 69:15RESEARCHJournal of Engineeringand Applied ScienceOpen AccessPublic green space quantity anddistribution in Cairo, EgyptDalia Aly1,2*and Branka Dimitrijevic1* Correspondence: dalia-aly-gaafaraly@strath.ac.uk; daliaali@eng.asu.edu.eg1Department of Architecture,Faculty of Engineering, University ofStrathclyde, 75 Montrose Street,G11XJ, Glasgow, UK2Department of Architecture,Faculty of Engineering, Ain ShamsUniversity, 1 Elsarayat Street,Abbasiya, Cairo 11517, EgyptAbstractGreen spaces are recognised as an important contributor in enhancing the quality ofurban life. Many cities are now working on preserving and increasing their greenspaces as a part of their sustainable development plans. Unfortunately, green spacesin Cairo are currently being marginalised and the city has been losing significantquantities of its already limited green spaces in favour of other developmentalprojects. This article analyses the quantities and distribution of existing green spacesin Cairo using official numerical data. The results show recent changes thathappened between the years 2017 and 2020. The focus is on public green spaces:amenity green spaces between residential blocks, street green spaces, plant nurseriesunder public management and public parks. Finally, the trend of disappearing greenspaces in Cairo is discussed. The discussion extends the comparison to include datafrom the years 2000 and 2006 to demonstrate the rapid changes happening in Cairothat are altering the city and affecting many of its residents. The problem of lack ofdata about green spaces is also examined in the discussion. Documenting greenspaces areas and distribution in Cairo is important because no recent published dataare available for decision-makers, researchers and planners. Data is also scatteredbetween different sources because of the division of management responsibilitiesbetween different public agencies. A larger-scale project is required to accuratelysurvey all green spaces in Cairo and create a comprehensive publicly accessiblegeographical database that documents all their types, quantities and distribution.Keywords: Cairo, Green space, Public park, Urban inequality, Disparities,Development, InfrastructureIntroductionThe city of Cairo, in over a thousand years, had grown vastly in area, from around 7km2 when founded as al-Fustat [23], to 840 km2 [27]. It has the highest number of inhabitants in Egypt—around 9.9 million—which represents 10% of the Egyptian population [11]. It had gone through major transformations that gradually changed its urbancharacter. Nowadays, Cairo is still subjected to rapid changes and both formal and informal development. The old urban core is still growing and attracting more population while new communities are expanding towards its desert boundaries with newdistricts and satellite cities. Through the process of urbanisation, Cairo has been losing The Author(s). 2022 Open Access This article is licensed under a Creative Commons Attribution 4.0 International License, whichpermits use, sharing, adaptation, distribution and reproduction in any medium or format, as long as you give appropriate credit to theoriginal author(s) and the source, provide a link to the Creative Commons licence, and indicate if changes were made. The images orother third party material in this article are included in the article's Creative Commons licence, unless indicated otherwise in a creditline to the material. If material is not included in the article's Creative Commons licence and your intended use is not permitted bystatutory regulation or exceeds the permitted use, you will need to obtain permission directly from the copyright holder. To view acopy of this licence, visit http://creativecommons.org/licenses/by/4.0/. The Creative Commons Public Domain Dedication o/1.0/) applies to the data made available in this article, unless otherwise stated in acredit line to the data.
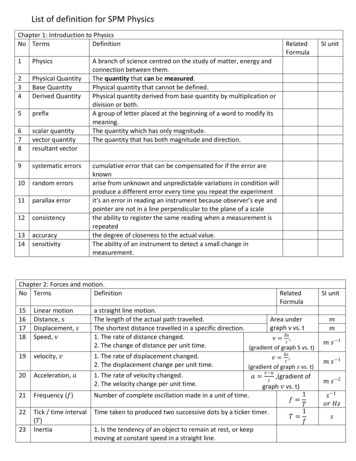
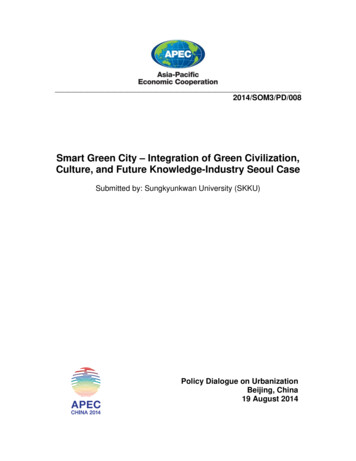
Aly and Dimitrijevic Journal of Engineering and Applied Science(2022) 69:15large areas of its agricultural lands, in addition to the growth of informal settlementswith poor living conditions. The city suffers many problems, like traffic congestion,poor air quality, water pollution and inefficient waste management [7, 22, 27]. Alongwith these problems, Cairo also lacks the presence of sufficient green spaces that canmitigate these problems and decrease their harmful effects.This article assesses the current situation regarding the provision of green spaces andpublic parks in Cairo. The goal is to highlight the critical position the city is currentlyat regarding the presence of sufficient quantities and adequate distribution of greenspaces by providing recent numerical data that overcome the limitation in the currentlyavailable sources. The “Methods” section explains the scope of the study, the types ofgreen spaces included and the process of data acquisition. Types of green spaces thestudy includes are amenity green spaces between residential blocks, street green spaces,plant nurseries under public management and public parks. It also focuses only ongreen spaces and public parks in Cairo’s districts and does not include newcommunities.Afterwards, the results compare the most recent changes, during the years 2017 and2020, in the provision of green spaces in Cairo as a whole and in its districts. They alsoshow the existing public parks in the city, their areas and distribution. Finally, the discussion follows the green spaces changes that happened over the years, extending tothe years 2000 and 2006, reaching the current critical state of low presence and poordistribution of green spaces over the city. The trend of disappearing green spaces is discussed within the urban development approach that has been followed recently inCairo. The negative effects of losing green spaces in Cairo are also highlighted. The discussion also examines the problems related to the lack and fragmentation of Cairo’sgreen spaces data.MethodsResearch scope: Green spaces in CairoCairo City is divided into 4 main regions (Southern, Western, Northern and Eastern)which consist of 37 districts. At the periphery of the southern and eastern regions, thereare 4 new communities. The districts and new communities lie under different administrative jurisdictions, but together they form the boundaries of Cairo Governorate. This research focuses on public green spaces in the 37 districts of Cairo City (Fig. 1).Urban green spaces are vegetated open spaces in cities that can be either public orprivate ([15, 26], p. 282 and 778 [16, 18];). Cairo has several types of public greenspaces that differ in areas, features and use. The city does not have an official classification for all its green areas except for the classification adopted by Cairo Cleanliness andBeautification Agency (CCBA) which covers only the green spaces they manage. According to CCBA data, the agency divides green spaces into six categories: 1) publicparks, 2) main axes green spaces, 3) self-efforts green spaces, 4) nurseries, 5) DistinctiveGardens (DG) and 6) Specialised Gardens (SG) (Table 1).Green spaces categories adopted by CCBA are different from the common categoriesfound in literature. For example, as the main feature of CCBA public parks, is beingfree, green space in a residential block or a green strip along a street are included. Theydo not separate between amenity green spaces and linear green spaces along streetsPage 2 of 23
Aly and Dimitrijevic Journal of Engineering and Applied Science(2022) 69:15Fig. 1 Cairo Governorate (Cairo City and its surrounding new communities)except for major streets. DG and SG are the public parks in Cairo as they are greenspaces used mainly for recreation [26]. However, they do not have free access andCCBA does not categorise them as public parks. Public parks, including DG, SG andother major public parks in Cairo, are one of the green space types that are includedwithin this study in more detail.Cairo also has other types of public and private green spaces. For example, privateclubs and youth clubs often include some green areas. Institutional buildings likeschools, universities, museums and other public buildings may also have green areas.These types of green spaces can contribute to providing several benefits to the city, butPage 3 of 23
Aly and Dimitrijevic Journal of Engineering and Applied Science(2022) 69:15Page 4 of 23Table 1 CCBA Categorisation for green spaces and equivalent category in literatureCCBA categoryDefinitionCategories accordingto Swanwick et al. [26]Public parksAmenity green spaces in the districts’ streets, squares andbetween buildings in residential areas that are free to useAmenity/incidentalgreen spacesLinear green spacesMain axes green spacesGreen spaces at the middle or sides of main streetsLinear green spacesSelf-efforts green spaces Green spaces created through collective efforts of residents Amenity/incidentaland the support of CCBAgreen spacesNurseriesUsed to grow different types of vegetation to be used byCCBA and to sell to the publicFunctional green spacesDistinctive gardens (DG) Green spaces that are controlled and actively managedAmenity/recreationalfor recreational use by a dedicated management agency— public parkthe DG AdministrationSpecialised gardens (SG) Green spaces that are controlled and actively managed for Amenity/recreationalrecreational use by a dedicated, independent management public parkagency—the SG Administrationthey have not been included in this study for two reasons: the limited public accessibility of some of these green spaces and the lack of comprehensive data that covers all ofthem as the responsibility of their management is divided between several authorities.Accordingly, this research covers only standalone types of green spaces and those thatare part of a street or a square.Data acquisitionTo analyse the current situation in Cairo regarding its green spaces, three data typeswere required: (1) areas of green spaces in different districts, (2) population number ateach of them and (3) shapefile for the administrative boundaries of Cairo and the division of its districts. The shapefile was acquired from the “Transport for Egypt Project”and modified to be integrated with the other data types. Population data and greenspaces areas for 2020 were linked geographically in ArcMap with the shapefiles of thedistricts to create a database for green spaces in Cairo. They were used to calculate the2020 individual share of green spaces in Cairo and in each of its districts which werealso added to the database. Finally, points were created for public parks locations inCairo. The data were used to create maps using ArcMap, besides representing them intables and graphs. Detailed tables and additional information about data acquisition areincluded as Supplementary materials.For population data, the research depended on the data published by the CAMPAS[12] for the year 2017, and for 2020, the Cairo Governorate Portal [10] was used. Onthe other hand, finding accurate data about areas of green spaces in Cairo can be difficult. The data available from previous research are outdated and GIS mapping forgreen spaces in Cairo is not available online. To achieve comprehensive data within thecurrent limited availability, the research synthesised areas of green spaces from varioussources for the years 2017 and 2020.First of all, because CCBA manages most of the City’s green spaces, the agency wascontacted to provide the data for the green spaces’ areas. Excel files were obtained withareas of green spaces in each district in Cairo for the years 2017 and 2020. These datacovered the types of green space that were presented in Table 1 except for the SG.
Aly and Dimitrijevic Journal of Engineering and Applied Science(2022) 69:15Secondly, other agencies were contacted for some missing data for the similar types ofgreen spaces: (1) the SG Administration: for the SG areas, and (2) al-Nasr Company:for additional residential amenity/incidental green spaces that they still manage and arenot handed over to CCBA in two districts, al-Moqattam and al-Basatin. Finally, areas ofwell-known public parks, which are not managed by either CCBA or the SG Administration, were also added from internet sources or calculated using ArcMap. Thesemajor parks included: the Cultural Park for Children (CPC) [1], al-Fustat Park1 andArab al-Mohamady Park2 [5] (which are managed by CCBA and were yet not includedin their data), al-Azhar park [2], Merryland Park [14], al-Zohriya Park (Cairo [9]), theAquarium Grotto Park [25], the Child Centre of Civilization and Creativity (CCCC), alMaadi Island, al-Helmiya, Badr, al-Andalusiya and Panorama October parks 3.Modified data from previous researchThe most recent data that were mentioned in the previous part needed to be comparedin the discussion with data from previous years to show the changes that happened inCairo. Data were found for the years 2000 and 2006 from previous research. However,these data could not have been discussed directly and some modifications were required to allow more consistency in the comparison. The boundaries of Cairo for allthe years are the same but the internal divisions of the districts have some changes.Some districts that were previously merged and managed as one, have been dividedinto two separate districts. Besides presenting the data according to the most recent divisions, green spaces areas, population number and the individual share of green spaceswere recalculated for the merged districts to allow a consistent comparison betweenthe 4 years.For the year 2006, a master thesis by Assem Shaban4 (2009) included a study of greenspaces’ areas in Cairo. His research also depended on data from CCBA. The excel fileShaban originally acquired was requested, and he sent it by email. The table in theexcel file included areas for green spaces in each district in Cairo divided into CCBAcategories but including also youth centres and sports clubs, and green spaces insidegovernmental buildings. A sum was calculated for each district to be used in this research but excluding youth centres and sports clubs, and green spaces inside governmental buildings as these types are not within the scope of this research as mentionedearlier. Population data for the year 2006 were available from CAPMAS [13].For the year 2000, al-Zafarany [4] article was used as a source for data but somemodifications were needed also for consistency. The article categorised green spaces asrecreational areas which indicated that the total areas might not include only greenspaces. That was confirmed when the data were revised in detail and green spaces’areas in some districts were shown to have a high value when compared to the year1Area was calculated using ArcMap because official sources mention a much bigger area for the park whichby examining the satellite images and after visiting the park was found to be significantly less than thatmentioned area.2At the beginning of 2021, Arab al-Mohamdy park and the SG, al-Waily, were handed over to Ain ShamsUniversity after an administrative decision that the two parks belong to the Faculty of Medicine Campus.3Areas were calculated using ArcMap because there were not any data available online for the areas of theseparks.4The data in his thesis included a different boundary for Cairo with fewer districts which would have madeany comparison inaccurate, so it was better to get the original data and recalculate the values to unify theboundaries and the number of districts.Page 5 of 23
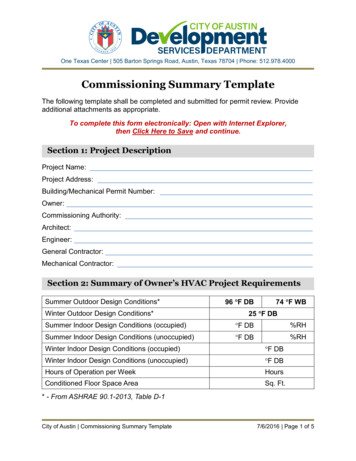
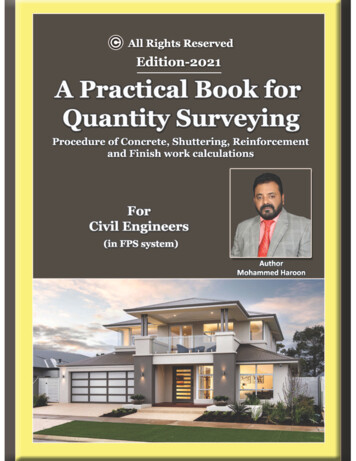
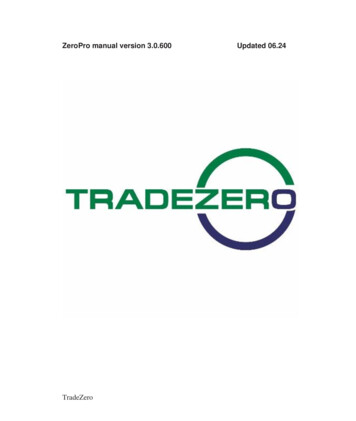
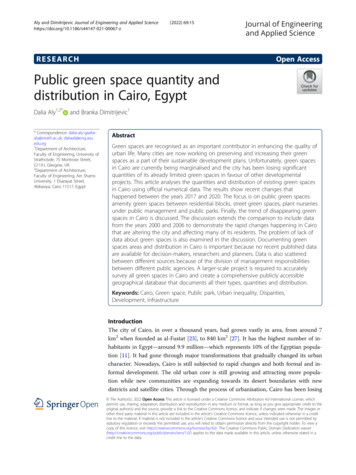
Aly and Dimitrijevic Journal of Engineering and Applied Science(2022) 69:152006. Al-Zafarany data were also originally from CCBA which is expected to have thesame format as the data from the year 2006. It was concluded that youth centres andsports clubs were part of the recreational areas he calculated. Accordingly, the youthcentres and sports clubs areas in the 2006 data were subtracted from the totals of eachdistrict mentioned by al-Zafarany [4]. The establishment dates of the youth centres andsports clubs were revised using the Ministry of Youth and Sports website to ensure thatthere were not any new centres or clubs between the two dates. The population dataused by al-Zafarany were used after correcting a minor mistake in the population number of al-Moqattam and al-Khalifa districts.ResultsGreen spaces provision and distribution in CairoFigure 2 shows the dominance of desert areas, the dense urban fabric and the low availability of green spaces in Cairo. The data collected about green spaces in Cairo showsthat the city has a limited presence of green spaces. Between the years 2017 and 2020,Cairo lost 910,894 m2 of its already limited green spaces. With the increase of its population number, the individual share of green spaces decreased from 0.87 to 0.74 m2(Table 2). The highest loss of green spaces was mainly in Heliopolis and East Nasr City.Heliopolis lost 272,274 m2 between the years 2017 and 2020 while East Nasr City lost311,283 m2 5.Moreover, Cairo does not only have a problem with the overall quantity of greenspaces but also with their uneven distribution across its districts6 (Figs. 2, 3 and 4). Inthe year 2020, 22 districts out of 37, where 66% of the population live, had an individual share of green spaces less than 0.50 m2. The lowest share in this category is 0.01 m2at al-Matariya and the highest is at Abdin, 0.46 m2. Only 5 districts have an individualshare of more than 3 m2: Gharb al-Qahira (10.04 m2), al-Maadi (5.27 m2), al-Nozha(5.00 m2) and Heliopolis (3.52 m2). Wasat al-Qahira district is the location of al-Azharpark and also has a relatively low population number which contributed to its placement amongst the higher categories of individual share of green spaces in Cairo with3.22 m2/individual.Finally, 7 districts in Cairo lie between 0.50 and 1.50 m2 of green spaces per individual. This means that 83% of Cairo’s population live in districts with an individual shareof green spaces less than 1.5 m2. Al-Basatin is the lowest in this category with 0.54 m2/individual and Misr al-Qadima is the highest with 1.35 m2/individual. The individualshares for the other five districts are al-Azbakiya (0.59 m2), al-Mosky (0.90 m2), Helwan(0.91 m2), al-Tebin (1.13 m2) and al-Waily (1.19 m2). The middle category, between1.50 and 3.00 m2 of green spaces per individual, has only 3 districts: East Nasr City(1.69 m2/individual), al-Moqattam (1.80 m2/individual) and West Nasr City (2.86 m2/individual). East Nasr City, despite having the second-highest green spaces area inCairo (1,116,468 m2), its high population number lowered the residents’ share of greenspaces significantly.5For the detailed data of green spaces in Cairo, check Tables 1 and 2 in the Supplementary materials.For the detailed data of green spaces distribution in Cairo, check Tables 1 and 2 in the Supplementarymaterials.6Page 6 of 23
Aly and Dimitrijevic Journal of Engineering and Applied Science(2022) 69:15Fig. 2 Satellite image taken in September 2019 showing green spaces in Cairo. Intensity of the greencolour was changed to show the green spaces more clearly. Original satellite image is from NasaEarth mages/146Public park provision, distribution and area categories in CairoFifty-four public parks have been identified in Cairo that have dedicated managementand offer active recreation7. The distribution of these parks is not equal betweenCairo’s districts (Fig. 5). Many districts that do not have green spaces in general also donot have public parks, while some of them have more of the other types of amenitygreen spaces and private clubs but fewer public parks. Al-Nozha District, for example,has one of the highest quantities of green spaces in Cairo, but it only has the Child7For the detailed data of public parks in Cairo, check Table 3 in the Supplementary materials.Page 7 of 23
Aly and Dimitrijevic Journal of Engineering and Applied Science(2022) 69:15Table 2 Summary of green spaces data in the years 2017 and 2020YearGreen spaces area m2Population numberIndividual share of green spaces 949,415,7660.74Fig. 3 Distribution of green spaces in Cairo based on 2020 dataPage 8 of 23
Aly and Dimitrijevic Journal of Engineering and Applied Science(2022) 69:15Fig. 4 Individual share of green spaces in Cairo based on 2020 dataCentre of Civilization and Creativity (CCCC) which is partially a park but mainly a museum for children. Similarly, Heliopolis only has Merryland Park which is currentlyclosed.Gharb al-Qahira has the highest number of public parks and also the highest individual share of green spaces in Cairo. It has 8 parks, 7 of which are at al-Zamalek Island.In general, most of Cairo’s public parks are divided between its southern and easternregions with 18 and 16 parks respectively. However, 5 out of 11 districts in the southern region and 3 districts out of the 9 districts of the eastern region do not have anyPage 9 of 23
Aly and Dimitrijevic Journal of Engineering and Applied Science(2022) 69:15Fig. 5 Distribution of main public parks in Cairopublic parks. Districts like al-Matariya, al-Marg, Dar al-Salam, Tora and Monshat Nasrthat have close to zero green spaces do not have any public parks either.According to Swanwick et al.’s [26] hierarchy of public parks8 (Fig. 6), most publicparks in Cairo, 20 out of 54, have an area between 12,000 and 40,000 m2. The second8For the detailed data of the categories of public parks in Cairo, check Table 4 in the Supplementarymaterials.Page 10 of 23
Aly and Dimitrijevic Journal of Engineering and Applied Science(2022) 69:15Fig. 6 Categorisation of public parks in Cairo according to their areahighest category in the number of public parks has parks even smaller in area (less thanor equal to 12,000 m2). 18 parks lie in this category, including a park as small as 2000m2. In general, Cairo has few large parks, 7 with an area larger than 80,000 m2 and 9between 40,000 and 80,000 m2. The largest parks in Cairo are the 300,000 m2 al-Azharpark, al-Dawilya Park and the currently closed Merryland Park which both have an areaof 210,000 m2.Page 11 of 23
Aly and Dimitrijevic Journal of Engineering and Applied Science(2022) 69:15DiscussionContinuous loss of green spaces in CairoBased on the data published by al-Zafarany [4], the calculated individual share of greenspaces for the year 2000 was 0.98 m2/individual. This is different from what he mentioned in his article as he estimated the individual share to be 1.5 m2/individual. His estimation is higher because he included youth centres, sports clubs and added part ofthe Nile surface. In 2005 al-Azhar park was established at Wasat al-Qahira District andadded a significant area of 300,000 m2 to the green spaces of the city. This contributedto slightly enhancing the individual share of green spaces. In 2006, the individual shareof green spaces increased to 1.18 m2/individual. It decreased in 2017 to be 0.87 m2 andcontinued to decrease to reach 0.74 m2/individual in 2020. By the year 2020, Cairo haslost 2,128,280 m2 of green spaces compared to 2006. 910,894 m2 were lost in the threeyears between 2017 and 2020.Cairo kept losing green spaces without any major new additions. The resultant overalltrend is a decrease in the total area of green spaces and an increase in population numberwhich together led to the decrease in the individual share of green spaces (Fig. 7). Overthe years and even in the highest recorded estimations, Cairo has always had an individualshare of green spaces far less than the international recommended standards, for example,9 m2/individual as suggested by the World Health Organization [21]. It is even less thanthe minimum local standards for existing cities as suggested by the National Organizationfor Urban Harmony (NOUH) which are 7 m2/individual and 5 m2/individual for the NileValley cities and desert cities respectively [28]9.Also, disparities between districts did not change over the years showing that no efforts or interventions were made to enhance the situation. Districts with the lowest andhighest individual share of green spaces remained almost the same. However, some districts with the highest individual share lost a significant amount of their green spaces.For example, Misr al-Qadima had a slight increase in its residents' share in 2006 (3.32m2) and decreased again below its value in 2000 (2.77 m2) to reach 1.72 m2 in 2017and 1.35 m2 in 2020. Wasat al-Qahira, on the other hand, witnessed a major transformation in the year 2006 because of the establishment of al-Azhar Park. The individualshare of green spaces increased from 0.23 m2 in 2000 to 3.09 m2 in 2006. It slightly increased again in 2017 to reach 3.37 m2 and fall to 3.22 m2 in 2020.In Heliopolis, the individual share of green spaces dropped from its highest in 2006(6.38 m2) to 3.52 m2 in 2020. Heliopolis Heritage Initiative documented the loss ofgreen spaces with an estimation of 390,000 m2 of lost green spaces between differentstreets and squares in the district [19]. Official data from CCBA shows a different valuefor lost green spaces, 272,274 m2 between the years 2017 and 2020, which is still a significant loss that contributed to the individual share of green spaces losing around twofifths of its value. East Nasr City also had its highest individual share in 2006 (4.89 m2)which declined in 2020 to be 1.69 m2. East Nasr City also lost 311,283 m2 of its greenspaces between 2017 and 2020 lowering the individual share of green spaces by 25%.Unequal distribution is found in public parks too despite reopening some closedCCBA green spaces to be used as public parks (the DG category which added 16 public9The NOUH standards are for open spaces not only green spaces which can include sports and youth clubsand schools, etc. However, to fulfil the standards, their areas should not count for more than half the totalarea calculated for open spaces. Private gardens and open spaces cannot be included.Page 12 of 23
Aly and Dimitrijevic Journal of Engineering and Applied Science(2022) 69:15Fig. 7 Individual share of green spaces in Cairoparks to Cairo over the years). The standards published by the NOUH mention thateach district should have a district park of at least 21,000 m2 and that each residentshould access a public green space of at least 12,600 m2 within 1 km from their homes.The uneven distribution of green spaces and public parks around the city does notallow such access for most of Cairo’s residents. Also, 16 districts out of 37 in Cairohave no public parks and the area of 27 out of 54 its parks is less than 21,000 m2.Despite the obvious lack of green spaces in Cairo, the existing ones with their limitedareas are often under threat. That is because green spaces have always been the firstvictim of urbanisation and infrastructure projects. Projects to widen roads or build vehicle bridges are given priority over protecting green spaces. Examples of these projectswere the construction of the 6th of October bridge, al-Azhar tunnel and widening ofRamses Street. Also, green spaces can often be sacrificed easily to build new serviceand administrative buildings like the loss in areas in al-Azbakiya, and al-Zohryia Parks[3, 5], and other green spaces in Cairo (Fig. 8). Giving priority to other projects overgreen spaces indicates a lack of awareness of their importance and the harmful impactthat would result from removing them. More recently, this practice has continued andmajor road infrastructure projects have been established in Cairo destroying many ofits green spaces especially in Heliopolis and Nasr City as mentioned earlier (Figs. 9, 10and 11).Losing green spaces can have major harmful effects on any district and the wellbeingof its residents. A general decline in the quality of life in Heliopolis district, for example, was reported due to the loss of green spaces. Environmental and visual qualityhas declined which is worsened by bridges always interrupting visual continuity, thequality of sidewalks has decreased and crossing the roads for pedestrians became lesssafe [8]. A significant increase in traffic accidents was recorded shortly after those developments. Sidewalks also lost shade which is an important factor for walkability dueto the cutting and uprooting of trees [6].Infrastructure projects currently dominate the scene in Cairo and keep finding theirway to more of its districts. New projects have been recently announced at al-Nozhaand al-Maadi districts that are expected to change the fabric of another two districtsPage 13 of 23
Aly and Dimitrijevic Journal of Engineering and Applied Science(2022) 69:15Fig. 8 Change in a green space at al-Abbasiya Square, al-Waily District, Map data 2021 Googleknown for their green spaces. Social media users frequently document the actual orintentional destruction of green spaces and the cutting of trees in different streets inCairo. Recent images showed, for example, partial demolitions and construction workbeing carried out at several parks and nurseries. The final status of these interventionsis still not known but if they went through, Cairo would lose at least an additional124,236 m2: 91,920 m2 at al-Waily district alone (around half the district’s green spacesand total area of Arab al-Mohamdy and al-Waily parks that were handed over fromCCBA to Ain Shams University to be part of its Faculty of Medicine campus), additional 23,100 m2 at Heliopolis (area of Heliopolis CCBA Nursery) and 9,216 m2 at AinShams (area of Gesr al-Suez Park and one of only two public parks in the district). Thisis in addition to other green spaces and trees that are expected to be lost at al-Maadiand al-Nozha.
cording to CCBA data, the agency divides green spaces into six categories: 1) public parks, 2) main axes green spaces, 3) self-efforts green spaces, 4) nurseries, 5) Distinctive Gardens (DG) and 6) Specialised Gardens (SG) (Table 1). Green spaces categories adopted by CCBA are different from the common categories found in literature.