Transcription
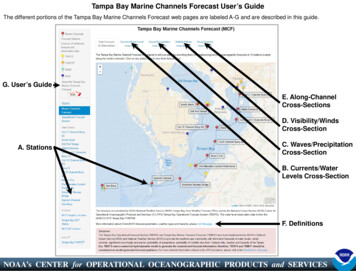
Tampa Bay Marine Channels Forecast User’s GuideThe different portions of the Tampa Bay Marine Channels Forecast web pages are labeled A-G and are described in this guide.G. User’s GuideE. Along-ChannelCross-SectionsD. Visibility/WindsCross-SectionA. StationsC. Waves/PrecipitationCross-SectionB. Currents/WaterLevels Cross-SectionF. DefinitionsNOAA’s CENTER for OPERATIONAL OCEANOGRAPHIC PRODUCTS and SERVICES
A. StationsThe Tampa Bay Marine Channels Forecast provides data at 13 locations (redpins). The 13 locations were strategically chosen for their position along themarine channels. They extend from the mouth of Tampa Bay (Sea Buoy) to thePort of Tampa (Cut “C” Channel Buoy 28). The data at each location can beaccessed by either clicking on the name on the left-hand menu or by clicking onthe red pin or label on the map.Station PagesClicking on a station name, pin or label will open a station page. Each stationpage has two tabs: a Plots Tab (shown left) and a Data Tab (shown below).The Plots Tab contains time series graphics of water levels, winds, currents,significant wave height, probability of precipitation and probability of visibility ofless than one statute mile. Each time series extends out for 24 hours. When theuser places the mouse over the plot, a small pop-up will appear with the forecastvalue and any available additional information.The Data Tab contains a table, or chart, listing the same forecast data shown inthe time series (water levels, winds, currents, significant wave height, probabilityof precipitation andprobability ofvisibility of less thanone statute mile) aswell as the weatherforecast (showers,or fog, for example)and marine hazards(hurricane watch, ortropical stormwarning, forexample). The tablelists the forecastsfor the following 24hours.NOAA’s CENTER for OPERATIONAL OCEANOGRAPHIC PRODUCTS and SERVICES
B. Currents/Water Levels Cross-SectionThe Currents/Water Levels Cross-Section Tabcontains four graphics.On the left-hand side, there are two alongchannel cross-sections. These are crosssections which indicate either the currents orthe water level forecast along the marinechannels from the entrance of the bay (SeaBuoy) to the Port of Tampa (Cut “C” ChannelBuoy 28). See next page for a detailedexplanation and example of an along-channelcross-section. When the user places themouse over the plot, a small pop-up will appearwith the forecast value and any availableadditional information.On the right-hand side, there are two map-viewgraphics depicting either currents or waterlevels forecasts throughout the Tampa Bayregion.The top two graphics are for currents and thebottom two graphics are for water levels.The user has the option of advancing orreversing through 24-hours of graphics byclicking on the Previous Hour or Next Hourbutton located above the four graphics. Byclicking on Start Animation, the user can viewthe next 24 hours of graphics as they advanceautomatically.NOAA’s CENTER for OPERATIONAL OCEANOGRAPHIC PRODUCTS and SERVICES
Along-Channel CrossSectionsThe Tampa Bay Marine ChannelsForecast is designed to aid local pilotsby providing them with meteorologicaland oceanographic forecasts at 13locations along the marine channels.Ten of the 13 locations are included inthe along-channel cross-sections whichindicate the forecast conditions alongthe marine channels from the entranceof the bay (Sea Buoy) to the Port ofTampa (Cut “C” Channel Buoy 28).The graphic shown on the left indicateshow the along-channel cross-sectionsdisplay the forecast conditions alongthe marine channels.The various along-channel crosssections along with correspondingmap-view graphics are accessed byclicking on the second through fourthtabs located above the map. The fifthtab contains all the along-channelcross-sections, allowing the pilots toview the changing conditions for allforecast parameters along the marinechannels.NOAA’s CENTER for OPERATIONAL OCEANOGRAPHIC PRODUCTS and SERVICES
C. Waves/Precipitation Cross-SectionThe Waves/Precipitation Cross-Section Tabcontains four graphics.On the left-hand side, there are two alongchannel cross sections. The cross-sectionsindicate either the probability of precipitation orthe significant wave height forecast along themarine channels. See previous page for adetailed explanation and example of an alongchannel cross-section. When the user placesthe mouse over the plot, a small pop-up willappear with the forecast value and anyavailable additional information.On the right-hand side, there are two map-viewgraphics depicting either wave period orsignificant wave height forecasts throughoutthe Tampa Bay region.The top-left graphic is for the probability ofprecipitation, the top-right graphic is for waveperiod and the bottom two graphics are forsignificant wave height.The user has the option of advancing orreversing through 24-hours of graphics byclicking on the Previous Hour or Next Hourbutton located above the four graphics. Byclicking on Start Animation, the user can viewthe next 24 hours of graphics as they advanceautomatically.NOAA’s CENTER for OPERATIONAL OCEANOGRAPHIC PRODUCTS and SERVICES
D. Visibility/Winds Cross-SectionThe Visibility/Winds Cross-Section Tabcontains four graphics.On the left-hand side, there are two alongchannel cross sections. The cross-sectionsindicate the probability of visibility less than onestatute mile or the winds forecast along themarine channels. When the user places themouse over the plot, a small pop-up will appearwith the forecast value and any availableadditional information.On the right-hand side, there are two map-viewgraphics depicting either the probability ofvisibility less than one statute mile or the windsforecasts throughout the Tampa Bay region.The top two graphics are for probability ofvisibility less than one statute mile and thebottom two graphics are for winds.The user has the option of advancing orreversing through 24-hours of graphics byclicking on the Previous Hour or Next Hourbutton located above the four graphics. Byclicking on Start Animation, the user can viewthe next 24 hours of graphics as they advanceautomatically.NOAA’s CENTER for OPERATIONAL OCEANOGRAPHIC PRODUCTS and SERVICES
E. Along-Channel Cross-SectionsThe Along-Channel Cross-Sections Tabcontains six graphics.The graphics are all the along-channel crosssections. When the user places the mouseover the plot, a small pop-up will appear withthe forecast value and any available additionalinformation.The along-channel cross-sections are waterlevels, winds, currents, significant wave height,probability of precipitation and probability ofvisibility of less than one statute mile. The firstthree are shown left.The user has the option of advancing orreversing through 24-hours of graphics byclicking on the Previous Hour or Next Hourbutton located above the four graphics. Byclicking on Start Animation, the user can viewthe next 24 hours of graphics as they advanceautomatically.NOAA’s CENTER for OPERATIONAL OCEANOGRAPHIC PRODUCTS and SERVICES
E. Along-Channel Cross-Sections(continued)The remaining three along-channel crosssections (significant wave height, probability ofprecipitation and probability of visibility of lessthan one statute mile) are shown left.NOAA’s CENTER for OPERATIONAL OCEANOGRAPHIC PRODUCTS and SERVICES
F. DefinitionsMore information aboutNOAA/NWS forecast parameters,weather types and hazards can befound here. The information isdivided into three tables. The firsttable contains the scientific units,definitions and sources of thevarious NWS forecast parametersdisplayed on this site. The secondtable contains the definitions ofvarious weather types that theNWS forecasts. Not all weathertypes are necessarily forecasted inthe Tampa Bay marine channels;however for completion, mosttypes of weather are defined here.The third table contains thedefinitions of the various hazardsthat the NWS forecasts. Theseinclude coastal flood warnings,frost advisories, and severethunderstorm watches. Not allhazards are forecasted in theTampa Bay marine channels;however for completion, mosttypes of hazards are defined here.G. Tampa Bay MarineChannels User’s GuideThe User’s Guide can be accessedby clicking the link located belowthe legend on the left-hand side.NOAA’s CENTER for OPERATIONAL OCEANOGRAPHIC PRODUCTS and SERVICES
The Tampa Bay Marine Channels Forecast provides data at 13 locations (red pins). The 13 locations were strategically chosen for their position along the marine channels. They extend from the mouth of Tampa Bay (Sea Buoy) to the Port of Tampa (Cut "C" Channel Buoy 28). The data at each location can be