Transcription
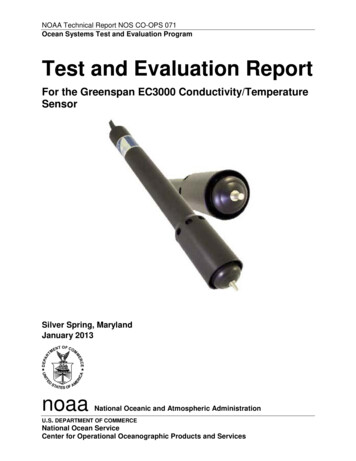
NOAA Technical Report NOS CO-OPS 071Ocean Systems Test and Evaluation ProgramTest and Evaluation ReportFor the Greenspan EC3000 Conductivity/TemperatureSensorSilver Spring, MarylandJanuary 2013noaaNational Oceanic and Atmospheric AdministrationU.S. DEPARTMENT OF COMMERCENational Ocean ServiceCenter for Operational Oceanographic Products and Services
Department of CommerceNational Oceanic and Atmospheric AdministrationNational Ocean ServiceCenter for Operational Oceanographic Products and ServicesThe National Ocean Service (NOS) Center for Operational Oceanographic Products and Services(CO-OPS) provides the National infrastructure, science, and technical expertise to collect anddistribute observations and predictions of water levels and currents to ensure safe, efficient andenvironmentally sound maritime commerce. The Center provides the set of water level and tidalcurrent products required to support NOS’ Strategic Plan mission requirements and to assist inproviding operational oceanographic data/products required by NOAA’s other Strategic Planthemes. For example, CO-OPS provides data and products required by the National WeatherService to meet its flood and tsunami warning responsibilities. The Center manages the NationalWater Level Observation Network (NWLON), a national network of Physical OceanographicReal-Time Systems (PORTS ) in major U.S. harbors, and the National Current ObservationProgram, consisting of current surveys in near shore and coastal areas utilizing bottom mountedplatforms, subsurface buoys, horizontal sensors and quick response real-time buoys. The Center:establishes standards for the collection and processing of water level and current data; collectsand documents user requirements which serve as the foundation for all resulting programactivities; designs new and/or improved oceanographic observing systems; designs software toimprove CO-OPS’ data processing capabilities; maintains and operates oceanographic observingsystems; performs operational data analysis/quality control; and produces/disseminatesoceanographic products.Ocean Systems Test & Evaluation ProgramThe CO-OPS Ocean Systems Test and Evaluation Program (OSTEP) facilitates the transition ofnew technology to an operational status, selecting newly developed sensors or systems from theresearch and development community and bringing them to a monitoring setting. OSTEPprovides quantifiable and defensible justifications for the use of existing sensors and methods forselecting new systems. The program establishes and maintains field reference facilities where, incooperation with other agencies facing similar challenges, devices are examined in a nonoperational field setting. Through OSTEP, sensors are evaluated, quality control proceduresdeveloped, and maintenance routines generated. The quality of the reference systems used in thefield is assured by both rigorous traceable calibrations and redundant sensors.
NOAA Technical Report NOS CO-OPS 071Ocean Systems Test and Evaluation ProgramTest and Evaluation ReportGrace GrayRobert HeitsenretherJanuary 2013U.S. DEPARTMENT OF COMMERCEPenny Pritzker, SecretaryNational Oceanic and Atmospheric AdministrationDr. Kathryn Sullivan, NOAA Administrator and Under Secretary of Commerce forOceans and AtmosphereNational Ocean ServiceHolly Bamford, Assistant AdministratorCenter for Operational Oceanographic Products and ServicesRichard Edwing, Director
NOTICEMention of a commercial company or product does not constitute anendorsement by NOAA. Use of information from this publication forpublicity or advertising purposes concerning proprietary products orthe tests of such products is not authorized.i
iii
Table of ContentsList of Figures . vList of Tables . viAcknowledgements. viiExecutive Summary . ix1.0Introduction/Background . 11.1Sensor Descriptions . 12.0Laboratory Test Results . 32.1Standard Solution Tests . 32.2.Seawater Bath Tests . 83.0Field Test Results . 133.1.Money Point NWLON Station. 133.2CBIBS Buoy . 214.0Recommendations for Refining CO-OPS’ Conductivity and TemperatureAccuracy Requirements . 295.0Summary and Recommendations . 33References . 35List of Appendices . 36Appendix A.Laboratory Notes . A-1Appendix B.Money Point Conductivity and Temperature Time-Series Plots(February – April 2012) . B-1Appendix C.CBIBS 1-Hz Conductivity and Temperature Plots . C-1Acronyms and Abbreviationsiv
Ocean Systems Test and Evaluation ProgramList of FiguresFigure 1.Figure 2.Figure 3.Figure 4.Figure 5.Figure 6.Figure 7.Figure 8.Figure 9.Figure 10.Figure 11.Figure 12.Figure 13.Figure 14.Figure 15.Figure 16.Figure 17.Figure 18.Greenspan CT sensor in conductivity calibration standard solution. . 4In figs 2-5, a time series of raw conductivity values (0.9 Hz for FSI and 1 Hz forGreenspan) was averaged every 10 min for each calibration standard solution test.The raw (non-normalized) values of the calibration standard were calculated usingthe data from the external thermometer and also averaged every 10 min. The averagecalibration standard solution values were subtracted from the average sensor values;the differences between the sensor average values and the black line at zero representthe difference between each sensor and the value of the calibration standard solution. 5Mean difference between instrument and calibration standard solution at 12.890mS/cm. 6Mean difference between instrument and calibration standard solution at 15.000mS/cm. 6Mean difference between instrument and calibration standard solution at 58.670mS/cm. 7A summary plot of the conductivity differences between each sensor and the raw(normalized) conductivity calibration standard solution for each test. The rawconductivity values were calculated using the external thermometer data from eachtest and are shown in red along the x-axis. . 7Scatter plots of the sensor conductivity averaged over each test compared to the rawconductivity of the standard solutions. . 8a) Seawater test bath at CO-OPS’ Chesapeake Instrument Lab. b) Plastic spheresused to prevent evaporation. . 9Time series plots of the seawater test bath comparison. . 10Time series plots of the seawater test bath comparison with the addition of ice. . 11NWLON station at Money Point, Virginia. Locations for a potential new CT well areindicated. . 14Diagram shows the measured water level and distance to seafloor. . 14White Delrin clamp attached to the Greenspan EC3000 CT sensor. . 15(A) CO-OPS personnel install the bottom bracket of the Money Point test CT wellfrom a floating dock. (B) Installation of the Greenspan sensor into the top of the CTwell from the pier. . 16Sample time series of conductivity data collected during January 2012 at MoneyPoint, Virginia NWLON station. . 17Sample time series of temperature data collected during January 2012 at MoneyPoint, Virginia NWLON station. . 18Conductivity histograms showing differences between Greenspan and FSI at MoneyPoint, Virginia NWLON. . 19Temperature histograms showing differences between Greenspan and FSI at MoneyPoint, Virginia NWLON. . 19v
Figure 19. Conductivity scatter plots of FSI versus Greenspan at Money Point, VirginiaNWLON. . 20Figure 20. Temperature scatter plots of FSI versus Greenspan at Money Point, VirginiaNWLON. . 21Figure 21. Norfolk CBIBS buoy. Insets show Greenspan (left) and Sea-Bird (right) positionedin mounting brackets. Due to mounting constraints, the Greenspan and Sea-Birdsensors measured conductivity approximately 22 in and 12 in, respectively, belowthe water surface. . 22Figure 22. Greenspan (left) and Sea-Bird (right) sensors upon recovery. . 23Figure 23. Conductivity time series of Greenspan and Sea-Bird on CBIBS buoy. . 24Figure 24. Temperature time series of Greenspan and Sea-Bird on CBIBS buoy. . 25Figure 25. Conductivity histogram showing differences between Greenspan and Sea-Bird onCBIBS buoy. . 25Figure 26. Temperature histogram showing differences between Greenspan and Sea-Bird onCBIBS buoy. . 26Figure 27. Conductivity scatter plot of Sea-Bird versus Greenspan on CBIBS buoy. . 27Figure 28. Temperature scatter plot of Sea-Bird versus Greenspan on CBIBS buoy. . 28List of TablesTable 1.Table 2.Table 3.Table 4.Table 5.Table 6.Conductivity standard solutions used in laboratory tests with corresponding salinityvalues at 25 C. 3Mean differences between sensors and conductivity standard solution (sensor valueminus solution value) and between sensors and reference thermometer (sensor valueminus thermometer value). . 5Accompanying information and calculations for fig. 12. . 15Published conductivity accuracies for CT sensors and calibration standards. . 29Resulting values of various parameters (salinity, density, specific gravity) in a lowsalinity environment, calculated using a range of conductivity and temperatureinputs (see legend below table 5) associated with each sensor's published accuracies. 31Resulting values of various parameters (salinity, density, specific gravity) in a highsalinity environment, calculated using a range of conductivity and temperatureinputs (see legend below table 6) associated with each sensor's published accuracies. 31vi
Ocean Systems Test and Evaluation ProgramAcknowledgementsThe authors would like to acknowledge CO-OPS personnel for assistance with the design andinstallation of the field test system at Money Point, including John Stepnowski, Warren Krug,Albert Sanford, Chris Haith, Scott Mowery, and Winston Hensley.Thanks to Zhong Li and Sudha Sundar from CO-OPS/ISD, who provided valuable informationabout CO-OPS’ calculations of salinity and specific gravity on the PORTS Web page.Also, special thanks to Doug Wilson and Eric Stengel from NOAA’s Chesapeake Bay Office andMark Bushnell from Tellus Applied Sciences for coordinating and assisting with the GreenspanCT sensor installation on the Norfolk CBIBS buoy.vii
Executive SummaryThe National Oceanic and Atmospheric Administration (NOAA) National Ocean Service (NOS)Center for Operational Oceanographic Products and Services (CO-OPS) maintains a suite ofconductivity/temperature (CT) sensors on a select number of its National Water LevelObservation Network (NWLON) and Physical Oceanographic Real-Time (PORTS ) stations.The data from these sensors can be used to calculate water salinity and density, which areimportant tools for safe navigation, especially in the determination of ship draft.Most CT sensors used on CO-OPS stations are manufactured by Falmouth Scientific,Incorporated (FSI). In a continued effort to explore evolving technology and to expand the suiteof instruments available for operational use in its observatories, CO-OPS selected the GreenspanEC3000 CT sensor for test and evaluation. Before an instrument can be approved for operationon a CO-OPS platform, it must first undergo testing by CO-OPS’ Ocean Systems Test andEvaluation Program (OSTEP). OSTEP designed a series of laboratory and field tests to evaluatethe performance of the Greenspan sensors under a variety of conditions.In one round of laboratory tests, both the FSI and Greenspan sensors were comparedindependently to a range of conductivity calibration standard solutions. In a second round oftests, the two sensors were tested concurrently in CO-OPS’ seawater test bath facility.In the first of two field tests, a Greenspan CT sensor was deployed at the Money Point, VirginiaNWLON station; data from the instrument were compared to the operational FSI CT sensor at thatlocation. In the second field test, a Greenspan CT sensor was deployed on a NOAA ChesapeakeBay Interpretive Buoy System platform and compared to a Sea-Bird SBE-52 CT sensor.In laboratory tests with conductivity calibration standards, the Greenspan results were moreclosely aligned with the standard solutions than the FSI results. However, several laboratory testdesign details were not ideal for the FSI, including the likelihood that the test container was toosmall for the sensor. The Greenspan and FSI conductivity and temperature readings were withinmanufacturer specifications during the seawater bath tests, even though results revealed possibleissues due to edge interference and tank stratification. Improvements to the laboratory facility,such as a higher quality reference CT sensor, have been recommended.During field tests, the Greenspan compared more favorably to the FSI in conductivity (-0.01versus -0.2 mS/cm) and more favorably to the Sea-Bird in temperature (-0.03 versus -0.4 C).Some configuration problems were encountered with the Greenspan that delayed the test andevaluation schedule. However, representatives from Greenspan worked with OSTEP personnelto resolve these issues. As a result, the Greenspan CT sensor can now be integrated with a SutronXpert Data Collection Platform in an operational real-time CO-OPS observatory.Overall, Greenspan EC3000 data have compared very well with the data from the FSI and SeaBird. Based on test results reported here, the Greenspan EC3000 is recommended for use atoperational CO-OPS observatories.ix
Ocean Systems Test and Evaluation Program1.0 Introduction/BackgroundThe National Oceanic and Atmospheric Administration (NOAA) National Ocean Service (NOS)Center for Operational Oceanographic Products and Services (CO-OPS) has usedconductivity/temperature (CT) sensors on a select number of National Water Level ObservationNetwork (NWLON) and Physical Oceanographic Real-Time (PORTS ) stations since 1991.There are now 20 CT sensors in operation at CO-OPS stations; the data from these sensors areused to calculate water salinity and specific gravity (relative density), which are important toolsfor safe navigation, especially in the determination of ship draft.Before an instrument can be used operationally, it must undergo testing by CO-OPS’ OceanSystems Test and Evaluation Program (OSTEP). CO-OPS/OSTEP chose the TycoEnvironmental Systems Greenspan EC3000 SDI-12 CT sensors for testing, not only becausethey are a less expensive and potentially reliable replacement for Falmouth Scientific,Incorporated (FSI) sensors that transition out of operation for servicing and repair, but alsobecause Greenspan CT sensors have been used operationally in CO-OPS’ systems.An analog version of the Greenspan CT sensor (EC250) was tested and evaluated by OSTEP in2006. The sensor performed well, and several sensors were put into operation for a time. Whenthe CO-OPS Chesapeake Instrument Laboratory (CIL) switched to a new version of the SutronData Collection Platform (DCP), compatibility issues were encountered with the GreenspanEC250. As a result, the sensors were removed from operation and have not been used since 2008.Evaluations conducted by the Alliance for Coastal Technologies (ACT) were reviewed as part ofthe necessary background research for the EC3000 when OSTEP was developing its test andevaluation plan. ACT is a partnership of research institutions, resource managers, and privatesector companies that conducts independent testing of freshwater, coastal, and oceanographicsensors. The Greenspan EC3000 was tested by ACT as part of its Salinity Sensor PerformanceDemonstration and Verification between May and October 2008 [1]. The instrument performedfavorably in laboratory tests, with conductivity accuracies of 0.1306 mS/cm ( 0.0892 mS/cm)and temperature accuracies of 0.0935 C ( 0.1377 C) relative to the reference samples. Thefield tests were less successful, largely due to bio-fouling (evidenced by measurements takenbefore and after cleaning the instrument) and software issues that resulted in data loss.When developing the test plan for this project [2], OSTEP assumed that CO-OPS’ requiredaccuracies for CT sensors were 0.1 mS/cm. It was later discovered that these values wereactually manufacturer-published accuracies for the FSI. Therefore, OSTEP seeks to better definean acceptable level of accuracy for CO-OPS CT sensors based on user applications. Furtherdiscussion of this endeavor is provided in section 4 of this report.1.1Sensor DescriptionsThree different CT sensors were used during this test and evaluation. The Greenspan and FSI aretoroidal sensors, and the Sea-Bird is an electrode sensor. Toroidal sensors measure the electrical1
Ocean Systems Test and Evaluation Programconductivity of water using two wire coils. An electrical current is introduced in one coil and anelectromagnetic field that surrounds the adjacent coil is generated. The coils are now inductivelycoupled, and the current flow between them is proportional to the conductance of thesurrounding water [3, 4]. The main benefit of a toroidal system is its robustness and resistance tobio-fouling, while its main drawback is the partly external nature of the electromagnetic field,which leads to interference issues if deployed too closely to nearby objects. Electrode sensorsmeasure the current flow between internal electrodes; this measurement is proportional to thesurrounding seawater. Electrode sensors’ electromagnetic fields are mostly internal, but Sea-Birdsensors are the only ones that are fully contained due to their unique electrode design [5]. Thishighly accurate sensor also has effective anti-fouling measures in place.Greenspan EC3000The Greenspan EC3000, like the FSI, is a toroidal sensor. As previously mentioned, a probleminherent to this type of sensor is that nearby objects such as pilings or other mounting structurestend to interfere with the electromagnetic field. Greenspan has avoided this problem byintroducing a simple shroud, which is a cap that screws on to the end of the sensor over thetoroidal sensing cell and contains the electromagnetic field. The shroud is open at the bottom andhas holes in the top to allow water to flow to the toroidal sensing cell [4]. This sensor is capableof both RS232 and SDI-12 communications and can operate using either internal battery powerand recording or external AC power and a DCP.FSI OEM DigitalThe FSI OEM Digital CT sensor has been a CO-OPS standard for many years. Its ruggedconstruction and reliable RS232 communications have made it a key element of many NWLONand PORTS stations.Sea-Bird SBE 52The Sea-Bird CT used in this test and evaluation is part of a WET Labs WQM, a sensor suite thatmeasures multiple water quality parameters. This sensor is externally powered and communicatesvia the RS232 interface.2
Ocean Systems Test and Evaluation Program2.0 Laboratory Test ResultsOSTEP designed a series of laboratory and field tests to evaluate the performance of theGreenspan CT sensors under a variety of conditions. The first set of laboratory tests involvedcomparing the measurement accuracy of both a Greenspan and FSI CT sensor to conductivitystandard solutions, which are chemical solutions containing a precisely known concentration of aparticular substance. In this case, potassium chloride was used to create a solution with a knownconductivity at a specific temperature and then used as a basis of comparison.The second set of laboratory tests was performed in a seawater test bath at the CO-OPSChesapeake, Virginia facility. The seawater test bath is used routinely by the CIL to check theaccuracy of an instrument before and after field deployments.The FSI has the option of outputting only raw conductivity values, whereas the Greenspanprovides a choice of using either raw conductivity or normalized conductivity (i.e., conductivitynormalized to 25 C, or specific conductance). In this OSTEP test series, all reported sensorconductivity values are raw values; the standard solution values, however, were calculated toaccount for variation in temperature on each CT sensor’s thermistor during the standard solutiontests (since the tests were not conducted at 25 C). This calculation was performed on thestandard solution values so that raw values from the sensors were being compared directly tocalculated raw values of the standard solutions.2.1Standard Solution TestsMethodsEach instrument was allowed to equilibrate in a beaker of standard solution while conductivityand temperature data were being collected and recorded. The following concentrations ofconductivity standard solutions were used: 1.413 mS/cm, 12.890 mS/cm, 15.000 mS/cm, and58.670 mS/cm. The three higher-concentration standards cover the span of salinities expected inthe field, and testing with the lower concentration provides evidence of the sensor’s capability todetect very small traces of salinity. Table 1 shows the salinity values associated with theseconductivity values at 25 C.Table 1. Conductivity standard solutions used in laboratory tests with correspondingsalinity values at 25 C.Conductivity (mS/cm)Corresponding Salinity (PSU) at 25 C1.4130.712.8907.415.0008.758.67039.2Conductivity standard solutions were poured into 1000-mL glass containers (height: 14.48 cm[5.7 in]; diameter: 10.41 cm [4.1 in]). Each sensor was placed in a beaker of new solution and3
Ocean Systems Test and Evaluation Programallowed to equilibrate for at least 1 hour (h) (the instrument was collecting and recording dataduring this time). Raw conductivity values are nearly instantaneous, whereas temperature valuesneed to equilibrate for 1 h [4]. In order to compare raw conductivity sensor values to theconductivity standard solution values, the standard solution value needs to be converted to a rawvalue (the published standard values are normalized to 25 C). This conversion requires anaccurate temperature measurement. Alternatively, the raw conductivity sensor values can benormalized to 25 C, a process that also requires an accurate temperature measurement.The laboratory calibration tests were carried out in two separate rounds. Given the limitedcontainer size, only one instrument could be tested at a time. In round one, the Greenspan wasfirst placed into the fresh calibration standard solution (fig. 1). Following the period ofequilibration (approximately 15 min) and data collection (approximately 30 min), the Greenspanwas removed and the FSI was immediately placed in the solution. To confirm that there was nobias toward the first instrument placed in solution (from evaporation, for example), theGreenspan was placed back in solution during several different tests to ensure that its results hadnot drifted after the first test.Figure 1. Greenspan CT sensor in conductivity calibration standardsolution.Results presented in the following section are from tests conducted during round two, after thetesting process had been further refined. (See appendix A for laboratory notes for both rounds oftesting.) In round two, the FSI was the first sensor in solution; a different Greenspan EC3000(with internal battery pack) was used for testing. As in round one, tests were performed to ensurethat there was no bias against the second sensor in the solution. In round two, each instrumentcollected data for approximately 1.5 h. Since it is important for both the conductivity andtemperature to be measured accurately to ensure a correct salinity calculation, an externalthermometer (Hart Scientific 1502A with PRT 5614 probe) was also placed in the beaker duringthis round to test the operation of each instrument’s internal thermistor. The external4
Ocean Systems Test and Evaluation Programthermometer was also used to calculate the raw conductivity values of the calibration standardsolution.ResultsThe Greenspan sensor performed better than the FSI in the conductivity standard tests, stayingwithin its manufacturer-specified accuracies of 0.7 mS/cm (conductivity) and 0.2 C(temperature). Table 2 shows the mean difference between each sensor and theconductivity/temperature references for each of the four tests (shown graphically in 10-minaverages for conductivity in fig. 2 through fig. 5 and averaged over each test in fig. 6). Figure 7shows scatter plots of the sensor conductivity averaged over each test compared to the rawconductivity of the standard solutions.Table 2. Mean differences between sensors and conductivity standard solution (sensor value minus solution value)and between sensors and external thermometer (sensor value minus thermometer value).SensorFSIGreenspanTestsStandard SolutionTest1.413 mS/cmCond0.060.00Temp-0.09-0.11Standard SolutionTest12.890 mS/cmCond-0.61-0.21Temp-0.12-0.11StandardSolution Test15.000 mS/cmStandardSolution Test58.670 ure 2. In figs 2-5, a time series of raw conductivity values (0.9 Hz for FSI and 1 Hz forGreenspan) was averaged every 10 min for each calibration standard solution test. The raw (nonnormalized) values of the calibration standard were calculated using the data from the externalthermometer and also averaged every 10 min. The average calibration standard solution values weresubtracted from the average sensor values; the differences between the sensor average values and theblack line at zero represent the difference between each sensor and the value of the calibrationstandard solution.5Temp-0.10-0.13
Ocean Systems Test and Evaluation ProgramFigure 3. Mean difference between instrument and calibration standard solution at 12.890 mS/cm.Figure 4. Mean difference between instrument and calibration standard solution at 15.000 mS/cm.6
Ocean Systems Test and Evaluation ProgramFigure 5. Mean difference between instrument and calibration standard solution at 58.670 mS/cm.Figure 6. A summary plot of the conductivity differences between each sensor and the raw (normalized)conductivity calibration standard solution for each test. The raw conductivity values were calculatedusing the external thermometer data from each test and are shown in red along the x-axis.7
Ocean Systems Test and Evaluation ProgramFigure 7. Scatter plots of the sensor conductivity averaged over eachtest compared to the raw conductivity
providing operational oceanographic data/products required by NOAA's other Strategic Plan themes. For example, CO-OPS provides data and products required by the National Weather . In the second field test, a Greenspan CT sensor was deployed on a NOAA Chesapeake Bay Interpretive Buoy System platform and compared to a Sea-Bird SBE-52 CT sensor.
