Transcription
NCSS Statistical SoftwareNCSS.comChapter 258C ChartsIntroductionThis procedure generates the C control chart for the number of nonconformities (defects) on a unit. The format ofthe control chart is fully customizable. This procedure permits the defining of stages. For the C chart, the valuefor C (the average number of nonconformities) can be entered directly or estimated from the data, or a sub-set ofthe data. A list of out-of-control points can be produced in the output, if desired.C Control ChartsC charts are used to monitor the number of nonconformities on a unit of a process based on units taken from theprocess at given times (hours, shifts, days, weeks, months, etc.). Typically, an initial series of units is used toestimate the average number of nonconformities of a process. The estimated value is then used to produce controllimits for the number of nonconformities. During this initial phase, the process should be in control. If points areout-of-control during the initial (estimation) phase, the assignable cause should be determined, and the unit shouldbe removed from estimation.Once the control limits have been established for the C chart, these limits may be used to monitor the number ofnonconformities (defects) of the process going forward. When a point is outside these established control limits itindicates that the number of nonconformities for a unit of the process is out-of-control. An assignable cause issuspected whenever the control chart indicates an out-of-control process.258-1 NCSS, LLC. All Rights Reserved.
NCSS Statistical SoftwareNCSS.comC ChartsThe C Chart versus the U ChartThe C chart is used when a single unit will be examined for nonconformities at each time point. The U chart isused when a number of units will be sampled at each time point, and a per unit average number ofnonconformities will be obtained.C Chart FormulasSuppose we have sampled k units, one at each time period. Let Di represent the number of nonconformities of theith unit.Formulas for the Points on the ChartEach point on the chart is given by Di, the number of nonconformities of the ith unit.Estimating the C Chart Center LineIn the C Charts procedure, the center line (average number of nonconformities) may be input directly, or it may beestimated from a series of units. If it is estimated from the units, the formula for the center line iskc Di 1ikC Chart LimitsThe lower and upper control limits for the C chart are calculated using the formulasLCL c m cUCL c m cwhere m is a multiplier (usually set to 3) chosen to control the likelihood of false alarms (out-of-control signalswhen the process is in control).Runs TestsThe strength of control charts comes from their ability to detect sudden changes in a process that result from thepresence of assignable causes. Unfortunately, the C chart is poor at detecting drifts (gradual trends) or small shifts inthe process. For example, there might be a positive trend in the last ten units, but until a number of nonconformitiesgoes above the upper control limit, the chart gives no indication that a change has taken place in the process.Runs tests can be used to check control charts for unnatural patterns that are most likely caused by assignablecauses. Runs tests are sometimes called “pattern tests”, “out-of-control” tests, or “zones rules”.While runs tests may be helpful in identifying patterns or smaller shifts in the proportion, they also increase thelikelihood of false positive indications. The rate of false positives is typically measured using the average runlength (the average length of a run before a false positive is indicated). When several runs tests are used theaverage run length of the control chart becomes very short.In order to perform the runs tests, the control chart is divided into six equal zones (three on each side of the centerline). Since the control limit is three sigma limits (three standard deviations of the proportion) in width, each zone258-2 NCSS, LLC. All Rights Reserved.
NCSS Statistical SoftwareNCSS.comC Chartsis one sigma wide and is labeled A, B, or C, with the C zone being the closest to the center line. There is a lowerzone A and an upper zone A. The same is true for B and C. The runs tests look at the pattern in which points fallin these zones.The runs tests used in this procedure are described below.Test 1: Any Single Point Beyond Zone AThis runs test simply indicates a single point is beyond one of the two three-sigma limits.Test 2: Two of Three Successive Points in Zone A or BeyondThis usually indicates a shift in the process average. Note that the two points have to be in the same Zone A,upper or lower. They cannot be on both sides of the center line. The third point can be anywhere.Test 3: Four of Five Successive Points in Zone B or BeyondThis usually indicates a shift in the process average. Note that the odd point can be anywhere.Test 4: Eight Successive Points in Zone C or BeyondAll eight points must be on one side of the centerline. This is another indication of a shift in the process average.Test 5: Fifteen Successive Points Fall in Zone C on Either Side of the CenterlineAlthough this pattern might make you think that the variation in your process has suddenly decreased, this isusually not the case. It is usually an indication of stratification in the sample. This happens when the samplescome from two distinct distributions having different means. Perhaps there are two machines that are setdifferently. Try to isolate the two processes and check each one separately.Test 6: Eight of Eight Successive Points Outside of Zone CThis usually indicates a mixture of processes. This can happen when two supposedly identical production linesfeed a single production or assembly process. You must separate the processes to find and correct the assignablecause.There are, of course, many other sets of runs tests that have been developed. You should watch your data fortrends, zig-zags, and other nonrandom patterns. Any of these conditions could be an indication of an assignablecause and would warrant further investigation.Issues in Using Control ChartsThere are several additional considerations surrounding the use of control charts that will not be addressed here.Some important questions are presented below without discussion. For a full treatment of these issues you shouldconsider a statistical quality control text such as Ryan (2011) or Montgomery (2013).Dealing with Out-of-Control PointsHow do you deal with out-of-control points once they have been detected? Should they be included or excluded inthe process estimate?Control Limit MultiplierThree-sigma limits are very common. When should one consider a value other than three?258-3 NCSS, LLC. All Rights Reserved.
NCSS Statistical SoftwareNCSS.comC ChartsStartup TimeHow many units should be used to establish control for my process?Data StructureIn this procedure, the data are entered in a single column. This column contains the number of nonconformities(defects) for each unit.Example datasetDefects14716842211151981013.258-4 NCSS, LLC. All Rights Reserved.
NCSS Statistical SoftwareNCSS.comC ChartsAttribute Chart Format Window OptionsThis section describes the specific options available on the Attribute Chart Format window, which is displayedwhen the Attribute Chart Format button is clicked. Common options, such as axes, labels, legends, and titles aredocumented in the Graphics Components chapter.Attribute Chart TabSymbols SectionYou can modify the attributes of the symbols using the options in this section.Lines SectionYou can specify the format of the various lines using the options in this section. Note that when shading isdesired, the fill will be to the bottom for single lines (such as the mean line), and between the lines for pairs oflines (such as primary limits).Titles, Legend, Numeric Axis, Group Axis, Grid Lines, and BackgroundTabsDetails on setting the options in these tabs are given in the Graphics Components chapter. The legend does notshow by default, but can easily be included by going to the Legend tab and clicking the Show Legend checkbox.258-5 NCSS, LLC. All Rights Reserved.
NCSS Statistical SoftwareNCSS.comC ChartsExample 1 – C Chart Analysis (Phase I)This section presents an example of how to run an initial C Chart analysis to establish control limits. In thisexample, the welding of large pipeline joints (as the pipeline extends) will be examined for nonconformities.Thirty-seven joints are examined to establish initial control of the process. The data used are in the Weld dataset.SetupTo run this example, complete the following steps:1Open the Weld example dataset From the File menu of the NCSS Data window, select Open Example Data. 2Select Weld and click OK.Specify the C Charts procedure options Find and open the C Charts procedure using the menus or the Procedure Navigator. The settings for this example are listed below and are stored in the Example 1 settings template. To loadthis template, click Open Example Template in the Help Center or File menu.OptionValueVariables TabNumber of Nonconformities Variable. Defects3Run the procedure Click the Run button to perform the calculations and generate the output.Estimation and Limit SectionEstimation and Limit Section for Rows 1 to 37 Number of Nonconformities Variable DefectsNumber ofUnits37Number ofNonconformities626Average # ofNonconformities16.91892 Nonconformities Limits Lower LimitUpper Limit4.57913529.258703This section displays the calculation values and limits that are to be used in the C chart. The formulas for eachcalculation are described in the C chart formula section toward the beginning of this chapter.Number of UnitsThis is the number of units that were examined for nonconformities.Number of NonconformitiesThis is the sum of all nonconformities across all units.Average Number of NonconformitiesThis is number of nonconformities divided by the number of units.Nonconformities LimitsThese are the lower and upper control limits for the C chart.258-6 NCSS, LLC. All Rights Reserved.
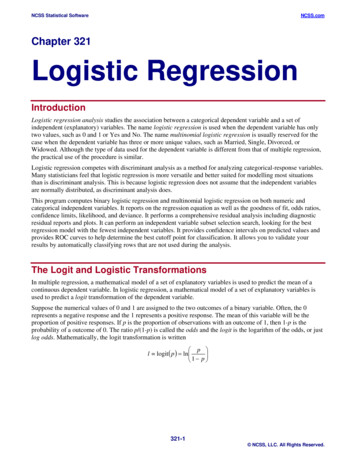
NCSS Statistical SoftwareNCSS.comC ChartsC ChartChart Section for Rows 1 to 37 The C chart shows the sequence of nonconformities for the joints. The chart show that joints 12 and 27 meritfurther investigation for an assignable cause. After reviewing the records, the investigators found that the 12thjoint was a different type of joint with more extensive welding than the others. The 27th joint had only a partialinspection due to difficult access to the joint. It is determined that these two units should be removed from theinitial C chart estimation phase (see Example 2).Out-of-Control ListOut-of-Control List for Rows 1 to 37 Row12131427Number ofNonconformities41.027.010.01.0Row Label12131427Reasonbeyond control limits2 of 3 in zone A2 of 3 in zone Abeyond control limitsThis report provides a list of the samples that failed one of the runs tests (including points outside the controllimits). The report shows that joints 12 and 27 are beyond the control limits. Joints 13 and 14 show runs in thedata, but they do seem to signal an important change in the process.258-7 NCSS, LLC. All Rights Reserved.
NCSS Statistical SoftwareNCSS.comC ChartsExample 2 – C Chart Revised (Phase I)This section presents a continuation of the previous example. In this example the limits are revised to exclude thedata from samples 12 and 27, due to assignable cause.SetupTo run this example, complete the following steps:1Open the Weld example dataset From the File menu of the NCSS Data window, select Open Example Data. 2Select Weld and click OK.Specify the C Charts procedure options Find and open the C Charts procedure using the menus or the Procedure Navigator. The settings for this example are listed below and are stored in the Example 2 settings template. To loadthis template, click Open Example Template in the Help Center or File menu.OptionValueVariables TabNumber of Nonconformities Variable. DefectsSpecification Method . Remove Rows VariableUse all rows except rows where . Removevariableequals . 13Run the procedure Click the Run button to perform the calculations and generate the output.258-8 NCSS, LLC. All Rights Reserved.
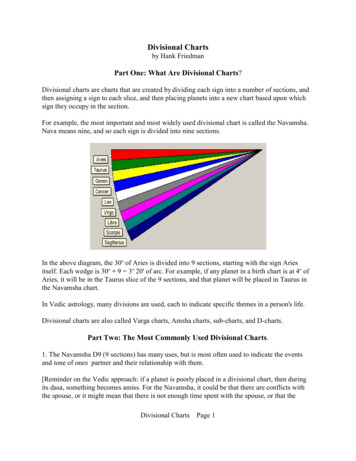
NCSS Statistical SoftwareNCSS.comC ChartsEstimation and Limit SectionEstimation and Limit Section for Rows 1 to 37 where Remove is not equal to 1 Number of Nonconformities Variable DefectsNumber ofUnits35Number ofNonconformities584Average # ofNonconformities16.68571 Nonconformities Limits Lower LimitUpper Limit4.43126928.940160Chart Section for Rows 1 to 37 Out-of-Control List for Rows 1 to 37 Row12131427Number ofNonconformities41.027.010.01.0Row Label12131427Reasonbeyond control limits2 of 3 in zone A2 of 3 in zone Abeyond control limitsThe limits in this report and chart are now based on all joints except joints 12 and 27. The number ofnonconformities for joints 12 and 27 are included in the chart, but they are not included in the calculations.Because two of the more extreme nonconformity counts were removed, the control limits are narrower than thoseof Example 1.The C chart can be additionally enhanced by labeling the points that were not included in the calculations. To dothis, set the Point Label Variable to Label.258-9 NCSS, LLC. All Rights Reserved.
NCSS Statistical SoftwareNCSS.comC ChartsChart Section for Rows 1 to 37 258-10 NCSS, LLC. All Rights Reserved.
NCSS Statistical SoftwareNCSS.comC ChartsExample 3 – C Chart Analysis (Phase II)Continuing with Examples 1 and 2, the investigators inspect an additional 25 joints. They wish to use the limitsbased on the first 37 joints, excluding joints 12 and 27.SetupTo run this example, complete the following steps:1Open the Weld example dataset From the File menu of the NCSS Data window, select Open Example Data. 2Select Weld and click OK.Specify the C Charts procedure options Find and open the C Charts procedure using the menus or the Procedure Navigator. The settings for this example are listed below and are stored in the Example 3 settings template. To loadthis template, click Open Example Template in the Help Center or File menu.OptionValueVariables TabNumber of Nonconformities Variable. DefectsContSpecification Method . Keep Rows VariableUse all rows where variable . Keepequals . 1Point Label Variable . Label3Run the procedure Click the Run button to perform the calculations and generate the output.258-11 NCSS, LLC. All Rights Reserved.
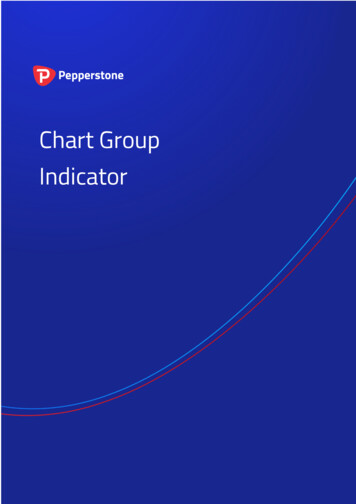
NCSS Statistical SoftwareNCSS.comC ChartsC Chart Analysis OutputEstimation and Limit Section for Rows 1 to 62 where Keep equals 1 Number of Nonconformities Variable DefectsContNumber ofUnits35Number ofNonconformities584Average # ofNonconformities16.68571 Nonconformities Limits Lower LimitUpper Limit4.43126928.940160Chart Section for Rows 1 to 62 Out-of-Control List for Rows 1 to 62 Row12131427475462Number ofNonconformities41.027.010.01.08.012.022.0Row Label12131427475462Reasonbeyond control limits2 of 3 in zone A2 of 3 in zone Abeyond control limits2 of 3 in zone A8 with none in zone C4 of 5 in zone B or beyondThe estimation and limits section shows the same results as Example 2, since the calculations are again based onlyon the first 37 joints, excluding 12 and 27. The plot shows a stable continuation of the process from joints 38 to62.258-12 NCSS, LLC. All Rights Reserved.
NCSS Statistical SoftwareNCSS.comC ChartsExample 4 – C Chart with Additional FormattingThis example uses the same setup as Example 3, except that a variety of improvements are made in the plotformat. These improvements are made by clicking the C Chart format button on the C Chart tab.You can load the completed template Example 4 by clicking on Open Example Template from the File menu ofthe C Charts window.C ChartChart Section for Rows 1 to 62 As shown here, a variety of enhancements can be made to the formatting of the control chart to make the chart aseasy to read as possible.258-13 NCSS, LLC. All Rights Reserved.
NCSS Statistical SoftwareNCSS.comC ChartsExample 5 – C Chart with StagesThis section presents a continuation of Examples 1, 2, and 3. After the first 62 joints, a new welding process isimplemented to reduce the number of nonconformities. The investigators examined 50 additional joints, using thefirst 25 joints of the additional 50 (63 to 87) to determine the in-control limits of the updated process. Theinvestigators wish to view the entire progress of the process, beginning with the first joint. This example showsthe use of stages to monitor a process with a change in center line and limit calculations.SetupTo run this example, complete the following steps:1Open the Weld example dataset From the File menu of the NCSS Data window, select Open Example Data. 2Select Weld and click OK.Specify the C Charts procedure options Find and open the C Charts procedure using the menus or the Procedure Navigator. The settings for this example are listed below and are stored in the Example 5 settings template. To loadthis template, click Open Example Template in the Help Center or File menu.OptionValueVariables TabNumber of Nonconformities Variable. DefectsStageNumber of Stages . Multiple StagesStage Variable . StageSpecification Method . Keep Rows VariableUse all rows where variable . KeepStageequals . 1Point Label Variable . Label3Run the procedure Click the Run button to perform the calculations and generate the output.Estimation and Limit SectionEstimation and Limit Section for Rows 1 to 62 where KeepStage equals 1 Number of Nonconformities Variable DefectsStageNumber ofUnits35Number ofNonconformities584Average # ofNonconformities16.68571 Nonconformities Limits Lower LimitUpper Limit4.43126928.940160Estimation and Limit Section for Rows 63 to 112 where KeepStage equals 1 Number of Nonconformities Variable DefectsStageNumber ofUnits25Number ofNonconformities238Average # ofNonconformities9.52 Nonconformities Limits Lower LimitUpper Limit0.26365118.776349This section displays the estimation for each stage separately. The estimation results for the first stage are thesame as the results in Examples 2 and 3.258-14 NCSS, LLC. All Rights Reserved.
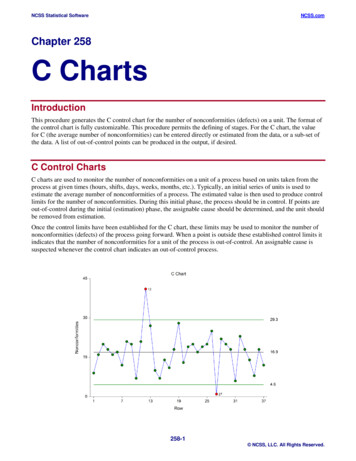
NCSS Statistical SoftwareNCSS.comC ChartsC ChartChart Section for Rows 1 to 112 The C chart shows the substantial decrease in the number of nonconformities in the second stage. The center lineand limits of the second stage are estimated from samples 63 to 87.Out-of-Control ListOut-of-Control List for Rows 1 to 62 Row12131427475462Number ofNonconformities41.027.010.01.08.012.022.0Row Label12131427475462Reasonbeyond control limits2 of 3 in zone A2 of 3 in zone Abeyond control limits2 of 3 in zone A8 with none in zone C4 of 5 in zone B or beyondWith no new out-of-control points, the out-of-control list is the same as that of the previous examples. There isnot an Out-of-Control List for joints 63 to 112 since there are no out-of-control points in this group.258-15 NCSS, LLC. All Rights Reserved.
12 41.0 12 beyond control limits 13 27.0 13 2 of 3 in zone A 14 10.0 14 2 of 3 in zone A 27 1.0 27 beyond control limits This report provides a list of the samples that failed one of the runs tests (including points outside the control limits). The report shows that joints 12 and 27 are beyond the control limits.