Transcription
7Graphical User Interfaceof System Identification Toolboxfor MATLABHiroyuki Takanashi1 and Shuichi Adachi21AkitaPrefectural University2Keio UniversityJapan1. IntroductionThis chapter describes a Graphical User Interface (GUI) of a system identification deviceused with MATLAB. MATLAB is a well-known software package that is widely used forcontrol system design, signal processing, system identification, etc. However, users who arenot familiar with MATLAB commands and system identification theory sometimes find itdifficult to use, typically because there are many different approaches to systemidentification. We propose using a GUI, which is especially suitable for beginners, toprovide system identification procedures. The difficulties encountered by beginners inperforming system identification might be reduced by using a GUI. The effectiveness of aGUI is illustrated using demonstration data in MATLAB.Modeling of a plant is one of the most important tasks in control system design. There aretwo main approaches to modeling: white-box modeling based on first principles and blackbox modeling based on input and output (I/O) data of a plant. The former is referred to asfirst principle modeling, while the latter is termed system identification.Computers have become powerful and useful tools in control system design. Severalsophisticated software packages (e.g., MATLAB, SCILAB, Octave and MaTX) have beendeveloped and are used for control system design and analysis.MATLAB is a well-known software package that is widely used not only in engineeringfields but also in other fields, including economic and biomechanical systems. MATLAB hasmany advantages for control system design and analysis. Important features includetoolboxes for specific applications and a user-friendly programming environment.A toolbox is a collection of functions that are appropriate for specific objectives. In particular,the system identification toolbox (SITB) (Ljung, 1995) provides useful functions for systemidentification. In the application of system identification theory to black-box modeling, usingthe SITB can dramatically reduce the user workload. However, because MATLAB interactswith the user via a command window, the user needs to know MATLAB commands.MATLAB has user-friendly programming environment since variables need not be declaredprior to being assigned and multidimensional arrays can be used as well as scalar variables.In contrast, C-language, Fortran and other programming languages require variables to bedeclared and arrays to be assigned.Source: User Interfaces, Book edited by: Rita Mátrai,ISBN 978-953-307-084-1, pp. 270, May 2010, INTECH, Croatia, downloaded from SCIYO.COMwww.intechopen.com
106User InterfacesSystem identification procedures for real plants consist of many steps, such as generatingidentification input signals for the plant, collecting I/O data, preprocessing andconditioning these data, executing a system identification algorithm and verifying theidentification results (Adachi, 1996). Table 1 shows a standard system identification step andrepresentative processing.Step 1Design of experimentStep 2Identification experimentStep 3PreprocessingStep 4Structural identificationStep 5Parameter estimationStep 6Validation of the modelDetermination ofinput signal,sampling frequency, etc.Collecting I/O signalsSignal processing.Eliminating biases, trends,outliers, etc.Selection of model structure,model order, etc.Executing an identificationalgorithmComparison of output,pole-zero cancellation, etc.Table 1. Several steps of system identification.However, the accuracy of the estimated models depends on which procedures are used andthe technical experience of the user. It is also difficult for beginners to judge to what extentthe estimated model reflects the physical phenomenon. As a result, beginners in systemidentification find it difficult to apply the theory, so they are apt to avoid using it.If the software were to provide a standard procedure for executing system identification,beginners might find the procedures easier. A GUI environment has the capability toprovide such an environment. Moreover, if there was a device that could handle systemidentification processes automatically (or semi-automatically), similar to the way in whichFFT analyzers or servo analyzers function, system identification theory might be moreextensively used in engineering fields.The purpose of this study is to develop a system identification device that can provide astructured framework to assist the user in performing system identification tasks. In particular,we develop a GUI environment for system identification based on the SITB (GUI-SITB).The remainder of this chapter is organized as follows. Section 2 gives an overview ofMATLAB software and system identification. Section 3 introduces the GUI for the SITB. Thekey topics of GUIs are described. Finally, Section 4 summarizes the chapter and describesopen problems associated with the proposed GUI-SITB.2. What is MATLAB and system identification?This section first introduces the general aspects of MATLAB software. Then, an overview ofsystem identification and the system identification toolbox are given.2.1 MATLAB softwareMATLAB is one of the most famous numerical computation software. It is widely used notonly in control engineering communities but also in other research communities. MATLABwww.intechopen.com
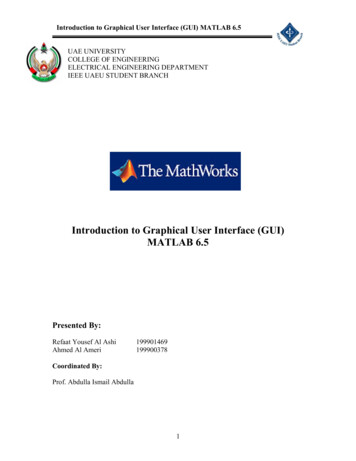
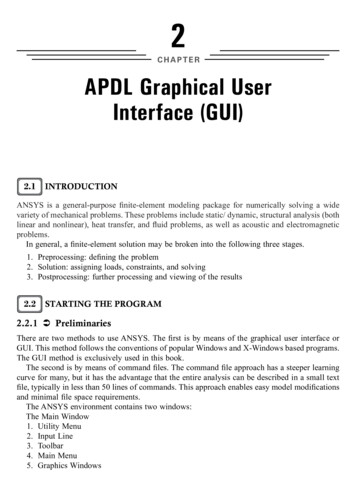
107Graphical User Interface of System Identification Toolbox for MATLABhas a C-like programming environment, but it has three distinctive features (Higham &Higham, 2000): Automatic storage allocation:Variables in MATLAB need not be declared prior to being assigned. Moreover,MATLAB expands the dimensions of arrays in order for assignments to make sense. Functions with variable arguments lists:MATLAB contains a large collection of functions. They take zero or more inputarguments and return zero or more output arguments. MATLAB enforces a cleardistinction between input and output. Functions can support a variable number ofinput and output arguments, so that on a given call not all arguments need be supplied. Complex arrays and arithmetic:The fundamental data type is a multi-dimensional array of complex numbers.Important special cases are matrices, vectors and scalars. All computation in MATLABis performed in floating-point arithmetic, and complex arithmetic is automatically usedwhen the data is complex.2.2 System identification and MATLAB toolboxOne of the most popular modeling methods is first principle modeling. This method issometimes called white-box modeling because it depends on the dynamical structure of thesystem under study. The dynamical structure is represented by physical laws, chemicallaws, and so on. Thus, the structure of the system must be clear.However, not all the dynamical structure of a system is always clear. System identification isa method for inferring dynamical models from observations of the system under study.System identification is sometimes called black-box modeling. The models are constructedunder the assumption that the system structure is unknown. White-box and black-boxmodeling represent very different approaches, but they complement each other.Fig. 1 illustrates some representative models and their relations. The relations allow the userto produce models according to their purposes and the situation of the system under study.Step responseParametric verseFouriertransformImpulse responseTransfer functionLaplacetransformFouriertransformFrequency transferfunctionNon-parametric modelState-space modelRealizationCurve fittingFig. 1. Relations of parametric and non-parametric models.To obtain an accurate model, the systems should be excited by an input signal because themodel represents dynamical properties. White noise or a pseudo random binary signalwww.intechopen.com
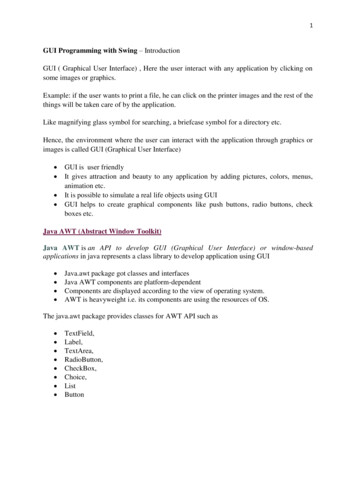
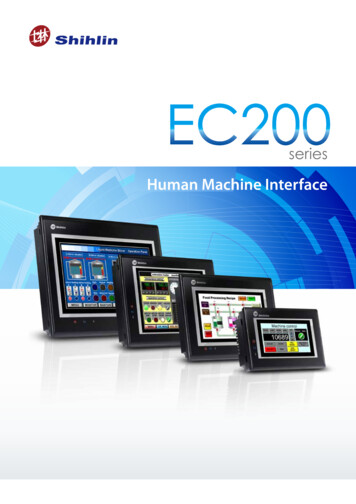
108User Interfaces(PRBS) are representative input signals for system identification experiments. Systemsshould be excited sufficiently for system identification. On the other hand, systems shouldnot be excited for control.After performing system identification experiments, the raw data needs to be preprocessedto obtain accurate models. This step greatly influences the accuracy and quality of themodel, because the raw data contains unnecessary frequency components, biases, trends,outliers, etc. These unnecessary components have a detrimental influence on models.The remaining steps (Steps 4 6) are repeatedly executed. Thus, estimating the parametersand evaluating the model should be performed as successive processes.MATLAB supports the above-mentioned steps. MATLAB includes some toolboxes that aredesigned for special objectives. Users can add any toolbox to their own environment. TheSITB is based on system identification theory developed by L. Ljung (Ljung, 1995).However, the user requires experience to obtain a high-quality model by systemidentification.3. Graphical user interface for system identification toolbox3.1 Basic concept of GUI-SITBFor system identification methods to be widely used in practical engineering fields, it isdesirable for the underlying theory to be as tractable as possible. Since system identificationtheory is based on statistical theory, signal processing, etc., the user needs a prioriknowledge about these topics. However, if system identification theory could be realized ina measurement device, engineers could conduct system identification without needing toconsider the theory.The ultimate goal of this research is to produce a measurement device that performs systemidentification, that functions in a similar manner to FFT analyzers or servo analyzers andthat is based on the underlying theory. One of the most important requirements of themeasurement device is that everyone must be able to obtain the same results using it.Therefore, it is necessary to standardize system identification procedures in such a way thatdifferent users obtain the same result for the same problem if they follow the standardprocedure.Fig. 2 illustrates the basic elements of a system identification device. The simplest structurefor the device consists of a personal computer (PC) running MATLAB with AD/DAconverters attached. Ideally, MATLAB would perform all the processing.System identification algorithms can utilize many types of model. To obtain a more accuratemodel, I/O signals must be processed before executing the system identification algorithm.Thus, the accuracy of the estimated model depends on the preprocessing and the modelsutilized.For these reasons, it is difficult for beginners in system identification to obtain accurate andreliable models without considerable trial and error. However, if system identification andpreprocessing procedures could be made very clear, there would be more likelihood thateveryone would obtain the same models.The first step in such a clarification is to establish an environment for system identificationthat consists of a set of standard procedures. Using a GUI is an effective strategy forrealizing such an environment. Thus, in this chapter, we discuss the development of a GUIbased system identification toolbox (GUI-SITB) within MATLAB.www.intechopen.com
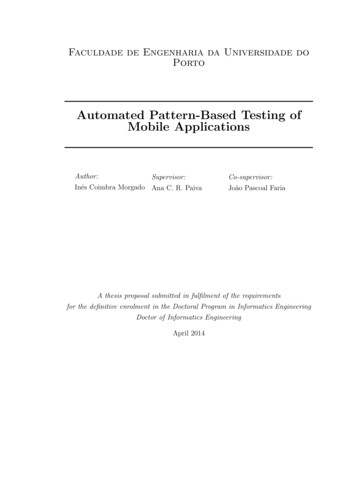
Graphical User Interface of System Identification Toolbox for MATLABInput Signal109Output SignalPlantto be modeledAD/DAPC withMATLABExecute all processingnecessary forsystem identificationSystem Identification DeviceFig. 2. Composition of a system identification device.The SITB already contains a GUI environment called by the command “ident”, whichoperates on preprocessing and system identification operations. However, the GUI-SITB inthis study also supports other procedures, such as generating input signals and systemidentification experiments. Moreover, it provides identification procedures in a controlledstepwise manner by utilizing typical GUI features.3.2 Features of GUI-SITBIn this section, we describe the features and functions of the GUI-SITB in detail. The GUISITB performs the following functions: generating input signals collecting I/O signals (system identification experiment) preprocessing I/O signals executing the system identification algorithm designing control systemsThese functions and their sequences of application have been selected from a set of generalsystem identification procedures. Although control system design is not strictly part ofsystem identification, one of the main purposes of system identification is “modeling forcontrol system design”, thus it is natural to include control system design within systemidentification procedures.Fig. 3 shows the main screen of the GUI-SITB that has been developed. Although the mainscreen shows a menu of five push-button functions, only certain operation sequences areallowed. In the following subsections, we describe the first four functions in detail.Table 2 summarizes the software environment. Some of the following results have beenobtained using the data used in the MATLAB demonstration program “iddemo1” (Ljung,1999).3.3 Generating input signalsIn system identification experiments, input signals that contain many frequencycomponents are required, since all dynamics of the plant must be excited. In the GUI-SITB,input signals are generated using the MATLAB command “idinput”. This commandgenerates several types of signals:www.intechopen.com
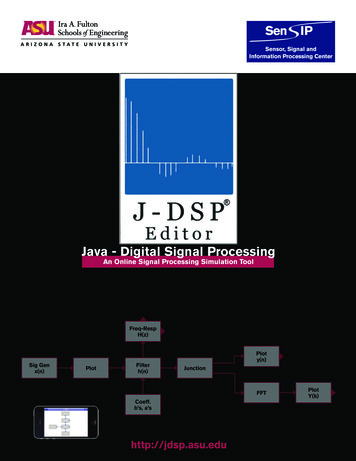
110User InterfacesFig. 3. Main screen of GUI-SITB.SoftwareOperating SystemMATLABSystem Identification ToolboxSignal Processing ToolboxSimulinkVersionWindows 2000 (SP4)6.5 (R13) SP15.0.26.15.1Table 2. Software environment. PRBS Gaussian random signal random binary signal sinusoidal signalThe minimum number of frequency components is defined by the persistently exciting (PE)condition. If the order of the plant to be identified is n, the order of the PE should be greaterthan or equal to 2n. It is preferable for the input signal to contain as many frequencycomponents as possible. From this viewpoint, a white noise signal would be ideal, althoughphysically impossible to realize. As a result, the ideal input signal for linear systemidentification experiments is considered to be a PRBS.There are some user-definable parameters when generating input signals using the GUISITB, including the number of samples, the maximum and minimum amplitudes, the upperand lower frequencies, the number of signals, and other parameters that depend on the typeof signal.Fig. 4 shows an example of a generated input signal. The figure shows some characteristicsof the MATLAB subplot style, but each subplot can also be individually displayed byclicking the “View” option on the menu bar, as indicated in the figure.For multiple input signals, only the first input signal is displayed and cross-correlationfunctions are also calculated. Since multiple-input system identification experiments requireuncorrelated input signals, cross-correlation functions are calculated for all input signalpairs, and the results for correlations between the first input signal and each of the otherinput signals are displayed graphically.www.intechopen.com
Graphical User Interface of System Identification Toolbox for MATLAB111Switch betweenindividual figuresFig. 4. An example of an input signal and its characteristics (upper left: input signal; upperright: power spectral density; lower left: histogram; lower right: auto-correlation function).3.4 Collecting I/O signal (identification experiment)Ordinarily, system identification experiments are carried out for real plants. Since one of themost important purposes of the GUI-SITB is to assist the user to learn the process of systemidentification, it includes an option of performing system identification experiments bysimulations. A virtual environment is prepared for simulations.The experimental environment in the GUI-SITB uses Simulink. A few Simulink models havebeen prepared for system identification experiments in the toolbox. The difference betweenusing real plants and Simulink models is the target; the basic procedures and functions ofthe toolbox are the same.Main WindowSubwindowExperimentalParametersFig. 5. System identification experiment window.www.intechopen.com
112User InterfacesFig. 5 shows the window for system identification experiments using Simulink models. Theuser selects a Simulink model from the left subwindow and then, in the main window,specifies the input signals (which have been saved as a mat file), the sampling frequency, theexperimental time and the name of the output signal. After specifying these parameters, the“START” button is pressed. The output signal of the plant is then displayed and the I/Osignals are saved as separate mat files. System identification experiments for real plants arecurrently being developed.3.5 Preprocessing I/O signalsPreprocessing of I/O signals must be performed subsequent to system identificationexperiments. The raw data is contaminated with trend, drift and noise. Consequently,estimating the model operations will fail (i.e., it will give bad estimates) if the identificationalgorithm is applied directly to the raw data. Therefore preprocessing is an essentialprerequisite for system identification. Applying appropriate signal processing (TheMathWorks Inc., 1998) will give an accurate model.Typical preprocessing tasks are removing trends and biases resampling (decimation and interpolation) scaling filtering (enhancement of frequency ranges)The trend removal procedure eliminates bias and any linear trends from the data. Time andfrequency domain data are useful for this purpose.In the system identification experiments, the I/O data is collected at an appropriatesampling frequency, which is usually determined based on information about the plant (e.g.,the band width of the closed-loop system and the rise time of the step response). However,when the information about the plant is unknown, it is desirable that the data collected overas short an interval as possible. After collecting the data, resampling can be applied toconvert the sampling frequency.The filtering procedure employs three types of filter: low-pass, high-pass, and band-passfilters. In the filtering process, the user specifies the frequency range (which is normalizedby the sampling frequency) and the order of the filter. A Butterworth filter is then utilizedfor which the user specifies the order.Several processing methods are listed in a drop-down menu. After the user selects one ofthese processing methods, the effect of preprocessing is displayed in both the time domain(as illustrated in Fig. 6) and the frequency domain. The upper part of Fig. 6 shows theunprocessed data, while the lower part shows the data after processing has been used toremove a trend.Other preprocessing methods are also necessary sometimes. For example, treatment ofmissing data is one of the most important advanced preprocessing tasks (Adachi, 2004). TheGUI-SITB cannot currently handle missing data, but there is a MATLAB command(“misdata”) available via the command line.3.6 Executing system identification algorithm and evaluation of the modelThere are several model structures in system identification. However, basic systemidentification can be performed using only a few model structures. In this study,representative parametric model structures are prepared.www.intechopen.com
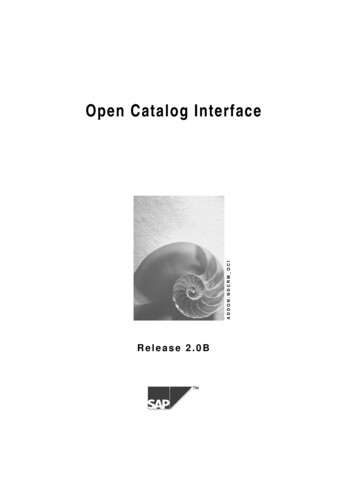
Graphical User Interface of System Identification Toolbox for MATLAB113Fig. 6. An example of preprocessing of output signal (upper subplot: before processing,lower subplot: after processing).Fig. 7. I/O data for identification and their characteristics (left subplots: input and outputsignals; upper right subplot: coherence function of I/O; lower right subplot: impulseresponse estimate via correlation method).www.intechopen.com
114User InterfacesThe most basic parametric model structure is the ARX (auto-regressive exogenous) or aleast-squares (LS) model. Other models include the ARMAX (auto-regressive movingaverage exogenous), OE (output error), and state-space models.After the user has loaded the I/O data, this data and some of its characteristics aredisplayed as in Fig. 7. The I/O data, coherence functions of the I/O data, and impulseresponse estimate by the correlation method are illustrated. The number of samples forestimation is a user-definable parameter. In the default setting, if either the number ofsamples for estimation or the validation is not specified, the first half of the data is used formodel estimation and the latter half is used for validation. When all the data is specified forestimation, the same data set is used for model validation. However, the low number ofsamples for the estimation results in poor estimates.The available model structures in the GUI-SITB are ARX model via least squares and IV (instrumental variable) method, ARMAX model, OE model, and State-space model via the subspace method (Overschee, 1994; Viberg, 1995).The user specifies the model order and the time delays for each model. The term “modelorder” refers to the orders of polynomials for the ARX, ARMAX and OE models and thenumber of states for the state-space model. Time delays can be estimated from the impulseresponse estimates, as shown in Fig. 7. In the bottom right figure, the dashed lines indicate a99% confidence interval. The number of impulses within the confidence interval, startingfrom lag-0, is used estimate the time delay of the system.Fig. 8 shows the frequency characteristics of the estimated ARX model, Fig. 9 shows acomparison of the outputs and Fig. 10 shows a pole-zero map. The frequency characteristicsSwitch betweenindividual figuresFig. 8. Bode diagram of estimated model and non-parametric models.www.intechopen.com
Graphical User Interface of System Identification Toolbox for MATLAB115Fig. 9. Comparison of model output and measured output (validation data).Fig. 10. Pole and zero locations of estimated model withrange.in Fig. 8 can be compared with the spectral analysis (MATLAB command “spa”) model andempirical transfer function estimates (MATLAB command “etfe”) (Ljung, 1999).www.intechopen.com
116User InterfacesThe models generated by the “spa” and “etfe” commands are used as references for theidentified model. Fig. 9 shows cross validation, while Fig. 10 illustrates pole-zero map withrange.aThese figures are switched by clicking the “View” menu in the figure window. Bode diagram, comparison of the output, and pole-zero map within a range of , where is the standard deviation.The fit rate in Fig. 9 is the mean square fitting (MSF) of the output and is computed by(1)Where,is the model output,measured output, which is defined byis the measured output andis the mean of the(2)Currently, the accuracy of the estimated model is evaluated using the function given in Eq.(1) only. The MSF is calculated using all the validation data. A function for evaluating themodel in the frequency domain, similar to the function defined by Eq. (1) for the timedomain, is also required.In the system identification operations, some parameters should be determined by the user,including the model structure, the model order and the sampling frequency for I/O signals.Model structures are determined from the system under study. The sampling frequency forI/O signals depend on that of the measurement system and the region of interest, which aredetermined in the experimental design step.Sampling theory states that the sampled signal should contain more than 2Fs [Hz] frequencycomponents if some signal that contains up to Fs [Hz] is reconstructed from the sampleddata. In other words, the sampled signal with a sampling frequency of 2Fs [Hz] is sufficientto recover information of a signal with a frequency less than Fs [Hz]. The upper frequency ofthe region of interest is determined based on this theory. However, none of the region belowFs [Hz] can be recovered from the sampled signal. In system identification, the lowerfrequency limit is determined empirically. For example, the LS method provides reliablemodels between 0.01Fs 0.2Fs [Hz] (Goodwin, 1988).The model order should be determined based on the system structure. Users can obtain themodel order using the SITB, e.g., AIC (Akaike Information Criteria), MDL (MinimumDescription Length) and singular value decomposition. When the system under study is avibration structure, the model consists of a sum of second-order models. Consequently, themodel order should be set as the product of second order and the number of degrees offreedom of the system.The real order of the system is generally very high and the model describes thecharacteristics of interest. Since the above-mentioned guideline for the model order does notwww.intechopen.com
Graphical User Interface of System Identification Toolbox for MATLAB117account for the effects of disturbance, users may need to set a higher model order to obtainan accurate model.The estimated model is saved in theta format as a mat file. Since the theta format containsinformation about the estimated model, including polynomial coefficients, the loss function,the final prediction error (FPE) and the sampling time, it contains sufficient information toreproduce the Bode diagram or pole-zero maps of the estimated model.4. Conclusions and future workIn this chapter, we have described the advantages of using a GUI environment in systemidentification and the development of a GUI-SITB. The effectiveness of the toolbox wasdemonstrated by a simple example.We confirmed the operation of the GUI-SITB only on MATLAB for a Windows platform.The GUI-SITB has been developed using MATLAB R13. The GUI-SITB may operate on thelatest MATLAB version (R14 or later) with slight modification of the programs.Since evaluation of the identification results is one of the most important parts in systemidentification, the evaluation method and of the system identification algorithm need to beextended to achieve this. Because the GUI-SITB currently displays results only graphically(as illustrated in Figs. 8-10), it would be desirable to implement numerical evaluationmethods, one of which would display parameters of the estimated model in an appropriateformat.Furthermore, currently incomplete functions, such as the identification experiments for realplants and control system design, need to be rapidly developed. A part of the MIMO systemidentification procedure has been realized, but it is not yet complete.5. ReferencesMATLAB. http://www.mathworks.com/products/matlab/ [September, 2009]Scilab. http://www.scilab.org/ [September, 2009]Octave. http://www.gnu.org/software/octave/ [September, 2009]MaTX. http://www.matx.org/ [September, 2009]Ljung, L. (1995), System Identification Toolbox – For Use with MATLAB (Third Printing), TheMathWorks Inc.Adachi S. (1996). System Identification for Control Systems with MATLAB (in Japanese), TokyoDenki University Press.Higham D. J. and Higham N. J. (2000). MATLAB Guide, Society for Industrial and AppliedMathematics.Ljung L. (1999). System Identification - Theory for the User (2nd Ed.), Prentice Hall PTR,Englewood Cliffs, NJ.The MathWorks Inc. (1998). Signal Processing Toolbox User's Guide, The MathWorks Inc.Adachi S. (2004). Advanced System Identification for Control Systems with MATLAB (inJapanese), Tokyo Denki University Press.Van Overschee, P. and De Moor, M. (1994). N4SID: Subspace algorithm for the identificationof combined deterministic-stochastic system, Automatica, Vol.30, pp.75-93.www.intechopen.com
118User InterfacesViberg, M. (1995). Subspace-based methods for the identification of linear time-invariantsystems, Automatica, Vol.31, pp.1835-1851.Goodwin C. G., M. E. Salgado and R. H. Middleton. (1988). Indirect Adaptive Control -AnIntegrated Approach, Proceedings of American Control Conference, pp.2440-2445.www.intechopen.com
User InterfacesEdited by Rita MatraiISBN 978-953-307-084-1Hard cover, 270 pagesPublisher InTechPublished online 01, May, 2010Published in print edition May, 2010Designing user interfaces nowadays is indispensably important. A well-designed user interface promotes usersto complete their everyday tasks in a great extent, particularly users with special needs. Numerous guidelineshave already been developed for designing user interfaces but because of the technical development, newchallenges appear continuously, various ways of information seeking, publication and transmit evolve.Computers and mobile devices have roles in all walks of life such as in a simple search of the web, or usingprofessional applications or in distance communication between hearing impaired people. It is important thatusers can apply the interface easily and the technical parts do not distract their attention from their work.Proper design of user interface can prevent users from several inconveniences, for which this book is a greathelp.How to referenceIn order to correctly reference this scholarly work, feel free to copy and paste the following:Hiroyuki Takanashi and Shuichi Adachi (2010). Graphical User Interface of System Identification Toolbox forMATLAB, User Interfaces, Rita Matrai (Ed.), ISBN: 978-953-307-084-1, InTech, Available on-toolbox-formatlabInTech EuropeUniversity Campus STeP RiSlavka Krautzeka 83/A51000 Rijeka, CroatiaPhone: 385 (51) 770 447Fax: 385 (51) 686 166www.intechopen.comInTech ChinaUnit 405, Office Block, Hotel Equatorial ShanghaiNo.65, Yan An Road (West), Shanghai, 200040, ChinaPhone: 86-21-62489820Fax: 86-21-62489821
2010 The Author(s). Licensee IntechOpen. This chapter is distributedunder the terms of the Creative Commons Attribution-NonCommercialShareAlike-3.0 License, which permits use, distribution and reproduction fornon-commercial purposes, provided the original is properly cited andderivative works building on this content are distributed under the samelicense.
used with MATLAB. MATLAB is a well-known software package that is widely used for control system design, signal processing, system identification, etc. However, users who are not familiar with MATLAB commands and system identification theory sometimes find it difficult to use, typically because there are many different approaches to system