Transcription
OVERVOLTAGE, EMI AND RFICHAPTER 11: OVERVOLTAGE EFFECTSON ANALOG INTEGRATED CIRCUITSSECTION 11.1: OVERVOLTAGE EFFECTSAMPLIFIER INPUT STAGE OVERVOLTAGEAMPLIFIER OUTPUT VOLTAGE PHASE REVERSALSECTION 11.2: ELECTROSTATIC DISCHARGE (ESD)UNDERSTANDING AND PROTECTING INTEGRATED CIRCUITSFROM ELECTROSTATIC DISCHARGE (ESD)SECTION 11.3: EMI/RFI CONSIDERATIONSA PRIMER ON EMI REGULATIONSCOMMERCIAL EQUIPMENTMILITARY EQUIPMENTMEDICAL EQUIPMENTINDUSTRIAL AND PROCESS-CONTROL EQUIPMENTAUTOMOTIVE EQUIPMENTEMC REGULATIONS' IMPACT ON DESIGNPASSIVE COMPONENTS: YOUR ARSENAL AGAINST EMIRADIO FREQUENCY INTERFERENCE (RFI)GROUND REDUCES EFFECTIVENESSSOLUTIONS FOR POWER-LINE DISTURBANCESPRINTED CIRCUIT BOARD DESIGN FOR EMI PROTECTIONA REVIEW OF SHIELDING CONCEPTSGENERAL POINTS ON CABLES AND SHIELDSEMI TROUBLE SHOOTING 3511.3711.4211.4711.4911.50
BASIC LINEAR DESIGN
OVERVOLTAGE EFFECTS ON ANALOG INTEGRATED CIRCUITSCHAPTER 11: OVERVOLTAGE EFFECTS ONANALOG INTEGRATED CIRCUITSSECTION 11.1: OVERVOLTAGE EFFECTSOne of the most commonly asked applications questions is: “What happens if externalvoltages are applied to an analog integrated circuit with the supplies turned off?” Thisquestion describes situations that can take on many different forms: from lightning strikeson cables which propagate very high transient voltages into signal conditioning circuits,to walking across a carpet and then touching a printed circuit board full of sensitiveprecision circuits. Regardless of the situation, the general issue is the effect ofovervoltage stress (and, in some cases, abuse) on analog integrated circuits. Thediscussion which follows will be limited in general to operational amplifiers, because it isthese devices that most often interface to the outside world. The principles developedhere can and should be applied to all analog integrated circuits which are required tocondition or digitize analog waveforms. These devices include (but are not limited to)instrumentation amplifiers, analog comparators, sample-and-hold amplifiers, analogswitches and multiplexers, and analog-to-digital converters.Amplifier Input Stage OvervoltageIn real world signal conditioning, sensors are often used in hostile environments wherefaults can and do occur. When these faults take place, signal conditioning circuitry can beexposed to large voltages which exceed the power supplies. The likelihood for damage isquite high, even though the components’ power supplies may be turned on. Publishedspecifications for operational amplifier absolute maximum ratings state that applied inputsignal levels should never exceed the power supplies by more than 0.3 V or, in somedevices, 0.7 V. Exceeding these levels exposes amplifier input stages to potentiallydestructive fault currents which flow through internal metal traces and parasitic P-Njunctions to the supplies. Without some type of current limiting, unprotected inputdifferential pairs (BJTs or FETs) can be destroyed in a matter of microseconds. Thereare, however, some devices with built-in circuitry that can provide protection beyond thesupply voltages, but in general, absolute maximum ratings must still be observed.Although more recent vintage operational amplifiers designed for single-supply or railto-rail operation are now including information with regard to input stage overvoltageeffects, there are very many amplifiers available today without such information providedby the manufacturer. In those cases, the circuit designer using these components mustascertain the input stage current-voltage characteristic of the device in question before11.1
BASIC LINEAR DESIGNsteps can be taken to protect it. All amplifiers will conduct current to thepositive/negative supply, provided the applied input voltage exceeds some internalthreshold. This threshold is device dependent, and can range from 0.7 V to 30 V,depending on the internal construction of the input stage. Regardless of the thresholdlevel, externally generated fault currents should be limited to no more than 5 mA. INPUT SHOULD NOT EXCEED ABSOLUTE MAXIMUM RATINGS(Usually Specified With Respect to Supply Voltages) A Common Specification Requires the Input Signal Vs 0.3 V Input Voltage Should be Held Near Zero in the Absence of Supplies Input Stage Conduction Current Needs to be Limited (Rule of Thumb: 5 mA) Avoid Reverse Bias Junction Breakdown in Input Stage Base - EmitterJunctions Differential and Common-Mode Ratings may Differ No Two Amplifiers are exactly the Same Some Op Amps Contain Input Protection (Voltage Clamps, Current Limits, orBoth), but Absolute Maximum Ratings Must Still be ObservedFigure 11.1: Input Stage OvervoltageMany factors contribute to the current-voltage characteristic of an amplifier’s input stage:internal differential clamping diodes, current-limiting series resistances, substratepotential connections, and differential input stage topologies (BJTs or FETs). Inputprotection diodes used as differential input clamps are typically constructed from thebase-emitter junctions of NPN transistors. These diodes usually form a parasitic P-Njunction to the negative supply when the applied input voltage exceeds the negativesupply. Current-limiting series resistances used in the input stages of operationalamplifiers can be fabricated from three types of material: N- or P-type diffusions,polysilicon, or thin-films (SiCr, for example). Polysilicon and thin-film resistors arefabricated over thin layers of oxide which provide an insulating barrier to the substrate;as such, they do not exhibit any parasitic P-N junctions to either supply. Diffusedresistors, on the other hand, exhibit P-N junctions to the supplies because they areconstructed from either P- or N-type diffusion regions. The substrate potential of theamplifier is the most critical component, for it will determine the sensitivity of anamplifier’s input current-voltage characteristic to supply voltage.The configuration of the amplifier’s input stage also plays a large role in the currentvoltage characteristic of the amplifier. Input differential pairs of operational amplifiersare constructed from either bipolar transistors (NPN or PNP) or field-effect transistors(junction or MOS, N- or P-channel). While the bipolar input differential pairs do not haveany direct path to either supply, FET differential pairs do. For example, an N-channelJFET forms a parasitic P-N junction between its backgate and the P-substrate that11.2
OVERVOLTAGE EFFECTS ON ANALOG INTEGRATED CIRCUITSenergizes when VIN 0.7 V VNEG. As mentioned previously, many manufacturers ofanalog integrated circuits do not provide any details with regard to the behavior of thedevice’s input structure. Either simplified schematics are not provided or, if they areshown, the behavior of the input stage under an overvoltage condition is omitted.Therefore, other measures must be taken in order to identify the conduction paths.A standard transistor curve tracer can be configured to determine the current-voltagecharacteristic of any amplifier regardless of input circuit topology. Both amplifier supplypins are connected to ground, and the collector output drive is connected to one of theamplifier’s inputs. The curve tracer applies a DC ramp voltage and measures the currentflowing through the input stage. In the event that a transistor curve tracer is not available,a DC voltage source and a multimeter can be substituted for the curve tracer. A 10 kΩresistor should be used between the DC voltage source and the amplifier input foradditional protection. Ammeter readings from the multimeter at each applied DC voltagewill yield the same result as that produced by the curve tracer. Although either input canbe tested (both inputs should), it is recommended that the unused input is left open;otherwise, additional junctions could come into play and would complicate mattersfurther. Evaluations of current feedback amplifier input stages are more difficult becauseof the lack of symmetry between the inputs. As a result, both inputs should becharacterized for their individual current-voltage characteristics. Junctions may be Forward Biased if the Current is Limited In General a Safe Current Limit is 5mA Reverse Bias Junction Breakdown is Damaging Regardless of the CurrentLevel When in Doubt, Protect with External Diodes and Series Resistances Curve Tracers Can be Used to Check the Overvoltage Characteristics of aDevice Simplified Equivalent Circuits in Data Sheets do not tell the Entire Story!!!Figure 11.2: Overvoltage EffectsOnce the input current-voltage characteristic has been determined for the device inquestion, the next step is to determine the minimum level of resistance required to limitfault currents to 5 mA. Equation 11.1 illustrates the computation for Rs when the inputovervoltage level is known:Rs VIN(MAX) VSUP P LY5 mAEq. 11-1The worst case condition for overvoltage would be when the power supplies are initiallyturned off or disconnected. In this case, VSUPPLY is equal to zero. For example, if the11.3
BASIC LINEAR DESIGNinput overvoltage could reach 100 V under some type of fault condition, then the externalresistor should be no smaller than 20kΩ. Most operational amplifier applications onlyrequire protection at one input; however, there are a few configurations (differenceamplifiers, for example) where both inputs can be subjected to overvoltage and both mustbe protected. The need for protection on both inputs is much more common withinstrumentation amplifiers. Sometimes Occurs in FET and Bipolar Input (Especially SingleSupply) Op Amps when Input Exceeds Common Mode Range Does Not Harm Amplifier, but may be Disastrous in ServoSystems! Not Usually Specified on Data Sheet, so Amplifier Must be Checked Easily Prevented:BiFETs:Add Appropriate Input Series Resistance(Determined Empirically, Unless Provided inData Sheet)Bipolars:Use Schottky Diode Clamps to the SupplyRails.Figure 11.3: BEWARE OF AMPLIFIER OUTPUT PHASE REVERSALAmplifier Output Voltage Phase ReversalSome operational amplifiers exhibit output voltage phase reversal when one or both oftheir inputs exceeds their input common-mode voltage range. Phase reversal is usuallyassociated with JFET (n- or p-channel) input amplifiers, but some bipolar devices(especially single-supply amplifiers operating as unity-gain followers) may also besusceptible. In the vast majority of applications, output voltage phase reversal does notharm the amplifier nor the circuit in which the amplifier is used. Although a number ofoperational amplifiers suffer from phase reversal, it is rarely a problem in system design.However, in servo loop applications, this effect can be quite hazardous. Fortunately, thisis only a temporary condition. Once the amplifier’s inputs return to within its normaloperating common-mode range, output voltage phase reversal ceases. It may still benecessary to consult the amplifier manufacturer, since phase reversal information rarelyappears on device data sheets.In BiFET operational amplifiers, phase reversal may be prevented by adding anappropriate resistance in series with the amplifier’s input to limit the current. Bipolar11.4
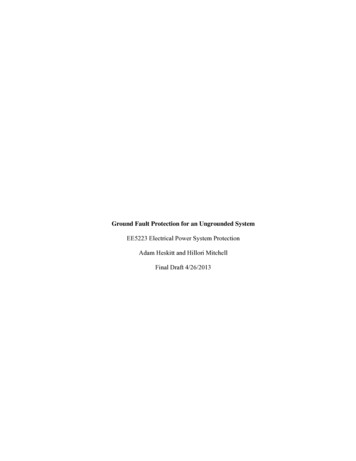
OVERVOLTAGE EFFECTS ON ANALOG INTEGRATED CIRCUITSinput devices can be protected by using a Schottky diode to clamp the input to within afew hundred millivolts of the negative rail. For a complete description of the outputvoltage phase reversal effect, please consult Reference 1.VPOS*D3*BER3R4BD5D7E5k ΩIN V D8Q1D1Q3Q2Q4D2IN5k Ω*D6D4R1*R2VNEG* D3 - D6: SUBSTRATE PNPs (COLLECTORS TO VNEG)Figure 11.4: A Closer Look at the OP-X91 Input StageReveals Additional DevicesRail-to-rail operational amplifiers present a special class of problems to the integratedcircuit designer, because these types of devices should not exhibit any abnormal behaviorthroughout the entire input common-mode range. In fact, it is desirable that devices usedin these applications also not exhibit any abnormal behavior if the applied input voltagesexceed the power supply range. One of the more recent vintage rail-to-rail input/outputoperational amplifiers, the OPX91 family (the OP191, the OP291, and the OP491),includes additional components that prevent overvoltage and damage to the device. Asshown in Figure 11.4, the input stage of the OPX91 devices use six diodes and tworesistors to clamp the input terminals to each other and to the supplies. D1 and D2 arebase-emitter NPN diodes which are used to protect the bases of Q 1- Q2 and Q3 - Q4against avalanche breakdown when the applied differential input voltage to the deviceexceeds 0.7 V. Diodes D3 - D6 are diodes formed from substrate PNP transistors thatclamp the applied input voltages on the OPX91 to the supply rails.An interesting benefit from using substrate PNPs as clamp diodes is that their collectorsare connected to the negative supply; thus, when the applied input voltage exceeds eithersupply rail, the diodes energize, and the fault currents are diverted directly to the supplyand not through or into the device’s input stage. There are also 5kΩ resistors in serieswith each of the inputs to the OPX91 to limit the fault current through D1 and D2 when11.5
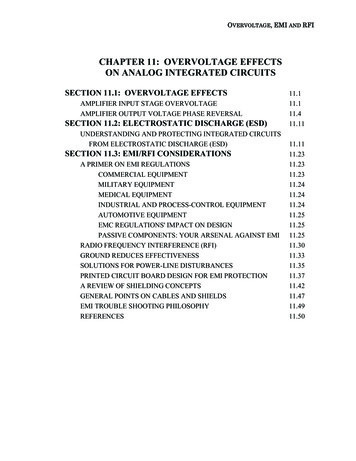
BASIC LINEAR DESIGNthe differential input voltage exceeds 0.7 V. Note that these 5 kΩ resistors are p-typediffusions placed inside an n-well, which is then connected to the positive supply. Whenthe applied input voltage exceeds the positive supply, some of the fault current generatedis also diverted to VPOS and away from the input stage. As a result of these measures,the input overvoltage characteristic of the OPX91 is well behaved as shown in Figure11.6. Note that the combination of the 5 kΩ resistors and clamp diodes safely limits theinput current to less than 2 mA, even when the inputs of the device exceed the supplyrails by 10 V.IIN2mA1mA-10V-5V5V10VVIN-1mA-2mAFigure 11.5:Internal 5 kΩ Resistors Plus Input Clamp Diodes Combine toProtect OP-X91 Devices Against OvervoltageAs an added safety feature, an additional pair of diodes is used in the input stage acrossQ3 and Q4 to prevent subsequent stages internal to the OPX91 from collapsing (that is,forced into cutoff). If these stages were forced into cutoff, then the amplifier wouldundergo output voltage phase reversal when the inputs exceeded the positive inputcommon mode voltage. An illustration of the diodes’ effectiveness is shown inFigure 11.6. Here, the OPX91 family can safely handle a 20 Vp-p input signal on 5 Vsupplies without exhibiting any sign of output voltage phase reversal or other anomalousbehavior. With these amplifiers, no external clamping diodes are required.11.6
OVERVOLTAGE EFFECTS ON ANALOG INTEGRATED CIRCUITS 5VVIN20Vp-p38 1/22 OP2914VOUTVIN - 2.5V/DSIVVOUT - 2V/DSIV-5VTIME - 200μs/DIVTIME - 200μs/DIVFigure 11.6: Addition of Two Clamp Diodes Protects OP-X91Devices Against Output Phase ReversalVPOSRFBD1VINRSVOUT D2Value for RS provided by manufacturer or determined empiricallyRFB may be required for high bias current devicesD1 and D2 can be Schottky diodes (Check their capacitance andleakage current first)Figure 11.7: Generalized External Protection Schemes Against InputOvervoltage Abuse and Output Voltage Phase Reversalin Single Supply Op AmpsFor those amplifiers where external protection is clearly required against bothovervoltage abuse and output phase reversal, a common technique is to use a series11.7
BASIC LINEAR DESIGNresistance, Rs, to limit fault current, and Schottky diodes to clamp the input signal to thesupplies, as shown in Figure 11.7.The external input series resistance, Rs, will be provided by the manufacturer of theamplifier, or determined empirically by the user with the method previously shown inFigure 11.2 and Eq. 11.1. More often than not, the value of this resistor will provideenough protection against output voltage phase reversal, as well as limiting the faultcurrent through the Schottky diodes.It is evident that whenever resistance is added in series with an amplifier’s input, itsoffset and noise performance will be affected. The effects of this series resistance oncircuit noise can be calculated using the following equation.E n ,t ot a l (e n ,op a m p )2 (e n ,R s ) 2 (R s i n ,op a m p )2Eq. 11-2The thermal noise of the resistor, the voltage noise due to amplifier noise current flowingthrough the resistor, and the input noise voltage of the amplifier are added together (inroot-sum-square manner, since the noise voltages are uncorrelated) to determine the totalinput noise and may be compared with the input voltage noise in the absence of theprotection resistor.A protection resistor in series with an amplifier input will also produce a voltage dropdue to the amplifier bias current flowing through it. This drop appears as an increase inthe circuit offset voltage (and, if the bias current changes with temperature, offset drift).In amplifiers where bias currents are approximately equal, a resistor in series with eachinput will tend to balance the effect and reduce the error. The effects of this additionalseries resistance on the circuit’s overall offset voltage can be calculated:Vos ( t ot a l ) Vos I b R sEq. 11-3For the case where RFB Rs or where the source impedance levels are balanced, thenthe total circuit offset voltage can be expressed as:Vos(t ot a l) Vos I os R sEq. 11-4To limit the additional noise of RFB, it can be shunted with a capacitor.When using external clamp diodes to protect operational amplifier inputs, the effects ofdiode junction capacitance and leakage current should be evaluated in the application.Diode junction capacitance and Rs will add an additional pole in the signal path, anddiode leakage currents will double for every 10 C rise in ambient temperature. Therefore,low leakage diodes should be used such that, at the highest ambient temperature for theapplication, the total diode leakage current is less than one-tenth of the input bias currentfor the device at that temperature. Another issue with regard to the use of Schottky diodesis the change in their forward voltage drop as a function of temperature. These diodes do11.8
OVERVOLTAGE EFFECTS ON ANALOG INTEGRATED CIRCUITSnot, in fact, limit the signal to 0.3 V at all ambient temperatures, but if the Schottkydiodes are at the same temperature as the op amp, they will limit the voltage to a safelevel, even if they do not limit it at all times to within the data sheet rating. This is true ifover-voltage is only possible at turn-on, when the diodes and the op amp will always beat the same temperature. If the op amp is warm when it is repowered, however, stepsmust be taken to ensure that diodes and op amp are at the same temperature.11.9
BASIC LINEAR DESIGNNotes:11.10
ELECTROSTATIC DISCHARGE (ESD)SECTION 11.2: ELECTROSATIC DISCHARGE (ESD)Understanding and Protecting Integrated Circuits from ElectrostaticDischarge (ESD)Integrated circuits can be damaged by the high voltages and high peak currents that canbe generated by electrostatic discharge. Precision analog circuits, which often featurevery low bias currents, are more susceptible to damage than common digital circuits,because the traditional input-protection structures which protect against ESD damagealso increase input leakage.The keys to eliminating ESD damage are: (1) awareness of the sources of ESD voltages,and (2) understanding the simple handling steps that will discharge potential voltagessafely. ESD (Electrostatic Discharge): A single fast, high current transfer of electrostatic charge. Direct contact between two objects at different potentials. A high electrostatic field between two objects when they are in closeproximity. ESD Failure Threshold: The highest voltage level at which all pins on a device can be subjectedto ESD zaps without failing any 25 C data sheet limits.Figure 11.8: ESD DefinitionsThe basic definitions relating to ESD are given in Figure 11.8. Notice that the ESDFailure Threshold level relates to any of the IC data sheet limits, and not simply to acatastrophic failure of the device. Also, the limits apply to each pin of the IC, not just tothe input and output pins.The generation of static electricity caused by rubbing two substances together is calledthe triboelectric effect. Static charge can be generated either by dissimilar materials (forexample, rubber-soled shoes moving across a rug) or by separating similar materials (forexample, pulling transparent tape off of a roll).11.11
BASIC LINEAR DESIGNA wide variety of common human activities can create high electrostatic charge. Someexamples are given in Figure 11.9. The values shown will occur with a fairly highrelative humidity. Low humidity, such as can occur indoors during cold weather, cangenerate voltages 10 times (or more) greater than the values shown. Person walks across a typical carpet.1000 - 1500V generated Person walks across a typical vinyl floor.150 - 250V generated Person handles instructions protected by clear plastic covers.400 - 600V generated Person handles polyethylene bags.1000 - 1200V generated Person pours polyurethane foam into a box.1200 - 1500V generated An IC slides down a grounded handler chute.50 - 500V generated An IC slides down an open conductive shipping tube.25 - 250V generatedNote: Above values can occur in a high ( 60%) RH environment. For lowRH ( 30%), generated voltages can be 10 times those listed above!Figure 11.9: Examples of ESD GenerationIn an effort to standardize the testing and classification of integrated circuits for ESDrobustness, ESD models have been developed (Figure 11.10). These models attempt tosimulate the source of ESD voltage. The assumptions underlying the three commonlyused models are different, so results are not directly comparable. Three Models:1.Human Body Model (HBM)2.Machine Model (MM)3.Charged Device Model (CDM) Model Correlation: Low - Assumptions are DifferentFigure 11.10:11.12Modeling Electrostatic Potential
ELECTROSTATIC DISCHARGE (ESD)The most-often encountered ESD model is the Human Body Model (HBM). This modelsimulates the approximate resistance and capacitance of a human body with a simple RCnetwork. The capacitor is charged through a high voltage power supply (HVPS) and thendischarged (using a high voltage switch) through a series resistor. The RC values fordifferent individuals will, of course, vary. However, the HBM has been standardized byMIL-STD-883 Method 3015 Electrostatic Discharge Sensitivity Classification, whichspecifies R-C combinations of 1.5 kΩ and 100 pF. (R, C, and L values for all three ESDmodels are shown in Figure 11.12.) Human Body Model (HBM)Simulates the discharge event that occurs when a personcharged to either a positive or negative potential touchesan IC at a different potential.RLC:R 1.5kΩ,L 0nH,C 100pF Machine Model (MM)Non-real-world Japanese model based on worst-case HBM.RLC:R 0 Ω,L 500nH,C 200pF Charged Device Model (CDM)Simulates the discharge that occurs when a pin on an IC,charged to either a positive or negative potential,contacts a conductive surface at a different (usually ground)potential.RLC:R 1ΩL 0nH,C 1 - 20pFFigure 11.11:ESD Models Applicable to ICsThe Machine Model (MM) is a worst-case Human Body Model. Rather than using anaverage value for resistance and capacitance of the human body, the MM assumes aworst-case value of 200 pF and 0Ω. The 0Ω output resistance of the MM is also intendedto simulate the discharge from a charged conductive object (for example, a charged DUTsocket on an automatic test system) to an IC pin, which is how the Machine Modelearned its name. However, the MM does not simulate many known real-world ESDevents. Rather, it models the ESD event resulting from a ideal voltage source (in otherwords, with no resistance in the discharge path). EIAJ Specification ED-4701 TestMethod C-111 Condition A and ESD Association Specification S5.2 provide guidelinesfor MM testing.The Charged Device Model (CDM) originated at AT&T. This model differs from theHBM and the MM, in that the source of the ESD energy is the IC itself. The CDMassumes that the integrated circuit die, bond wires, and lead frame are charged to somepotential (usually positive with respect to ground). One or more of the IC pins thencontacts ground, and the stored charge rapidly discharges through the leadframe and11.13
BASIC LINEAR DESIGNbond wires. Typical examples of triboelectric charging followed by a CDM dischargeinclude:1. An IC slides down a handler chute and then a corner pin contacts a grounded stop bar.2. An IC slides down an open conductive shipping tube and then a corner pin contacts aconductive surface.R1HBM S11 0 MΩHVPSC1R1MM R201.5kΩL1500nH1 0 MΩC1IHBMDUT100pFS1HVPSL1tR2I0DUT200pFMMCDM R11 0 MΩHVPS-DUTS1L1R201ΩItCDMCPKG1-20pFtFigure 11.12: Schematic Representations of ESD Modelsand Typical Discharge WaveformsThe basic concept of the CDM is different than the HBM and MM in two ways. First, theCDM simulates a charged IC discharging to ground, while the HBM and MM bothsimulate a charged source discharging into the IC. Thus, current flows out of the ICduring CDM testing, and into the IC during HBM and MM testing. The second differenceis that the capacitor in the CDM is the capacitance of the package, while the HBM andMM use a fixed external capacitor.Unlike the HBM and MM, CDM ESD thresholds may vary for the same die in differentpackages. This occurs because the device under test (DUT) capacitance is a function ofthe package. For example, the capacitance of an 8-pin package is different than thecapacitance of a 14-pin package. CDM capacitance values can vary from about 1 to20 pF. The device capacitance is discharged through a 1 Ω resistor.11.14
ELECTROSTATIC DISCHARGE (ESD)Schematic representations of the three models are shown in Figure 11.13. Notice that C1in the HBM and MM are external capacitors, while CPKG in the CDM is the internalcapacitance of the DUT.The HBM discharge waveform is a predicable unipolar RC pulse, while the MMdischarge shows ringing because of the parasitic inductance in the discharge path(typically 500 nH.). Ideally, the CDM waveform is also a single unipolar pulse, but theparasitic inductance in series with the 1 Ω resistor slows the rise time and introducessome ringing.MODEL:Simulate:Origin:Real World?RC:Rise TimeIpeak at 400VEnergy:PackageDependent:Standard:***HBMHuman BodyUS Military, Late1960sYesMMSOCKETED CDMMachineJapan, 1976Charged DeviceAT&T,1974GenerallyYes0 Ω, 200 pF14 ns*5.8 A*High1 Ω , 1 – 20 pF400 ps**2.1 A**LowNoNoYesMIL-STD-883Method 3015ESD AssociationStd. S5.2;EIAJ Std. ED-4701,Method C-111ESD AssociationDraft Std. DS5.31.5 k Ω, 100 pF 10 ns (6-9 ns typ )0.27 AModerateThese values per ESD Association Std. S5.2.EIAJ Std. ED-4701, Method C-111 includes no waveform specifications.These values are for the direct charging (socketed) method.Figure 11.13: Comparison of HBM, MM, AND CDM ESD ModelsThe significant features of each ESD model are summarized in Figure 11.13. The peakcurrents shown for each model are based on a test voltage of 400 V. Peak current islowest for the HBM because of the relatively high discharge resistance. The CDMdischarge has low energy because device capacitance is only in the range of 1 pF to 20pF, but peak current is high. The MM has the highest energy discharge, because it has thehighest capacitance value (Power 0.5 CV2).Figure 11.14 compares 400 V discharge waveforms of the CDM, MM, and HBM, withthe same current and time scales.11.15
BASIC LINEAR DESIGNAMPS64Socketed CDM20tAMPS642MM0t-2AMPS-4HBM20HORIZONTAL SCALES20 ns/divtFigure 11.14: Relative Comparison of 400 V HBM, MM, AND CDM DischargesThe CDM waveform corresponds to the shortest known real-world ESD event. Thewaveform has a rise time of 1 ns, with the total duration of the CDM event only about2 ns. The CDM waveform is essentially unipolar, although some ringing occurs at theend of the pulse that results in small negative-going peaks. The very short duration of theoverall CDM event results in an overall discharge of relatively low energy, but peakcurrent is high.The MM waveform consists of both positive- and negative-going sinusoidal peaks, with aresonance frequency of 10 MHz to 15 MHz. The initial MM peak has a typical rise timeof 14 ns, and the total pulse duration is about 150 ns. The multiple high current, moderateduration peaks of the MM result in an overall discharge energy that is by far the highestof the three models for a given test voltage.The risetime for the unipolar HBM waveform is typically 6 - 9 ns, and the waveformdecays exponentially towards 0 V with a fall time of approximately 150 ns. (Method3015 requires a rise time of 10 ns and a delay time of 150 ns 20 ns, with decay timedefined as the time for the waveform to drop from 100% to 36.8% of peak current). Thepeak current for the HBM is 400 V/1500 Ω or 0.267 A, which is much lower than is11.16
ELECTROSTATIC DISCHARGE (ESD)produced by 400 V CDM and MM events. However, the relatively long duration of thetotal HBM event still results in an overall discharge of moderately high energy.As previously noted, the MM waveform is bipolar while HBM and CDM waveforms areprimarily unipolar. However, HBM and CDM testing is done with both positive andnegative polarity pulses. Thus all three models stress the IC in both directions.MIL-STD-883 Method 3015 classifies ICs for ESD failure threshold. The classificationlimits, shown in Figure 11.15, are derived using the HBM shown in Figure 11.13.Method 3015 also mandates a marking method to denote the ESD classification. Allmilitary grade Class 1 and 2 devices have their packages marked with one or two “Δ”symbols, respectively, while class 3 devices (with a failure threshold 4 kV) do not haveany ESD marking. Commercial and industrial grade IC packag
OVERVOLTAGE EFFECTS ON ANALOG INTEGRATED CIRCUITS 11.5 input devices can be protected by using a Schottky diode to clamp the input to within a few hundred millivolts of the negative rail. For a complete description of the output