Transcription
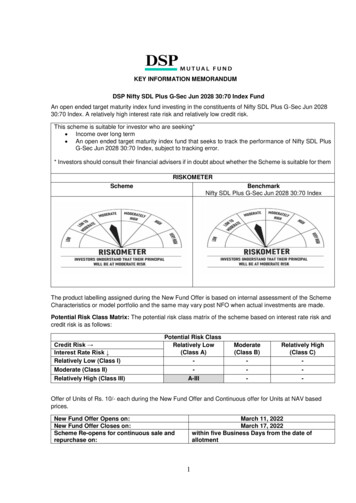
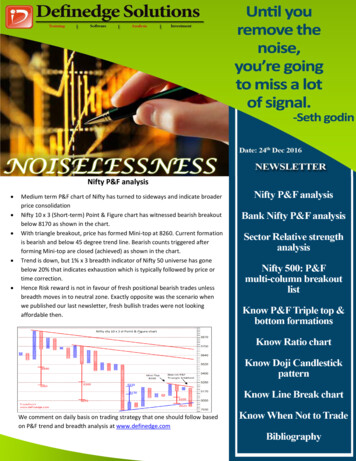
Nifty P&F analysis Medium term P&F chart of Nifty has turned to sideways and indicate broaderprice consolidationNifty 10 x 3 (Short-term) Point & Figure chart has witnessed bearish breakoutbelow 8170 as shown in the chart.With triangle breakout, price has formed Mini-top at 8260. Current formationis bearish and below 45 degree trend line. Bearish counts triggered afterforming Mini-top are closed (achieved) as shown in the chart.Trend is down, but 1% x 3 breadth indicator of Nifty 50 universe has gonebelow 20% that indicates exhaustion which is typically followed by price ortime correction.Hence Risk reward is not in favour of fresh positional bearish trades unlessbreadth moves in to neutral zone. Exactly opposite was the scenario whenwe published our last newsletter, fresh bullish trades were not lookingaffordable then.We comment on daily basis on trading strategy that one should follow basedon P&F trend and breadth analysis at www.definedge.com
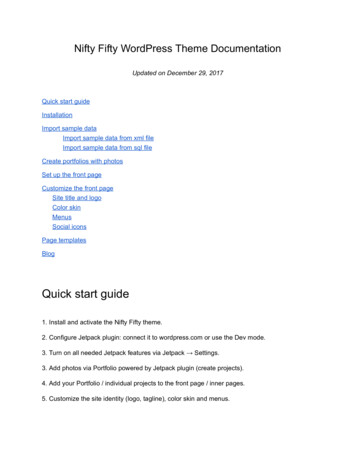
Bank Nifty P&F analysis Bank Nifty 0.25% x 3 P&F chart has triggeredmulti-column breakdown formation as shown inthe chartChart pattern has turned bearish and priceis trading below 45 degree trend lineBearish counts are open in the chart that can bereferred till price maintains the bearish Mini-topprice level which is placed at 18670.Relative strength P&F chart of Bank Nifty to Niftyhas formed bearish follow-through formation thatshows that sector has been one of theunderperformers to Nifty indexLook for next formation when breadth issupportiveMulti-column breakdown pattern and ratio studiesapplied are explained elsewhere in this newsletter
Sector Relative Strength analysisP&F Relative strength charts plot ratio line of two instruments as Point & Figure. Price of numerator is out-performingdenominator if ratio line is rising. Conversely, it is under-performing denominator if ratio line is falling. P&F formationshelp i ide tifyi g a d s ori g the se tors a d it’s o stitutes ased o the RS s ore atrix. Read here to understand themethodology of scoring a chart based on P&F formation of last three columns.Below are the tables showing current performance of sectors based on Relative strength matrix score analysis.
Nifty-500 Index: P&F Multi-column breakout listBelow is the list of stocks from Nifty-500 stock group where Triple top bullish formation is active on higher box value (3%x 3 Point & Figure chart). Pattern is considered as active unless basic sell signal is generated in the chart.
P&F Triple top - Triple bottom patternsWe discussed basic P&F formations during our previous newsletter. Bullish Triple top and Bearish Triple bottom areimportant P&F patterns that shows breakout from strong resistance or support.Triple top buy is a bullish multi-column formation where a column of X has gone up above previous two columns of Xthat happened to be at similar level. Similarly, Triple bottom sell is a bearish formation where a column of O has gonebelow previous two columns of O which were at similar level.Hence it becomes strict five column formation. In case of triple top buy, earlier columns of X at similar levels showedstrong resistance because price reversed from there at least by 3 boxes to generate column reversal formation (note not only time correction). Price overcoming thatsupply zone is a significant informationdisplayed by Triple top signal. Same way, twocolumns of O happened to be at similar levelshows support which when gets broken byconsecutive column is important breakdownpattern shown by Triple bottom sell formation.Below is an example of Triple Top and Triplebottom formations on a P&F chart.It is a rare formation which can be scanned among the group of stocks. Below are the current chart examples showingTriple top and Triple bottom formation on 0.25% x 3 P&F charts of derivative category stocks.
It is a useful formation across timeframe and box-values but have got specific importance when found on higher boxvalue charts. In our newsletters, we have dedicated a section that provides list of stocks from Nifty-500 group whereTriple top signals that are active on the charts. (Active mean basic reversal signal has not come since multi-columnpattern breakout).Read more about their advantages on higher box values.
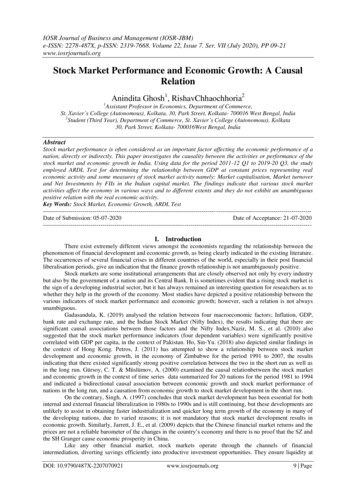
Ratio chartIf we divide the price of one instrument with that of another, we get ratio of their prices. For example, if Bank Nifty istrading at 18000 and Nifty at 8000, we get the ratio of 2.25 if we divide the price of former by latter. Bank nifty is anumerator in this case and Nifty is denominator.It is the ratio of one price to another for that particular period. This way, if we derive the ratio of two instruments ondaily basis, we can plot the daily ratio chart by connecting them. It will look similar to usual line chart plotted byconnecting two prices.Refer daily ratio chart of Bank nifty to Nifty shown below.The ratio line shown in the chart can be analysed and we can apply different techniques of analysis on the ratio charts aswell. But think of it. what does rising ratio mean? For ratio line to go up, numerator instrument will have to producestronger number than denominator instrument. Hence rising ratio line indicates that numerator is outperformingdenominator and falling ratio line suggests that it is underperforming denominator. Note that outperformance doesn'tnecessarily mean that numerator is rising when denominator is falling. It is outperformance when former is rising morethan latter or falling less than it.So when ratio line in the chart shown above is rising, it shows that price of Bank nifty is outperforming that of Nifty. Thiscan become significant information and we can utilise it in different ways. Below are the major ways to take benefit ofratio charts.1 - Pair trading2 - Strength analysis - Sectoral analysis3- Intermarket analysis
Pair trading is popular market-neutral trading strategy among traders where both the instruments are tradedsimultaneously. For example, when ratio line rises, numerator can be bought and denominator can be sold. People usemean reversion techniques on Ratio charts.Sectoral analysis can be performed on Ratio charts by analysing ratio charts of different sectors against Nifty (broadermarket index).Abovechartshowschannelling and trend lineanalysis on ratio charts. Ratiochart of Bank Nifty hasremained in rising channelline for long time showing thebetter performance of BankNifty index. Nifty IT ratio linechart has broken bearishtrend line and seems to havebroken out from bottomingformation.Intermarket analysis is part of Technicalanalysis which examines correlationbetween major asset classes such asstocks, bonds, commodities andcurrencies. John Murphy has explainedit in detail in his classic book onIntermarket analysis. Knowing therelationships between these assetclasses can help the investor todetermine the stage of investing cycle.Read trade-relative-strengthanalysis/
Doji candlestick chart patternAs Steve Nison explains in his popular books on candlestick charts, Doji is a candlestick formation that shows indecisionamong market participants. Perfect doji is defined as a candlestick formation where opening and closing prices aresame. However, some flexibility is applied to this rule, they should be nearly the same.There are different types of doji defined as per the appearance of open and close on a candle. Gravestone doji getsdeveloped when opening and closing prices are at the low of the candle. The name represents the graves of those bullsor bears who have died defending their territory. Longer the upper shadow, the more bearish the implications ofgravestone doji. Similarly, when they are at the highof the day, it is known as butterfly doji. If the openingand closing prices are in the center of the session'srange, the pattern is referred as a rikshaw man doji.The doji formation with long upper and lowershadows is known as long-legged doji.Doji is a useful formation to analyse congestion.Gravestone doji in uptrend and Butterfly doji indowntrend are specific versions of Shooting star andHammer candlestick patterns respectively. Doji needmore confirmation to indicate bottom than they do attop.Look left in the chart for doji, they can can act asimportant reference points. Resistance (supply zone)or Support (Demand zone) can be analysed further inthe price area where multiple dojis have appearedbefore.
While opening of the next candle can be a part of the strategy to trade these formations, NR4 and NR7 discussed duringthe last newsletter can become important combination. Doji when the candle is also narrowest among last four or sevencandle, suggest price squeeze or strong congestion.Below are the examples of current weekly candlestick charts showing Doji along with NR7 formation.Breakout after such types of formations becomes useful information. Next newsletter will talk about wide rangeformations.
Line Break ChartsThree line break charts originated in Japan during 19th century and it was first brought to the other side of world bySteven Nison when he published the book, Beyond Candlesticks. Line Break charts ignore time and volume which issimilar to one aspect of Point & Figure, Kagi and Renko charts. These time independent charts plot only price and onlywhen it moves as per certain criteria. This kind of method of plotting eliminates noise to a larger extent and produceeasily readable patterns.Unlike other time independent charts, Line break charts need only one variable to construct the chart known as reversalvalue. Three Line Break charting method is popular because of reversal value parameter typically being applied.Three Line Break ChartsLine Break charts display a series of vertical boxes (lines) that are based on changes in price. Normally closing prices areused for plotting these charts.Rules for plotting three line break charts are as follows: If three consecutive bullish lines are formed, then a new bearish line is drawn only if price fall below the lowestpoint of the last three bullish lines If three consecutive bearish lines are formed, then a new bullish line is drawn only if price rise above the highestpoint of the last three bearish linesBasically line break chart move only when price trend or reverse by a certain criteria. It condenses the price action ofprice-time charts and display only trending moves. Below is the recent chart of Nifty 50 which is an example of a Threeline break chart. Blue coloured lines are bullish lines and Red lines are bearish lines.In this manner, line break charts can be plottedacross timeframes. These charts are visually veryappealing and shows the clear formations whentrend is in place. By constructing a price chart inthis way, one can easily divide a price betweenbullish and bearish line.It seems that bullish lines should occur morewhen there is uptrend and bearish lines whenthere is downtrend. It is seen that the occurrenceof bullish & bearish lines are in line with themarket tone. Bullish lines dominate in bullishscenarios and bearish lines occur more in downtrending environment. They are close toequilibrium in consolidating phases.
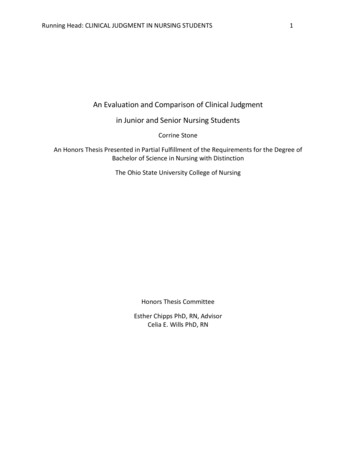
Knowing When Not To Trade - B.KrishnakumarMost of the traders, especially the ones in the early stages of their career, are guilty of over-trading. They fail to realizethat primary objective of a trader is to protect capital and then comes the subject of making money.In this context, one of the key aspects of trading is knowing when not to trade and sit on the sidelines. Not all tradingsystems work all the time. While designing a trading system, it is essential to realize the conditions under which thegiven system performs well.For instance, a trend-following trading system will not work if the price is in a non-trending phase or when the trend istoo stretched.There are tools and indicators to address these two scenarios. The ADX indicator is the most commonly used indicator toassess if the price is in a trending mode or not. One can also use the slope of a moving average or the distance of theprice from the moving average to gain insights about the trend and its strength.But, even in a trending market, there would be times when the trend might have been stretched – popularly known asoverbought or oversold levels. In such scenarios, too, it would make sense to step aside and avoid fresh trades while onecan always ride the trades taken earlier by using trailing stop loss.Whenever price reaches those extremes, it would get into a choppy phase or get into a counter-trend pull back when itwould be difficult to be consistently profitable. Identifying such scenario would help the trader avoid unnecessary tradesand whipsaws.Using a breadth indicator such as the PF Xpercent would not be such a bad idea inthis context. Have a look at the chartbelow which captures the PF X percent ofthe Nifty-50 index.This indicator captures the percentage ofstocks which are currently in a column ofX in the Point and figure Chart. Readingsabove 75 and below 25 would indicateextreme levels where initiation of freshtrades may be avoided. We will discussthis tool at greater length in the nextnewsletter.
BibliographyBollinger, John A., Bollinger on Bollinger Bands, McGraw-Hill, 2001.Nison, Steve, Japanese Candlestick Charting Techniques, Prentice Hall Press; 2nd edition, November 1, 2001.Murphy, John J., Intermarket Analysis, New Jersey: John Wiley & Sons, Inc., 2004Pring, Martin J., Technical Analysis Explained: The Successful Investor’s Guide to Spotting Investment Trends and Turning Points,McGraw-Hill, 2002.Kirkpatrick, Charles D., and Dahlquist, Julie R. The Complete Resource for Financial Market Technicians. New Jersey: PearsonEducation, Inc., 2007Du Plessis, Jeremy, The Definitive Guide to Point and Figure: A comprehensive Guide to the Theory and Practical Use of the Pointand Figure Charting Method, Petersfield: Harriman House Publishing, 2006Dorsey, Thomas J. Point & Figure charting: The Essential Application for Forecasting and Tracking Market Prices. Hoboken, NewJersey: John Wiley & Sons, Inc., 2007Zieg, Kermit C., Point & Figure Commodity & Stock Trading Techniques, Traders Press, Greenville, 1997 cWheelan, Alexander, Study Helps in Point and Figure Technique, Morgan Rogers and Roberts, New York, 1954 and Traders Press,Greenville, 1990
For further enquiries please ---------------------------info@definedge.comTel: 020-65000270, 9764800700DISCLAIMERThe information contained in this document is for general purposes only. The views expressed herein are based on internal data, publicly availableinformation and other sources believed to be reliable. We however, do not vouch for the accuracy or the completeness thereof. We are not registeredinvestment analysts and information in the document is shared only for the purpose of education. The document is given in summary form and does notpurport to be complete. The information/ data herein alone are not sufficient and should not be used for the development or implementation of aninvestment strategy. Any calculations made are approximations, meant as guidelines only, which you must confirm before relying on them. The statementscontained herein are based on our current views and involve known and unknown risks and uncertainties that could cause actual results, performance orevents to differ materially from those expressed or implied in such statements. Past performance may or may not be sustained in future. The investmentsdiscussed or recommended in this report may not be suitable for all investors. The recipient(s) before acting on any information herein should makehis/her/their own investigation and seek appropriate professional advice and shall alone be fully responsible / liable for any decision taken on the basis ofinformation contained herein. While acting upon any information or analysis mentioned in this report, investors may please note that neither Definedgesolutions / research nor any person connected with any associate companies of Definedge solutions / research accepts any liability arising from the use ofthe information and views mentioned in this document.Definedge Solutions17-18, Lokmanya house, Near CNG pump, Paud road, Kothrud, Pune - 411038 www.definedge.com
x Nifty 10 x 3 (Short-term) Point & Figure chart has witnessed bearish breakout below 8170 as shown in the chart. x With triangle breakout, price has formed Mini-top at 8260. Current formation is bearish and below 45 degree trend line. Bearish counts triggered after forming Mini-top are closed (achieved) as shown in the chart .