Transcription
Understanding the CO2 Impacts ofZero-Emission TrucksA Comparative Life-Cycle Analysis of Battery Electric,Hydrogen Fuel Cell and Traditional Diesel TrucksMay 20222110 Powers Ferry Road, Suite 470Atlanta, GA 30339(770) 432-0628ATRI@Trucking.orgTruckingResearch.org
Understanding the CO2 Impacts ofZero-Emission TrucksA Comparative Life-Cycle Analysis of Battery Electric, HydrogenFuel Cell and Traditional Diesel TrucksMay 2022Jeffrey ShortVice PresidentAmerican Transportation Research InstituteAtlanta, GADanielle CrownoverResearch AnalystAmerican Transportation Research InstituteAtlanta, GA950 N. Glebe Road, Suite 210Arlington, Virginia 22203TruckingResearch.org
ATRI BOARD OF DIRECTORSJudy McReynoldsChairman of the ATRI BoardChairman, President and ChiefExecutive OfficerArcBest CorporationFort Smith, ARAndrew BoyleCo-PresidentBoyle TransportationBillerica, MAHugh EkbergPresident and CEOCRST International, Inc.Cedar Rapids, IADarren D. HawkinsChief Executive OfficerYellowOverland Park, KSDerek LeathersPresident and CEOWerner EnterprisesOmaha, NERobert E. LowPresident and FounderPrime Inc.Springfield, MOBenjamin J. McLeanChief Executive OfficerRuan Transportation ManagementSystemsDes Moines, IADennis NashExecutive Chairman of the BoardKenan Advantage GroupNorth Canton, OHBrenda Neville, CAEPresident and CEOIowa Motor Truck AssociationDes Moines, IASrikanth PadmanabhanPresident, Engine BusinessCummins Inc.Columbus, INJames D. ReedPresident and CEOUSA TruckVan Buren, ARLou RivieccioPresident, Corporate TransportationUPSAtlanta, GAJohn A. SmithPresident and CEOFedEx GroundMoon Township, PARebecca BrewsterPresident and COOATRIAtlanta, GAChris SpearPresident and CEOAmerican Trucking AssociationsArlington, VA
ATRI RESEARCH ADVISORY COMMITTEEShawn R. Brown, RACChairmanVice President of SafetyCargo TransportersRob HaddockGroup Director, Planning andLogisticsCoca-Cola North AmericaShelly SeatonVice President of LossPreventionLandstarMichael AhartVP, Regulatory AffairsOmnitracsGlen KedzieVice President, Energy andEnvironmental Affairs CounselAmerican Trucking AssociationsCharles SimpsonVice President, StrategicIntelligenceU.S. XpressKevin LhotakPresidentReliable TransportationSpecialistsRuss SimpsonAmerica’s Road Team CaptainYellowBen BanksVice President, OperationsTCW, Inc.Hayden CardiffCEO and FounderIdelicJoe DarbyDirector, Safety and Risk Control,Transportation and LogisticsPracticeAonBob ElkinsSenior Vice President, IndustryVertical OperationsRuan TransportationManagementMike LudwickChief Administrative OfficerBison TransportSteve OlsonPresident and Chief UnderwritingOfficerGreat West Casualty CompanyClay PorterAttorneyPorter, Rennie, Woodard,Kendall, LLPGary FalldinSr. Director of Industry SolutionsTrimbleDustin RagonLieutenant Commercial CarrierWyoming Highway PatrolMelanie FeeleyAccount ManagerPilot CompanyJeremy ReymerFounder and CEODriverReachJames P. FieldsChief Operating OfficerPitt-Ohio, LLCRob RheaSenior Vice President andGeneral CounselFedEx FreightRickey FitzgeraldManager, Freight and MultimodalOperationsFlorida Department ofTransportationSteven Garrish, CDSVice President of Safety andComplianceOld Dominion Freight LineAmanda SchuierDirector of EmployeeEngagementJetco DeliveryJoe SculleyPresidentMotor Transport Association ofConnecticutMonique StinsonComputational ScientistArgonne National LaboratoryDaniel StuddardPrincipal Planner, TransportationAccess and Mobility DivisionAtlanta Regional CommissionRandy VernonChief Executive OfficerBig G ExpressDoug VossArkansas Highway CommissionEndowed ChairUniversity of Central ArkansasTom WeakleyDirector of OperationsOwner-Operator IndependentDrivers Association FoundationJohn WhittingtonVice President, Legislative AffairsGrammer LogisticsShawn YadonChief Executive OfficerCalifornia Trucking Association
TABLE OF CONTENTSINTRODUCTION . 7Research Objective . 8BACKGROUND. 9Greenhouse Gas Emissions in the U.S. 9Energy Consumption in the Transportation Sector .10Toward Zero-Emission Vehicles .11Realities of Zero-Emission Trucks: What Trucking Companies Need to Know.13REASEARCH APPROACH .16BASELINE ANALYSIS OF CO2 EMISSIONS IN VEHICLE LIFE-CYCLE .17CO2 Emissions: Vehicle Production .17CO2 Emissions: Energy Production and Consumption .20CO2 Emissions: Vehicle Disposal and Recycling .24Final Full Life-Cycle CO2 Emissions .25SCENARIO ANALYSIS .26Internal Combustion Engine (ICE) Scenarios.26Battery Electric Vehicle (BEV) Scenarios.29Fuel Cell Electric Vehicle (FCEV) Scenarios.35CONCLUSIONS .37APPENDIX A: METHODOOGY FOR ICE MPG AND AVERAGE WEIGHT FIGURES .40LIST OF FIGURESFigure 1: 2019 GHG Emissions by Source . 9Figure 2: CO2 Emissions by Economic Sector.10Figure 3: 2019 U.S. Transportation Sector GHG Emissions by Source .11Figure 4: Vehicle Production CO2 Comparison Chart .20Figure 5: Energy Production and Consumption CO2 Comparison Chart .23Figure 6: ICE Lifetime CO2 vs BEV & FCEV .25Figure 7: Per Gallon CO2 Reduction through Diesel Alternatives .28Figure 8: Average Operating Weight Responses.32Figure 9: EIA Projected Fuel Source for U.S. Electricity – 2021-2050 Transportation Mix 34Figure 10: Projected Decrease in Energy Production CO2 for a BEV Truck by 2030 and2050.35Figure 11: Key Findings from the Scenario Analysis .39Figure A1: Ops Costs Average Carrier Weights .414Understanding the CO2 Impacts of Zero-Emission Trucks
LIST OF TABLESTable 1: List of Source Countries for Key Materials .14Table 2: Vehicle Energy Capacity and Range .17Table 3: GREET Vehicle Weight Distribution Assumptions (in lbs.) for Class 8 SleeperCab .18Table 4: Key Materials for Truck Chassis (All Vehicles).19Table 5: CO2 Emissions Total (lbs.): Vehicle Production .19Table 6: Fuel Economy and Lifetime Fuel Consumption (for One Million Miles).21Table 7: Lbs. of CO2 per Unit of Energy.22Table 8: Energy Source for U.S. Electricity Production - Transportation Mix (2019) .22Table 9: Operations: CO2 Emissions from Energy to Drive One Million Miles by VehicleType .23Table 10: CO2 Emissions Associated with Four Methods for Lithium Ion BatteryRecycling .24Table 11: Total Lbs. of CO2 for Vehicle End-of-Life Disposal/Recycling .24Table 12: Total Life-Cycle CO2 Emissions (in lbs.) .25Table 13: Comparison of ICE Fuel Alternatives to Conventional Diesel .27Table 14: Vehicle, Trailer and Cargo Weight .31Table 15: BEV CO2 Reductions due to Electricity Source Changes .34Table 16: Carbon Footprint of SMR and Solar-Based Electrolysis Approaches .36Table 17: Key Findings .38Table A1: Ops Costs Truckload Carriers with Average Operating Weights at or below80,000 lbs. by Year .40Table A2: Ops Costs Trip Types for Truckload Carriers with Average Operating Weightsat or below 80,000 lbs., 2016-2020 .41Understanding the CO2 Impacts of Zero-Emission Trucks5
ACRONYMSAAAACTAmerican Automobile AssociationAdvanced Clean TrucksAEOAnnual Energy OutlookATRI American Transportation Research InstituteB2B5Biodiesel 2%, Petroleum Diesel 98%Biodiesel 5%, Petroleum Diesel 95%B20Biodiesel 20%, Petroleum Diesel 80%B100 Biodiesel 100%, Petroleum Diesel 0%, Pure BiodieselBEVBattery Electric VehicleBTUBritish Thermal UnitCARB California Air Resources BoardCNGCompressed Natural GasCO2DOECarbon DioxideDepartment of EnergyEIAEnergy Information AgencyEPAEnvironmental Protection AgencyFCEV Fuel Cell Electric VehicleGEM Greenhouse Gas Emissions ModelGHG Greenhouse GasGREET Greenhouse Gases, Regulated Emissions, and Energy use in TechnologiesHTSE High-Temperate Steam ElectrolysisHVIP Hybrid and Zero-Emission Truck and Bus Voucher Incentive ProjectICEInternal Combustion EngineLNGLiquefied Natural GasKGKilogramKWH Kilowatt HourMMBTU Metric Million British Thermal UnitMOU Memorandum of UnderstandingNEMS National Energy Modeling SystemNOxNitrogen OxidesOEM Original Equipment ManufacturerSMRSteam Methane ReformingSOHState-of-HealthUSDA United States Department of AgricultureZET6Zero-Emission TruckUnderstanding the CO2 Impacts of Zero-Emission Trucks
INTRODUCTIONWith the introduction of zero-emission trucks (ZETs) to the Class 8 market, the trucking industrymay have viable alternatives to internal combustion engines (ICEs). 1 Unlike ICE trucks, ZETsare not powered with diesel – they instead use electricity that is either stored in batteries orproduced onboard with hydrogen to power an electric motor. The ZET approach to vehiclepropulsion produces no direct tailpipe emissions during operations.From a life-cycle perspective, however, ZETs are still responsible for generating greenhousegases (GHG) such as carbon dioxide (CO2), which is tied to climate change. While CO2emissions are not directly released by a ZET during operations, such emissions are releasedduring the production of ZET fuels (electricity and hydrogen) and the production and disposal ofZET vehicles and their electricity storage equipment (lithium-ion batteries).That said, the core motivations for a shift to ZETs remain environmental, and it may be possibleto decrease the trucking industry’s emissions through their deployment – although the scale ofenvironmental benefit is unclear. 2While the environmental motivation to adopt ZETs is growing, there are several costconsiderations. For the foreseeable future, these include: the replacement of existing Class 8 trucks with significantly higher-priced trucks;an entirely new approach to refueling; andchanges to the operational structure of the trucking industry due to decreased rangecapabilities.While these ZET-related costs may ultimately be passed on to consumers, the trucking industrymust consider the short-term cost implications for investing in ZETs. Additionally, both industryand government must understand the calculus associated with life-cycle environmental impactsof ZETs, as they do not eliminate CO2 emissions. To understand the full environmental andfinancial cost-benefit calculation, it is critical to first document life-cycle emissions for both ICEand ZET trucks. This report focuses on the life-cycle CO2 emissions for the following trucktypes: Internal Combustion Engine Trucks. This is the traditional truck type used by thetrucking industry. ICE trucks have a compression ignition engine that is powered bydiesel. The combustion within the engine requires an exhaust system for the emissions. Battery Electric Vehicle (BEV) Trucks. BEV trucks are a type of ZET that have anelectric motor powered by electricity stored in large onboard lithium-ion batteries. Thisvehicle type does not have tailpipe emissions. While there are millions of heavy-dutyICE trucks currently registered in the U.S., the number of BEV heavy-duty trucks inoperation today is likely more than 50 and growing. Fuel Cell Electric Vehicle (FCEV) Trucks. FCEV trucks are a type of ZET that have anelectric motor powered by electricity produced within a hydrogen fuel cell. The hydrogenCongressional Research Service. “Class 8 Truck Zero-Emission Routes.” February 9, 2021. Available /IN/IN115982 There are several other likely benefits to electric trucks that are not the focus of this paper, which includediversification in energy sources, smoother ride, better acceleration and less complicated repair and maintenance, toname a few.1Understanding the CO2 Impacts of Zero-Emission Trucks7
fuel is stored onboard in large tanks. This vehicle type does not have tailpipe emissions.It is anticipated that FCEV heavy-duty trucks will be commercially available in two tothree years.For each of these truck types the life-cycle CO2 emissions will be calculated. The life-cyclestages are: Vehicle Production. This includes the CO2 emissions released during all vehicleproduction processes, including the extraction of raw materials and final vehicleassembly. For the BEV in particular, this includes both the production of the truck andthe large lithium-ion battery. Energy Production and Consumption. This includes the CO2 emissions released duringthe production of energy (e.g. the production of electricity at a power plant, or therefining of diesel fuel from crude oil). Additionally, this includes the CO2 emissions fromfinal fuel consumption (which only applies to ICE vehicles in this research). Vehicle Disposal and Recycling. This includes emissions related to the disposal orrecycling of the truck and also the disposal and recycling of lithium-ion batteries for theBEV.Research ObjectiveThe purpose of this report is to better understand the life-cycle CO2 emissions of three Class 8sleeper cab trucks. These trucks will be referred to throughout the report as follows: Internal Combustion Engine (ICE) TruckBattery Electric Vehicle (BEV) TruckFuel Cell Electric Vehicle (FCEV) TruckThe life-cycle stages, described earlier, will be referred to as: Vehicle ProductionEnergy Production and ConsumptionVehicle Disposal and RecyclingThe research first sets a baseline life-cycle CO2 calculation for each stage of the ICE truck, andthen compares that ICE baseline to the two other truck types. The research then exploresapproaches to improving emissions for all three vehicle types through improvements intechnology.This research provides industry, government and other stakeholders with a technicalenvironmental impact assessment of switching to ZETs, as well as a glimpse at theadvancements that may be needed to further decrease industry emissions.8Understanding the CO2 Impacts of Zero-Emission Trucks
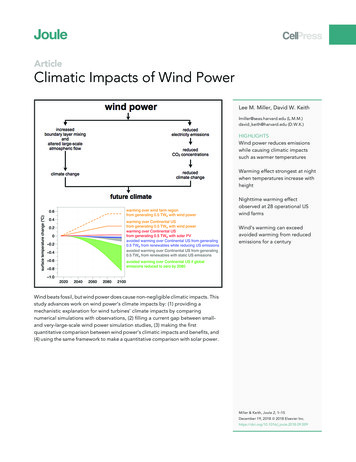
BACKGROUNDGreenhouse Gas Emissions in the U.S.Greenhouse gases such as CO2, which trap heat in the atmosphere, are naturally occurring andare essential to maintaining the global climate; without them the earth would be too cold tosustain human life. That said, when atmospheric GHG concentrations increase beyond anatural equilibrium, global temperatures slowly rise (referred to as climate change). Climatechange has been shown to generate an atypical increase in surface, ocean and atmospherictemperatures along with changes in weather patterns. Long-term concerns related to climatechange include ice shelf melting, sea level rise, and significant changes in local environments.As shown in Figure 1, the largest source of U.S. GHG emissions is found in the transportationsector, followed closely by electricity. 3Figure 1: 2019 GHG Emissions by SourceIndustrial 23%Residential/Commercial 13%Agriculture 10%Electricity 25%Transportation29%Several decades ago, however, electricity was the largest emitter of the primary GHG, CO2(Figure 2). 4 This changed when electric utilities first began to move from coal to natural gasduring the Great Recession. This shift in energy use was the result of low natural gas pricesand underutilized natural gas power plant capacity, and resulted in lower CO2 emissions. 5The shift away from coal after the Great Recession was further motivated by federal policy. TheObama-era Clean Power Plan (2015), which was administrated by the U.S. EnvironmentalUnited States Environmental Protection Agency. (2021). "Inventory of U.S. Greenhouse Gas Emissions and Sinks1990-2019." EPA. Available online: Id yu89kg1O2qP754CdR8Qmyn4RRWc5iodZ4 United States Environmental Protection Agency. "Greenhouse Gas Inventory Data Explorer [Interactive Tool]." EPA.Available ect/current5 Salovaara, Jackson. (2011). “Coal to Natural Gas Coal Switching and CO2 Emissions Reduction.” Harvard KennedySchool. Available online: ions/awp/awp63Understanding the CO2 Impacts of Zero-Emission Trucks9
Protection Agency (EPA), required states to decrease CO2 emissions which ultimately led todecreased coal consumption in the electricity sector. 6Figure 2: CO2 Emissions by Economic MMT CO2 Equivalent2,500YearTransportationElectricity Energy Consumption in the Transportation SectorThe electricity sector’s success with CO2 reduction could be mirrored in the transportation sectorthrough a change in energy sources. The movement of people and goods requires energyconsumption. In the U.S., the majority of transportation-related energy is consumed by lightduty vehicles, which are typically personal vehicles. 7 Freight is also a large consumer oftransportation energy. Maritime, rail, air cargo and trucking – all critical in moving the country’sraw materials and finished goods – generate GHG emissions.Today, the energy used in U.S. transportation is almost exclusively sourced from oil and naturalgas, which are commonly referred to as fossil fuels. The breakout of the U.S. transportationsector GHG is shown by mode in Figure 3. 8United States Environmental Protection Agency. "FACT SHEET: Overview of the Clean Power Plan." EPA.Available online: eet-overview-clean-power-plan.html7United States Department of Transportation. “Energy Consumption by Mode of Transportation.” Bureau ofTransportation Statistics. Available online: e-transportation8 United States Environmental Protection Agency. "Fast Facts on Transportation Greenhouse Gas Emissions." EPA.Available online: portation-greenhouse-gas-emissions610Understanding the CO2 Impacts of Zero-Emission Trucks
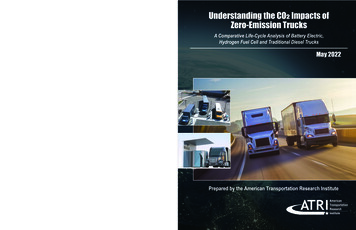
Figure 3: 2019 U.S. Transportation Sector GHG Emissions by SourceShips and Boats 2%Rail 2%Other 5%Light-Duty Vehicles58%Aircraft 10%Medium- and HeavyDuty Trucks 24%Light-duty vehicles are responsible for 58 percent of all transportation GHG, and nearly 17percent of all U.S. GHG emissions. Trucking has a much lower figure, with medium- and heavyduty trucks emitting 24 percent of transportation GHG and 7 percent of U.S. GHG.Toward Zero-Emission VehiclesTo address air pollution and CO2 emissions within the transportation sector, there has been amovement toward zero-emission vehicles that has strengthened in recent years, particularlythrough state-level environmental goals and regulations.Incentive programs designed to move the trucking industry toward ZETs currently exist for bothtruck manufacturers (referred to as OEMs) and motor carriers. For example, the U.S.Department of Energy (DOE) awarded 127 million to its SuperTruck 3 program in 2021 – thesefunds will assist commercial motor vehicle manufacturers in the advancement of battery electricand fuel cell electric vehicles. 9Requiring ZET sales through regulations is another approach. The California Air ResourcesBoard (CARB) Advanced Clean Trucks (ACT) rule requires medium- and heavy-duty vehiclemanufacturers to sell ZETs as a portion of total sales within California. The ACT rule containsthe following new truck sales requirements by 2035:U.S. Department of Energy. “DOE Announces 162 Million to Decarbonize Cars and Trucks.” Energy.gov. April 15,2021. Available online: million-decarbonize-cars-and-trucks; andBabcock, Stephane. (November 3, 2021). “U.S. DOE Announces More than 127 Million for SuperTruck 3.” ACTNews. Available online: g the CO2 Impacts of Zero-Emission Trucks11
55 percent of trucks Class 2b-3 must be ZETs;75 percent of Class 4-8 straight truck sales must be ZETs; and40 percent of tractor-trailers must be ZETs. 10Additionally, a proposed amendment to the ACT rule would require all trucks sold in California tobe ZETs by 2040. Other states have moved in this direction: there is a new 17-statememorandum of understanding (MOU) that has a goal of phasing out traditional ICE trucks infavor of ZETs. 11 The MOU aims to reach 30 percent ZET sales for all new medium- and heavyduty trucks by 2030, with 100 percent of sales being zero-emission by 2050. 12The trucking industry’s response to these initiatives is to adopt, or prepare to adopt, new trucktechnologies offered by vehicle manufacturers. Adoption of these vehicles does offerchallenges, including significant changes to freight business models and considerably higheroverhead costs in the near-term. Some trucking companies will simply not be able to usetoday’s ZET technologies as part of their operations.Independent of the industry’s ability to use ZETs, there is a movement to mandate that motorcarriers based in California purchase and utilize ZETs. CARB has developed a draft mediumand heavy-duty zero-emission fleet rule known as Advanced Clean Fleets to accelerate thenumber of medium- and heavy-duty ZET in use. 13 If adopted, it will require motor carriers toinclude an increasing percentage of ZETs in their fleet beginning in 2025.According to one source, by the end of 2021 there were 1,215 ZETs deployed in the U.S., themajority of which were BEVs. 14 Of these, the report states that 47 were classified as heavy-dutytrucks, though this figure has grown during 2022. This stands in stark contrast to the 23 millionICE Class 2b through Class 8 trucks on U.S. roads today. 15 Thus, real-world ZET operationaland performance data is very limited.Newer diesel engines have played a role in decreasing CO2 emissions compared to earlierdiesel engines. For example, the Diesel Technology Forum stated in comments submitted tothe U.S. Senate that the more efficient diesel trucks that have been sold since 2010 have saved12 billion gallons of fuel, which resulted in a reduction of “126 million tons of greenhouse gasemissions between 2011 and 2018.” 1610 California Air Resources Board. “Advanced Clean Trucks Fact Sheet.” 2021. Available s/advanced-clean-trucks-fact-sheet11 Lewis, Michelle. (April 1, 2022). “Nevada pledges to electrify all new trucks and buses by 2050.” Electrek. Availableonline: lectrify-all-new-trucks-and-buses-by-2050/12 California Air Resources Board. “15 states and the District of Columbia join forces to accelerate bus and truckelectrification.” 2021. Available online: trification13 California Air Resources Board. “Advanced Clean Fleets.” Available online: lean-fleets/about14 Al-Alawi, et al. (January 2022). “Zeroing In On Zero-Emission Trucks”. CALSTART. Available 2/02/ZIO-ZETs-Report Updated-Final-II.pdf15 MJB & A. (2021). “Medium- & Heavy-Duty Vehicles: Market structure, Environmental Impact, and EV Readiness.”Available online: EDFMHDVEVFeasibilityReport22jul21.pdf16 Diesel Technology Forum. (March 16, 2021). “Continued Investment, Innovation in Advanced Technology DieselEngines Sustains Clean Air and Climate Progress.” Bloomberg. Available online: -progress12Understanding the CO2 Impacts of Zero-Emission Trucks
The Forum’s comments list the progress that is being made with diesel technology: “newtechnology diesel engines have eliminated more than 26 million tons of nitrogen oxides (NOx)already since 2010,” and “it would take more than 60 new-generation diesel trucks to equal theemissions from one truck sold in 1988.” 17Realities of Zero-Emission Trucks: What Trucking Companies Need to KnowWhile there is a strong public policy push toward ZET adoption, there are several criticalrealities that the trucking industry faces:Vehicle Cost. ZET vehicle costs (especially for early adopters) will be a strong barrier to entry.While a new Class 8 diesel truck tractor may cost roughly 135,000 - 150,000, the purchaseprice of a new Class 8 BEV can be as much as 450,000. 18 ACT Research estimates that thebattery pack for a Class 8 BEV accounts for roughly 55 percent of the cost of the BEV truck. 19This cost, in theory, may fall as battery production and the extraction of raw materials expands.The same issue will likely impact the FCEV. Estimates for fuel cell truck costs range from 200,000 to 600,000 with 60 percent of the overall cost solely credited to the fuel cellpropulsion system. 20 The fuel cell propulsion unit and hydrogen storage system together areestimated to comprise roughly 80 percent of the total vehicle cost. Additionally, the hydrogenrequired to power an FCEV is costly; 70 percent of retail hydrogen stations in California sellhydrogen above 16 per kilogram. 21Sourcing of Materials and Supply Chain Issues. There are several key raw materials needed forlithium-ion batteries; depending on the battery chemistry, these might include lithium, graphite,cobalt, manganese and nickel. 22 While the aforementioned list of materials are critical forbatteries and for the production of a large BEV national fleet, the U.S. is almost entirelydependent on other countries for these materials. Over the past decade, the U.S. has importednearly 100 percent of the critical minerals needed for battery production from countries includingChina, Australia and Chile. 23 The main source countries for these materials are listed in Table1. 24Ibid.Hirsch, Jerry. (January 4, 2022). “The Electrification Journey”. Transport Topics. Available tion-journey19 Stinson, Jim. (September 14, 2021). “Money and range: Experts note roadblocks to EV adoption”. Transport Dive.Available online: ic-trucks-battery-infrastructure/606386/20 Sharpe, Ben and Hussein, Basma. (February 2022). “A meta-study of purchase costs for zero-emission trucks.”International Council on Clean Transportation. Available online: hase-cost-ze-trucks-feb22-1.pdf21 California Energy Commission and California Air Resources Board. (December 2021). “Joint Agency Staff Reporton Assembly Bill 8: 2021 Annual Assessment of Time and Cost Needed to Attain 100 Hydrogen Refueling Stations inCalifornia.” California Energy Commission. Available online: 12/CEC-600-2021-040.pdf22 United States Geological Survey. (January 2022). “Mineral Commodity Summaries: Lithium.” Departmen
Understanding the CO2 Impacts of Zero-Emission Trucks 21 Because there is limited real-world data available for Class 8 BEV fuel economy, the fuel economy figure used in the analysis (0.438 miles per kWh) is based on OEM spec sheet figures for eight heavy-duty trucks. These eight trucks are part of a California Air Resources Board